
Magnet Wall Indicator: No-Repaint ATR Trend-Band System with Bar Coloring and Signal Alerts

Introduction
Trend identification is the single highest-leverage skill in technical trading. Get it right and almost any entry rule produces positive expectancy; get it wrong and even the most refined entry system bleeds capital. The challenge, however, is that the most popular trend tools — moving averages, MACD, ADX — all have lag built into their construction. They tell the trader where the market has been, not where the structural balance of supply and demand currently sits. A 200-period EMA on a daily chart is still pointing up days after a major reversal has begun.
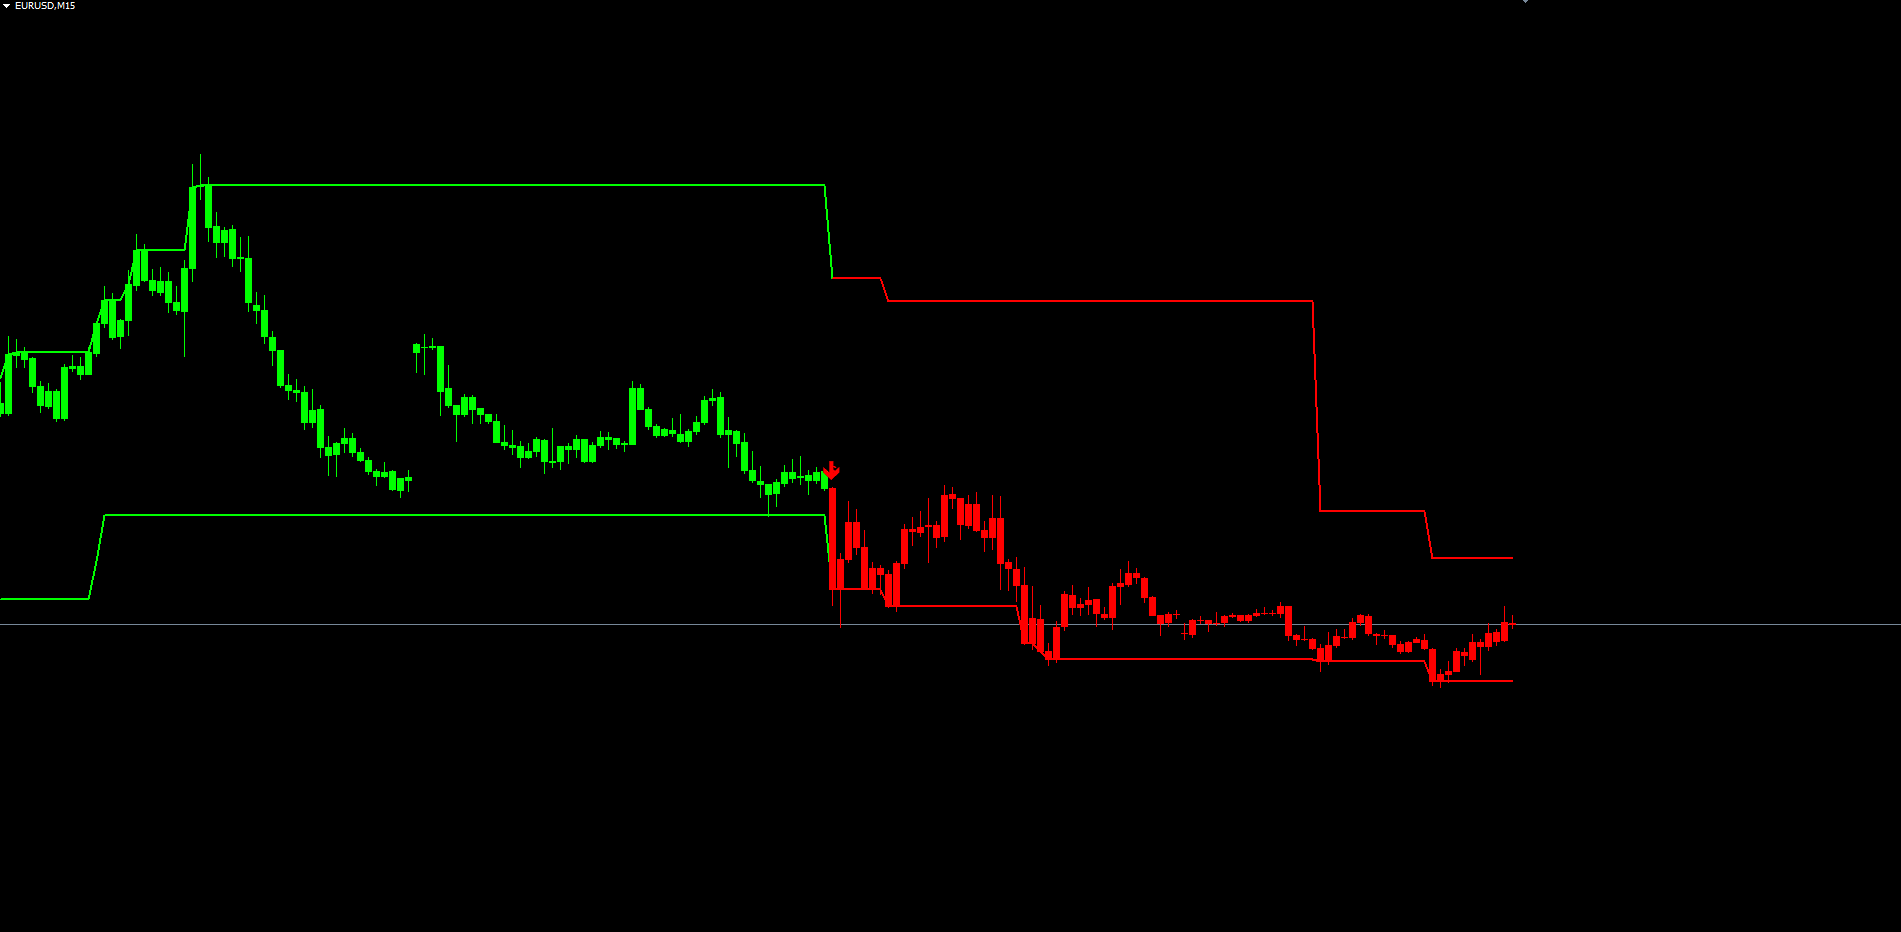
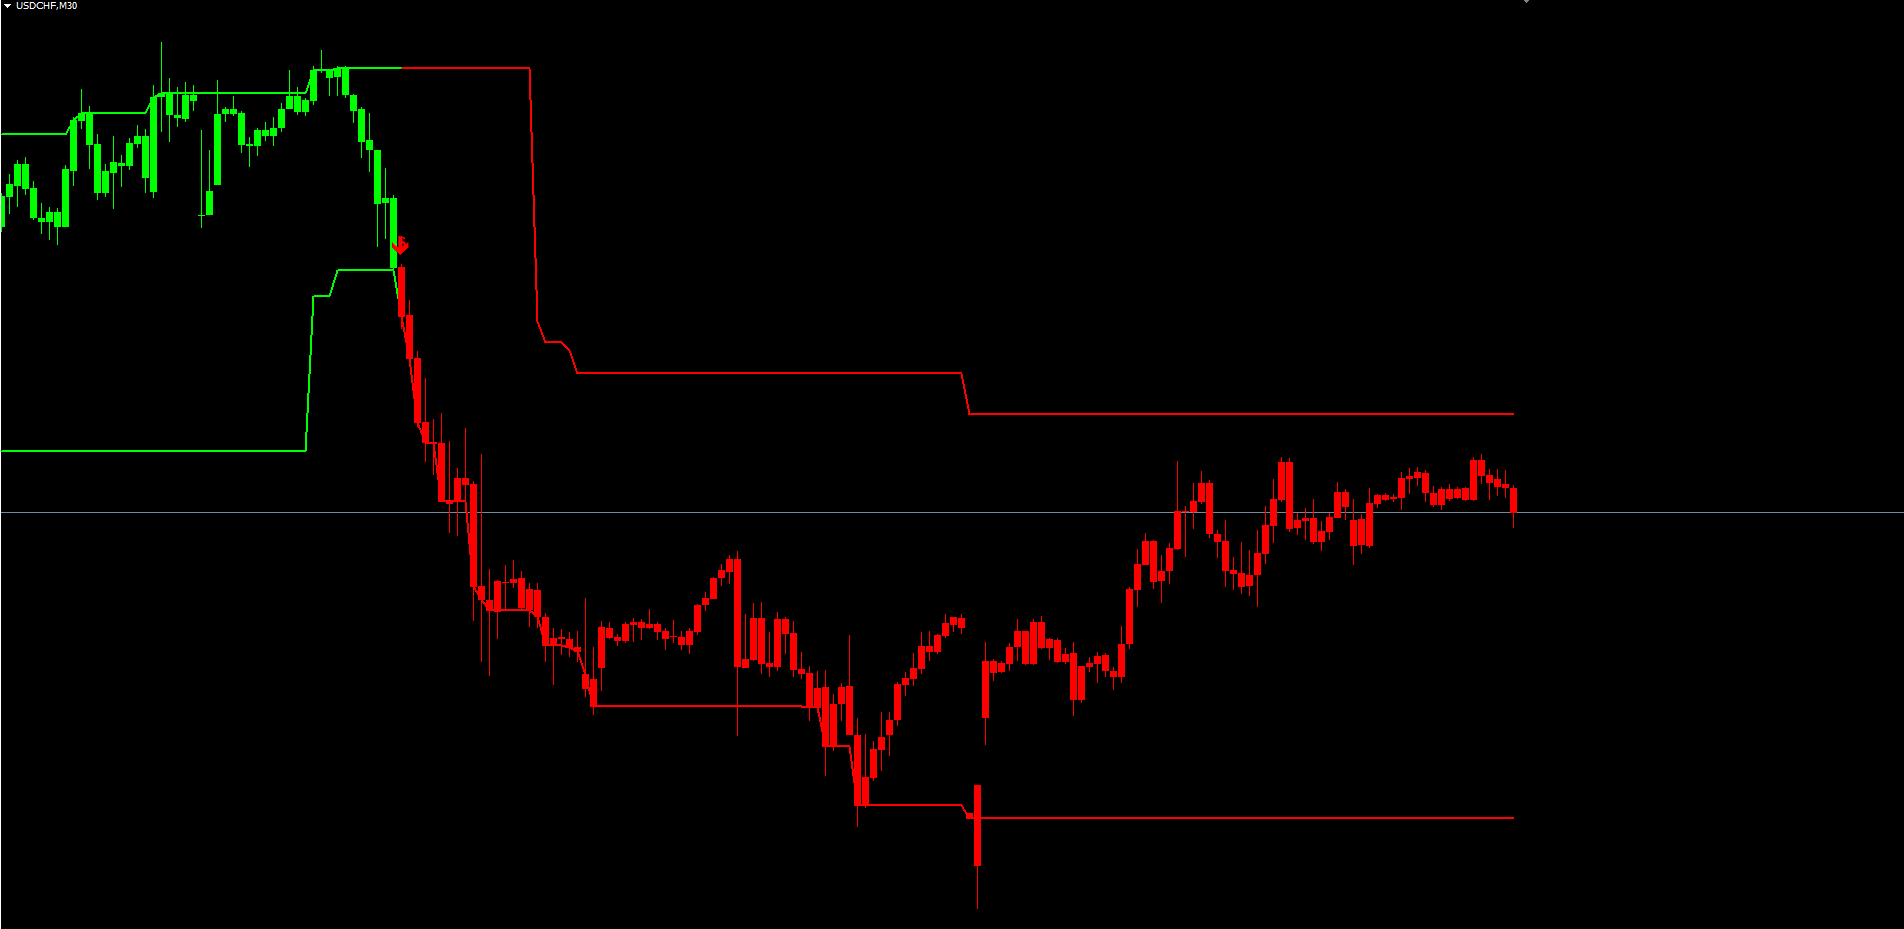
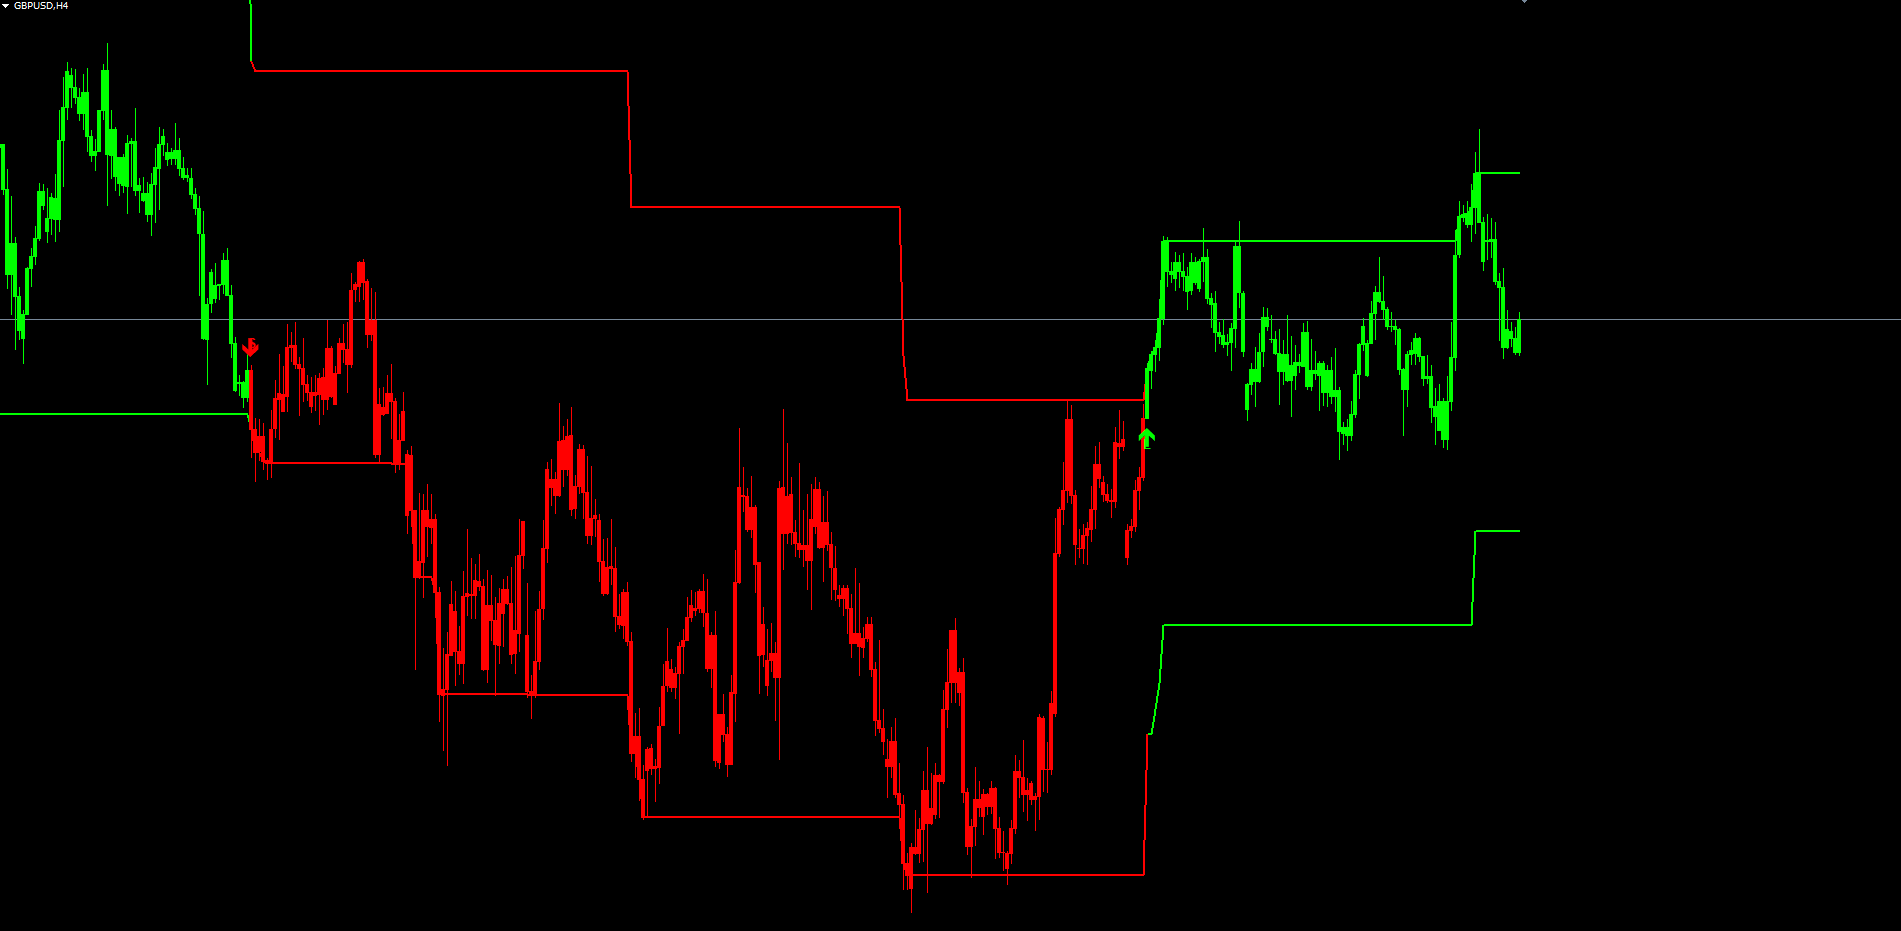
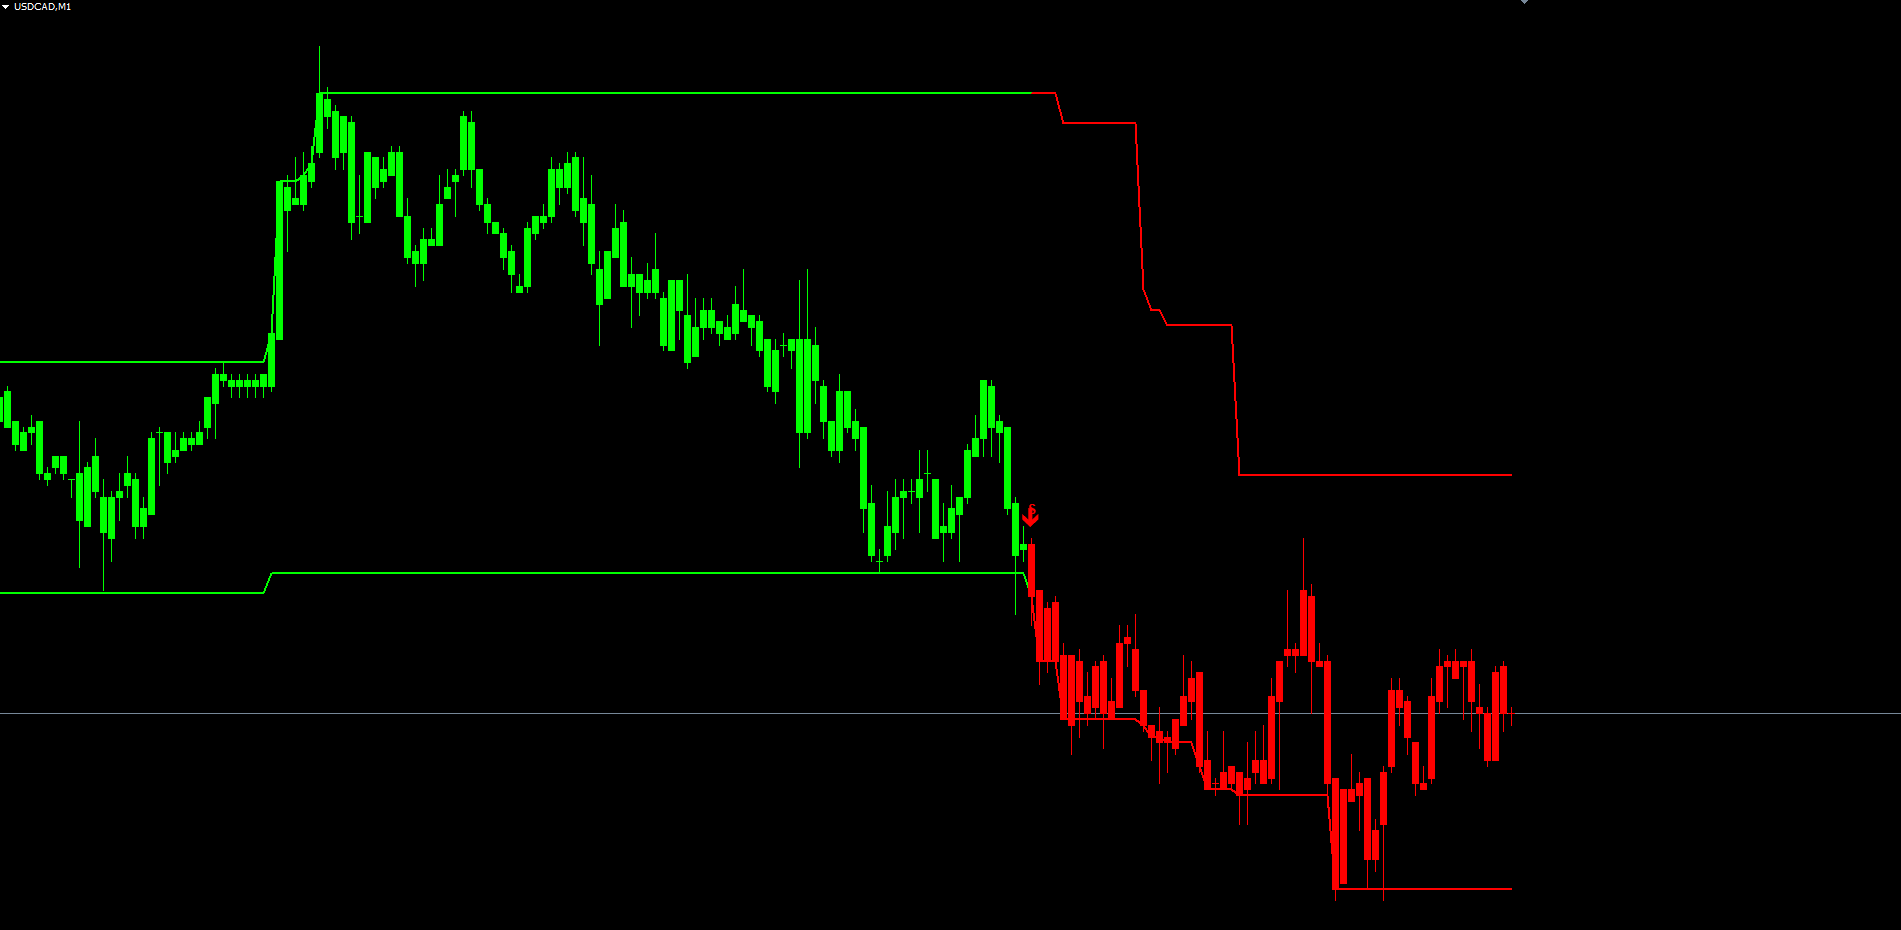
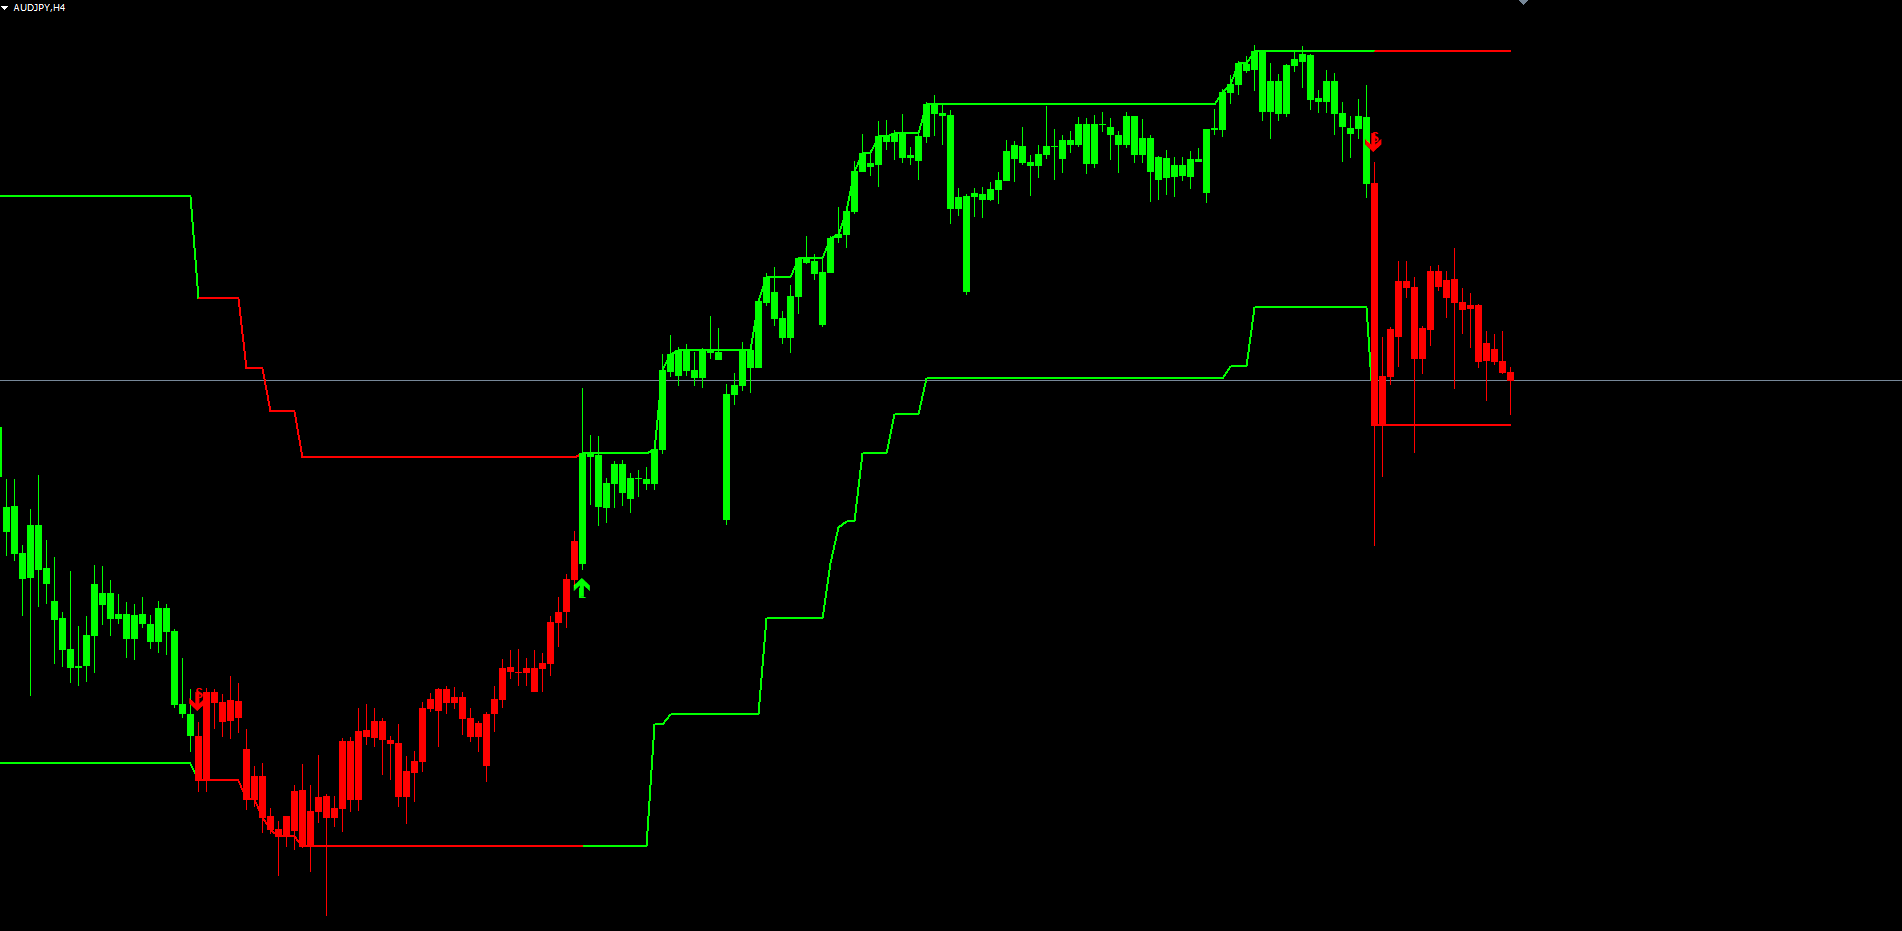
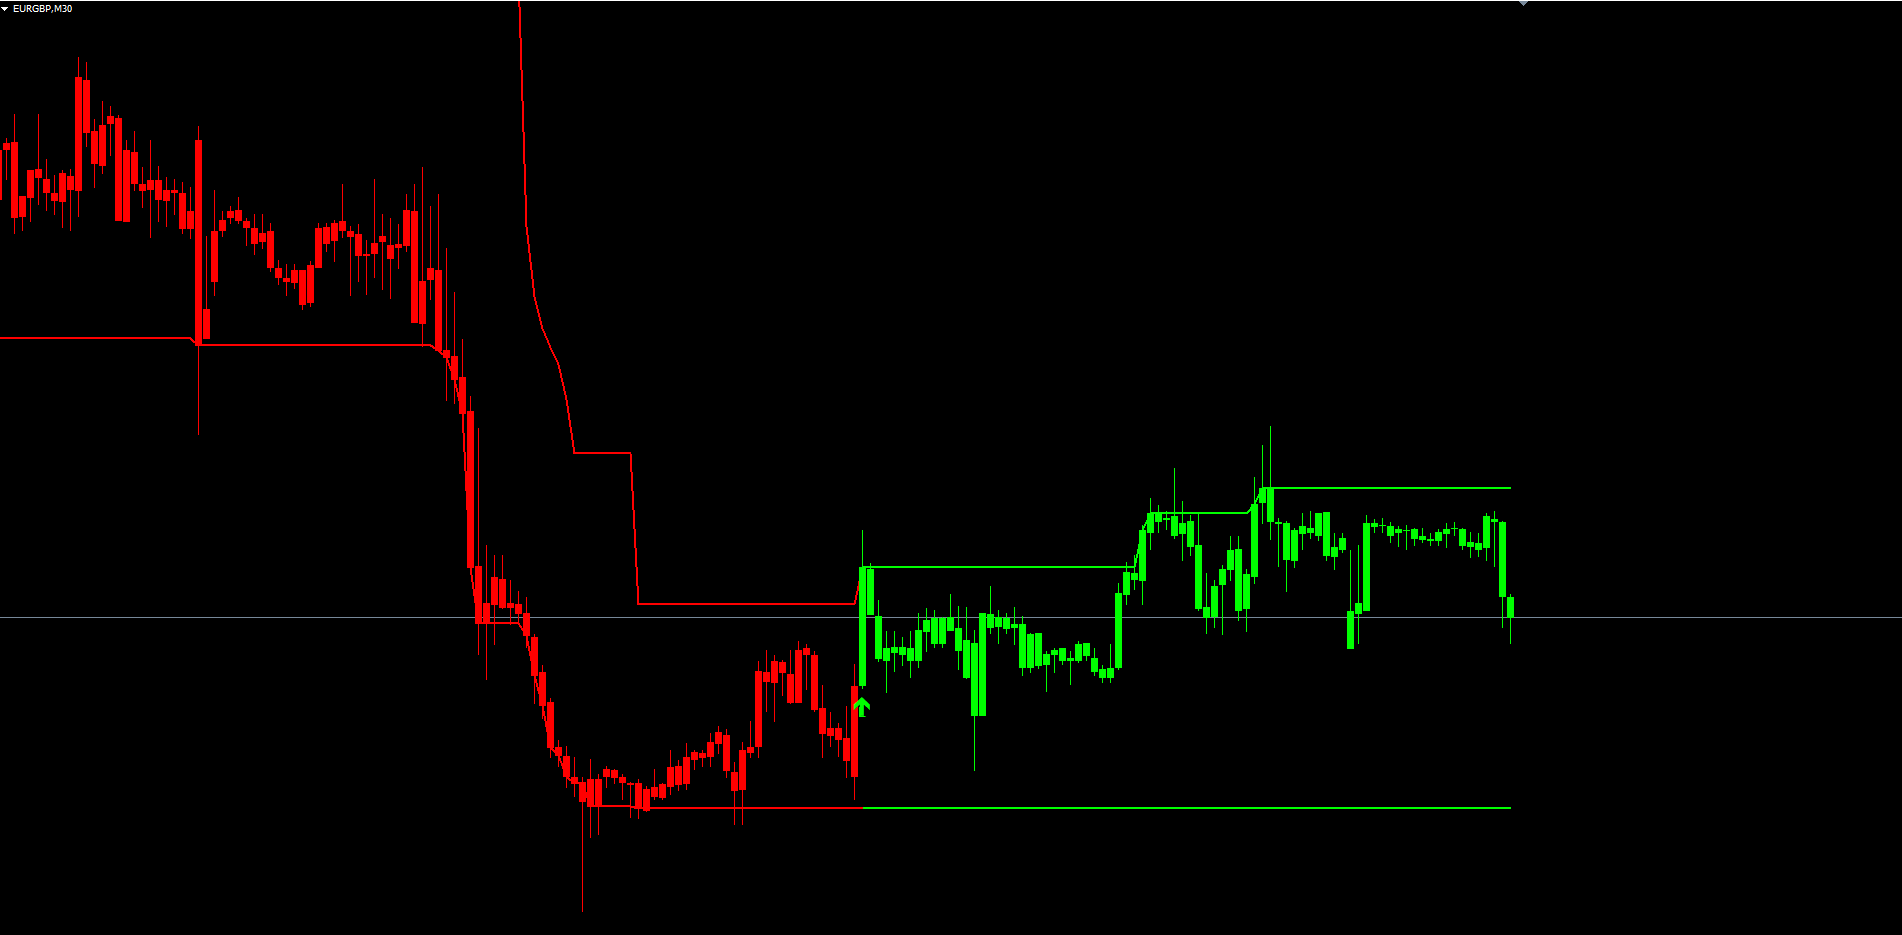
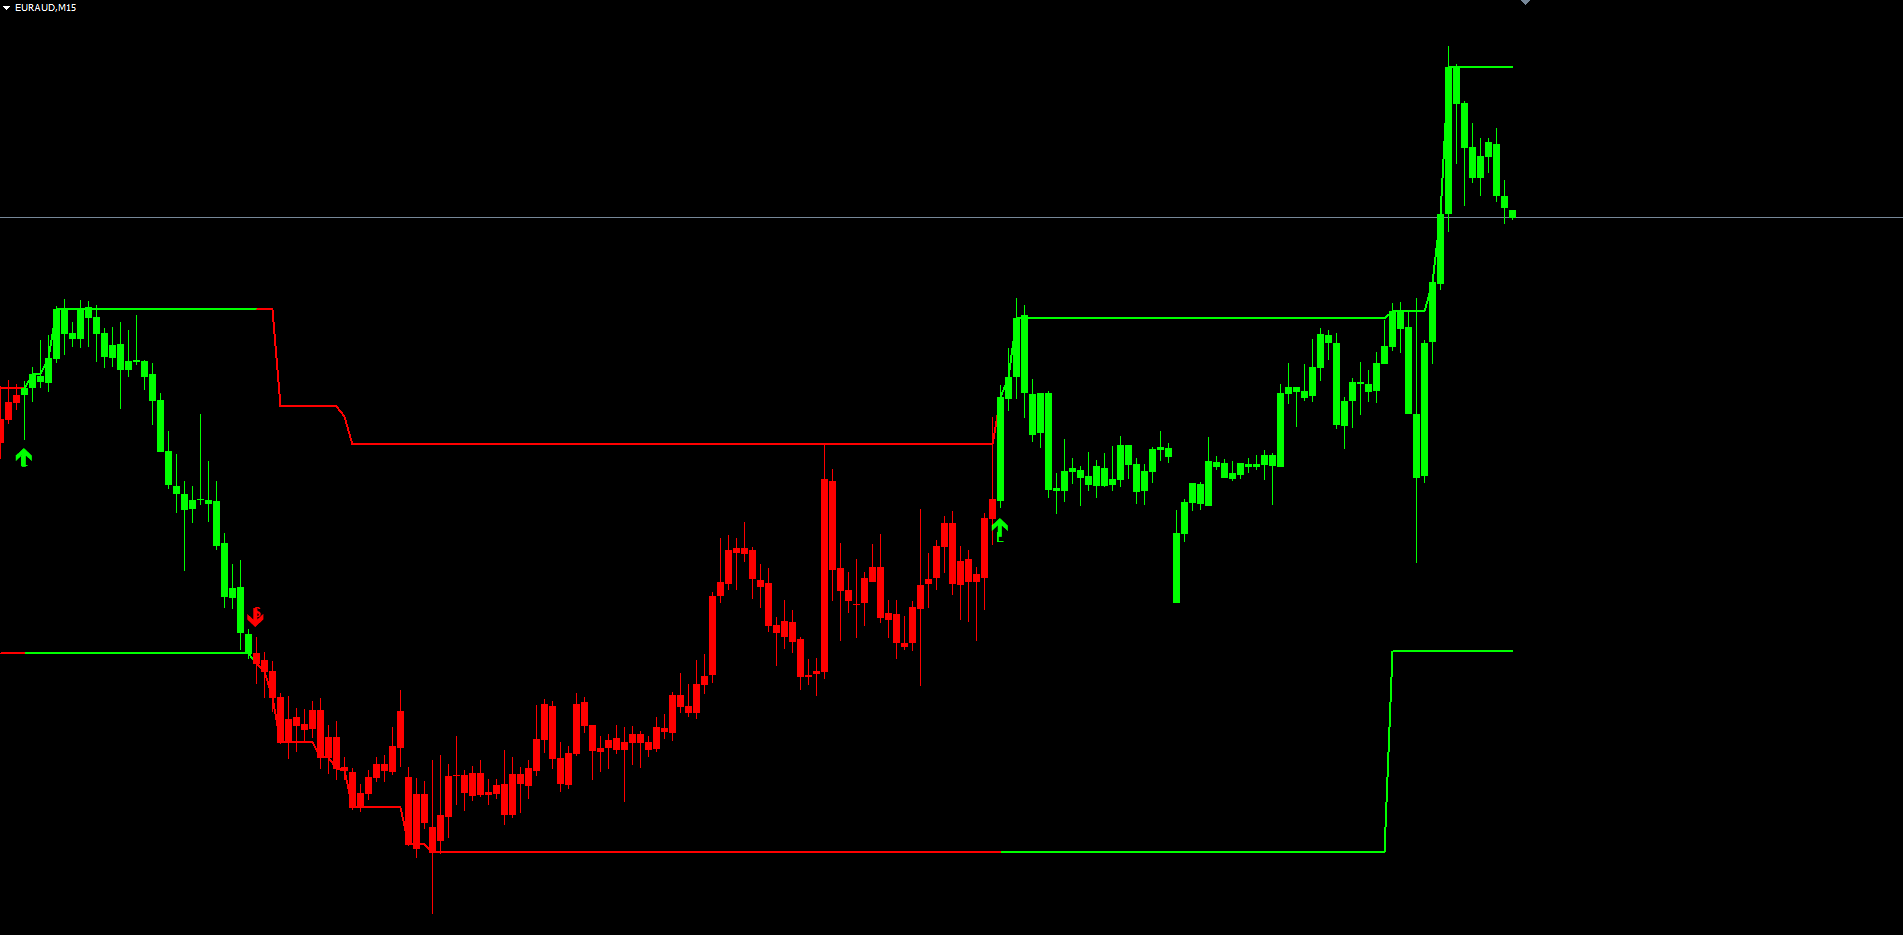
Magnet Wall Indicator takes a different approach. It builds two adaptive bands above and below price using the Wilder Average True Range, and treats those bands as magnetic walls — they hold price during a trend and flip when price closes outside them. The inactive wall freezes during noise; the active wall only moves when the structural side of the trend has been broken. The result is a pair of trend boundaries that are rigid through normal volatility yet decisive when a genuine reversal occurs. Bars and bands recolor on every flip, an "L" or "S" label is plotted at the reversal bar, a buy or sell arrow marks the change, and a complete alert package fires through popup, push, email, and sound channels.
The indicator is available for both MetaTrader 4 and MetaTrader 5, with 100% identical visual and internal logic between the two platforms.
Download the indicator:
- MetaTrader 5: Magnet Wall MT5
- MetaTrader 4: Magnet Wall MT4
The non-repainting architecture guarantees that every signal printed on the chart is permanent — bands, bar colors, labels, and arrows on closed bars never change once written, and alerts fire only on the just-closed bar after the indicator has finished its initial-load scan. This article explains the underlying algorithm — which is not a standard Supertrend — walks through every component of the indicator, and provides a complete parameter reference so traders can configure it for their own markets and timeframes.
What Are Trend Bands and "Magnetic Walls"
A trend band is an adaptive line plotted above or below price at a distance proportional to recent volatility. Unlike a static support level — which is a horizontal line drawn at a fixed price — a trend band moves with the market. As volatility expands, the band sits further from price; as volatility contracts, the band tightens. The most recognizable example is the Bollinger Band, which uses a moving average plus or minus a standard-deviation envelope.
The "magnetic wall" terminology comes from the way these particular bands behave during an active trend. A genuinely trending market will repeatedly retrace toward the band on the trend side without breaking through it — buyers in an uptrend defend the lower band, sellers in a downtrend defend the upper band. The band acts as if it is magnetically attracting price, allowing the market to test it and bounce. When price finally closes outside the wall, that defense has broken, and the structural balance of the trend has shifted.
For the trader, a wall that holds is a trend-continuation signal. A wall that breaks is a reversal signal. The two states are mutually exclusive and together cover every bar of price action. There is no "neutral" or ambiguous state — at every closed bar, either the wall held or it did not, and the indicator commits to that conclusion before the next bar opens.
The Limitation of Static Trend Indicators
Every popular trend indicator is either a smoothed moving average or a momentum oscillator (RSI, MACD, ADX). Both share the same structural flaw: they are lagging by construction. A 50-period EMA cannot turn until enough bars close in the new direction to drag the average around. A momentum oscillator cannot register a trend change until rate-of-change has accumulated enough directional bars to flip. Trying to compensate with faster lookbacks just increases noise sensitivity; slower lookbacks reduce noise but increase the lag the trader was trying to avoid.
Trend bands sidestep the trade-off. They are not derived by averaging price — they are computed from the range of recent bars (Wilder ATR) and snapped to the high or low extreme on each closed bar. The bands track actual extreme points rather than a delayed mathematical average of them. When price makes a new local high, the upper wall moves to that high; when price stays inside the previous range, both walls freeze. No averaging, no momentum integration, no calculation-driven lag.
The Asymmetric Breakout-Anchor Algorithm
This is where Magnet Wall Indicator differs from every popular trend-band system on the market, and the mechanism that gives the bands their "magnetic wall" behavior. The algorithm is published under the name fontilab.getTrendBands in the TradingView public library and is fundamentally different from the more common Supertrend. A standard Supertrend recomputes both the upper and lower bands on every bar, regardless of which side price is interacting with. The result is two bands that constantly drift in lockstep — they never "lock" into place during a trend, which means they shift whenever volatility changes, even if the actual trend structure is intact.
The Magnet Wall algorithm operates under three rules that fire on every closed bar:
Rule 1 — Outside-up bar. When the source price closes above the previous upper band, that's a structural bullish break. The new upper band snaps to the higher of the previous upper band or the maximum of the current and previous source price. The lower band may move down to upper − delta (where delta = ATR × multiplier) only if doing so does not contradict an existing structural floor — specifically, if the new candidate lower is below the previous lower, or if the upper band itself didn't move. Otherwise the lower band stays put. The net effect: the upper wall expands to the new extreme; the lower wall holds unless the structural floor has loosened.
Rule 2 — Outside-down bar. Mirror image. When the source closes below the previous lower band, the new lower band snaps to the lower of the previous lower or the minimum of the current and previous source. The upper band may move down to lower + delta only if it does not contradict an existing structural ceiling — otherwise the upper holds.
Rule 3 — Inside bar. When the source closes between the two bands (which is the most common state during a trend), both bands freeze. Neither wall moves, the trend reading remains unchanged, and price is allowed to retrace freely toward the trend-side wall without disturbing the indicator's state.
The asymmetry is the key. In Supertrend, both bands move every bar; in Magnet Wall, only the band that price actually broke moves, and the inactive band freezes. This means that during a trend, the trend-side wall acts as a stable structural reference that price can repeatedly retrace toward without flipping the indicator's reading. The wall is "magnetic" — it attracts price through normal pullbacks but only releases when price closes through it.
The pseudocode for the algorithm, with upperb_p , lowerb_p , upp_p , and low_p denoting the previous bar's state values:
delta = Multiplier * Wilder_ATR(AtrLen) if source > upperb_p: // outside-up upperb = max(upperb_p, max(source, source_prev)) upp = upp_p low = upperb - delta lowerb = (low < lowerb_p) || (low > lowerb_p && upperb == upperb_p) ? lowerb_p : low else if source < lowerb_p: // outside-down lowerb = min(lowerb_p, min(source, source_prev)) upp = lowerb + delta low = low_p upperb = (upp > upperb_p) || (upp < upperb_p && lowerb == lowerb_p) ? upperb_p : upp else: // inside — freeze both upperb = upperb_p; lowerb = lowerb_p upp = upp_p; low = low_p midb = (upperb + lowerb) / 2 trend_up = midb > midb_prev trend_down = midb < midb_prev
The trend reading is derived from the midline (upperb + lowerb) / 2 . When the midline rises bar-over-bar, the trend is up; when it falls, the trend is down. A signal change fires on the first bar where the midline reverses direction — those are the bars where the "L" / "S" labels and buy / sell arrows are plotted on the chart.
Wilder ATR and Why It Matters
The Average True Range is the band-distance driver. The indicator uses Wilder's ATR — the 1978 J. Welles Wilder formulation: a recursive smoothing where the current ATR equals the previous ATR times (period − 1)/period plus the new true range divided by period . This matches Pine Script's ta.atr() and MetaTrader's built-in iATR() exactly.
True range captures gap-driven volatility — it is the larger of (high − low), |high − previous close|, and |low − previous close|. Important for stocks and indices that gap over weekends or news.
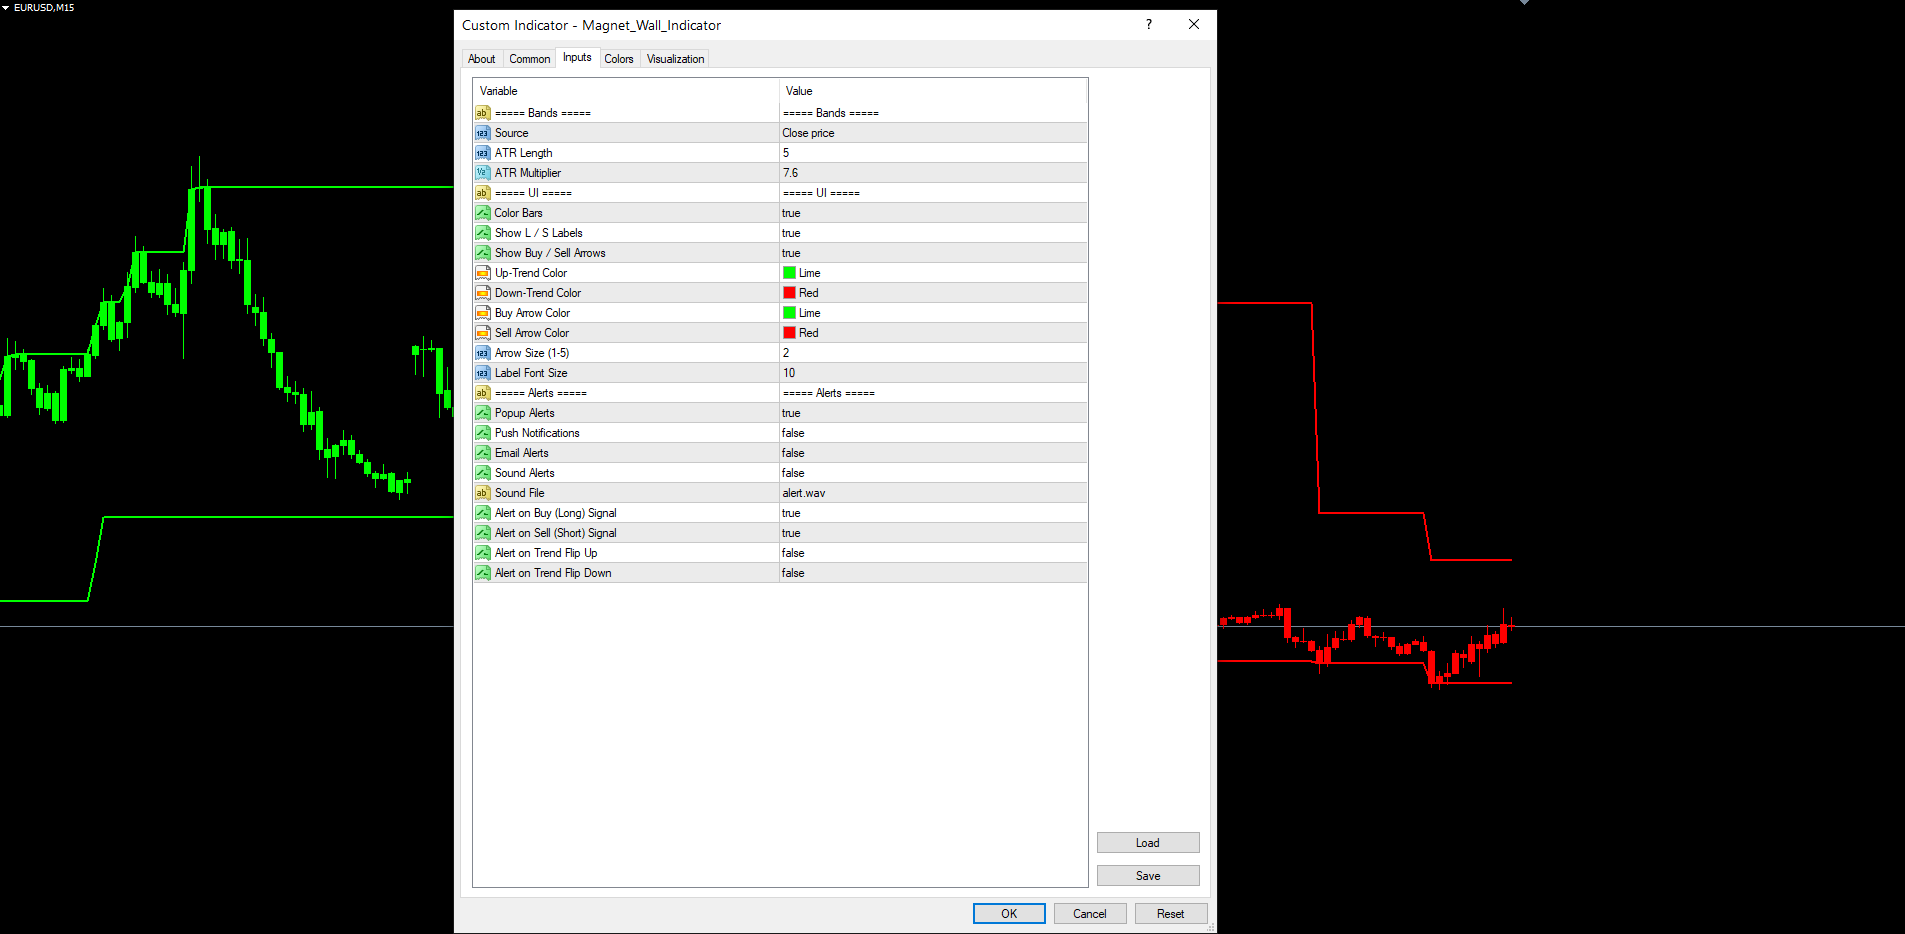
The default ATR period is 5 ( AtrLen = 5 ) — shorter than the standard 14 used in most Wilder indicators. Magnet Wall uses a short ATR because the goal is to capture recent volatility for the wall distance, not a long-term average. With a 5-bar ATR, the band-width adapts within a single session. Combined with the default multiplier of 7.6, walls sit 30–80 pips from price on major forex H1 — wide enough to absorb normal noise but tight enough that breakouts are decisive.
The multiplier is the primary tuning knob: 4.0 produces tight, frequently-flipping bands suitable for scalping; 12.0 produces wide bands that flip only on major structural breaks suitable for daily / weekly position trading. The right setting depends on the timeframe, the instrument's noise profile, and the trader's risk tolerance.
Color-Coded Bands and Bar Coloring
Magnet Wall draws two bands on the chart at all times — the upper and lower walls. Each band recolors automatically whenever the trend direction flips. During an uptrend, both walls are painted in ColorUp (default: lime green); during a downtrend, both walls are painted in ColorDown (default: red). On the bar where the trend flips, both colors are written to the same bar so that the line connects across the transition without a visual gap.
The recoloring is implemented under the hood with two buffers per band: an "up-color" buffer and a "down-color" buffer, with EMPTY_VALUE written to whichever buffer is not currently active. This is the cleanest way to switch a single visual line between two colors in MetaTrader's buffer-based plotting model, and it is bit-identical between MT4 and MT5.
When ColorBars = true (the default), the indicator additionally paints every candle in the active-trend leg with the trend color. This is the equivalent of Pine Script's barcolor() function, which has no native MetaTrader counterpart. The implementation uses paired histogram buffers (a pattern borrowed from MetaTrader's own built-in Heiken Ashi indicator): four buffers per color, two paired pairs — one pair for the wick (high-to-low vertical line, thin) and one pair for the body (open-to-close vertical line, thick). The result is colored candles that overlay the chart's native candles on every active-trend bar, giving an immediate visual read on the prevailing direction without needing to look at the bands themselves.
The bar coloring can be turned off ( ColorBars = false ) for traders who prefer to keep the chart's native candle colors and use only the bands as the trend reference. Both colors ( ColorUp , ColorDown ) are user-configurable inputs — a trader who prefers a darker green or a softer red for chart aesthetics can set any color from MetaTrader's full 16M palette. The default values match the Pine Script source's color.green and color.red .
Signal Markers — Labels and Arrows
A trend reading by itself is a continuous state — at every bar, the trend is either up or down. What the trader needs to see distinctly is the change — the specific bar on which the trend reversed. Magnet Wall plots two markers on every signal-change bar to make these moments immediately visible.
The "L" / "S" label is an OBJ_TEXT marker placed below the bar's low (for a buy / Long signal) or above the bar's high (for a sell / Short signal). The text reads "L" or "S" in the trend's color. The label is offset from the bar by 0.3 × ATR(30) so it sits in clear space below or above the candle without touching the wick. The label's font size is configurable ( LabelFontSize , default 10) and the text uses Arial Bold for crisp rendering at any zoom level.
The buy / sell arrow is an OBJ_ARROW marker (Wingdings character 233 for up, 234 for down) placed at the bar's high or low — closer to the bar than the L/S label. Buy arrows use ANCHOR_TOP , which puts the arrow tip at the price level and the arrow body extending downward, so the arrow reads as "below the bar pointing up". Sell arrows use ANCHOR_BOTTOM , which puts the tip at the high and the body extending upward — "above the bar pointing down".
Both markers have independent toggle inputs ( ShowLabels , ShowArrows ) and their colors are independently configurable — the L/S labels inherit ColorUp / ColorDown , while the arrows have their own ArrowBuyColor and ArrowSellColor inputs. A trader who wants the bands and bars in one color scheme but the arrows in a different scheme (for example, neon arrows on a dark theme) can configure them separately.
A critical implementation detail: the buy and sell arrows do not use OBJ_ARROW_BUY or OBJ_ARROW_SELL . Those object types are reserved by MetaTrader for trade-history visualization (showing actual filled orders on the chart) and frequently render as nothing when created from inside an indicator. Magnet Wall uses the generic OBJ_ARROW with explicit Wingdings codes 233 and 234, which renders reliably on every broker terminal and every chart configuration.
All marker objects are anchored to bar time (not bar shift), so they remain locked to their original bar even as new bars form on the chart and the bar indexing shifts. Object names use the MWI_ prefix and include the bar's UNIX timestamp, making them unique per signal — re-runs of OnCalculate are idempotent and do not create duplicate markers. The OnDeinit handler cleans up every MWI_ object so the chart is left clean when the indicator is removed.
No-Repaint Architecture
Repainting is the most common — and most damaging — flaw in trend-band indicators. An indicator that evaluates conditions on the current, still-forming bar can show a signal that disappears when the bar closes at a different price. During the bar's formation, price may temporarily breach a band, causing the indicator to display a flip. If price then pulls back before the bar closes, the flip vanishes as if it never existed. The chart looks perfect in hindsight because every "wrong" signal was silently removed, but in live trading the trader sees signals that vanish on the next tick.
Magnet Wall eliminates repainting through three architectural rules:
-
Signal evaluation only on closed bars. The OnCalculate loop processes bars from oldest to newest, but the buy/sell signal logic, label placement, and arrow placement only fire when the bar's index satisfies shift >= 1 — meaning the bar has fully closed. The current forming bar (shift = 0) is never the source of a label or arrow.
-
Bar-time anchoring for all markers. Every label and arrow is placed via ObjectCreate with the bar's UNIX timestamp as the anchor time. When new bars form, the bar shift indices change, but the timestamps do not — so each marker stays locked to its original bar regardless of how many new bars appear after it.
-
Buffered state with platform-managed shift. The indicator maintains seven internal state buffers (upper band, lower band, upper-anchor, lower-anchor, midline, last trend state, and color state) using MetaTrader's indicator-buffer system. MT4 and MT5 automatically shift these buffers as new bars form, so the state at any historical bar is preserved for the life of the indicator on the chart.
Alerts have their own protection: they fire only when shift == 1 (the just-closed bar) and when prev_calculated > 0 (the indicator's initial-load scan has completed). This prevents the indicator from spamming dozens of historical-signal alerts the moment it is attached to a chart with many years of history. The first time the indicator sees a fresh signal after the initial load, exactly one alert fires per signal bar regardless of how many ticks arrive.
The combination of these rules means the chart's signal history is permanent. A trader can leave the indicator running for weeks, scroll back through hundreds of bars of history, and every label and arrow they see will be at the same bar where it was originally plotted. The indicator's track record is verifiable visually — there is no possibility that a flattering historical signal was retroactively removed.
The Alert System
Alerts are the trader's connection to the indicator when they are not actively watching the chart. Magnet Wall ships with a complete alert package covering four event types and four delivery channels.
Event types (toggled independently):
- Buy signal — fires when the trend reverses from down to up. Default: enabled.
- Sell signal — fires when the trend reverses from up to down. Default: enabled.
- Trend flip up — fires on every bar where the midline rises after being flat or falling. Default: disabled. Useful for traders who want a higher-frequency trend-confirmation feed independent of the buy/sell signal logic.
- Trend flip down — mirror of the flip-up event. Default: disabled.
Delivery channels (also toggled independently):
- Popup — MetaTrader's built-in Alert() dialog. Default: enabled.
- Push notification — SendNotification() to the user's MetaQuotes mobile ID. Requires the trader to set their MetaQuotes ID in Tools > Options > Notifications. Default: disabled.
- Email — SendMail() via the SMTP credentials configured in Tools > Options > Email. Default: disabled.
- Sound — PlaySound() with the file specified in AlertSoundFile (default: alert.wav , which ships with every MetaTrader installation). Default: disabled.
The alert message includes the indicator name, the symbol, the timeframe, the signal price, and the timestamp of the signal bar — all the information the trader needs to act on the alert without opening the chart. Per-bar dedupe ensures each signal fires its alert exactly once: even if multiple ticks arrive on the just-closed bar (which can happen on highly active pairs), the dedupe variable g_lastBuyTime blocks any further alerts for that bar.
Traders who want both fine-grained trend tracking and clean reversal signals can enable both the buy/sell events (for actionable signals) and the trend-flip events (for early-warning notifications). This is especially useful in volatile markets where the trend can flip multiple times within a single session — the trend-flip alerts fire on every change, while the buy/sell alerts only fire on the first flip after a confirmed prior trend.
Practical Trading Workflow
The indicator is designed to be the trend-direction component of a complete trading system, not a standalone trade-entry signal. A typical workflow integrates Magnet Wall with one or more entry-timing tools.
Step 1 — Determine the trend on a higher timeframe. Drop the indicator on the H4 or D1 chart of the instrument you trade. The trend color visible on the latest bar — green or red — defines the bias for all lower-timeframe entries. Only consider buy entries when the higher-timeframe trend is up; only consider sell entries when it is down.
Step 2 — Use a lower timeframe for entry timing. With the higher-timeframe bias confirmed, switch to your trading timeframe (M15 for intraday traders, H1 for swing traders) and use a separate entry tool — RSI levels, candlestick patterns, support/resistance bounces, or a second copy of Magnet Wall with a tighter multiplier — to time the actual entry. Magnet Wall provides the trend, not the timing.
Step 3 — Pyramid into the trend, not against it. When the higher-timeframe trend is up and price retraces to the lower wall on the trading timeframe, that is a high-probability long entry. The wall has held, the bands are still green, and the bar coloring is still in the trend color. Each successive retracement-to-wall is a continuation entry, not a reversal entry.
Step 4 — Exit on a trend flip. A red label and down-arrow on the trading timeframe is the exit signal for any open long position. Conversely, a green label and up-arrow is the exit signal for any open short. Traders who want to give the trend more room can require confirmation from the higher timeframe before exiting (i.e., wait for the H4 to also flip), accepting larger drawdown but reducing exit whipsaws.
Step 5 — Stay flat during conflict. When higher and lower timeframes show different trend colors, the market is in a transitional state — either a counter-trend retracement that will reverse, or the leading edge of a higher-timeframe flip. This is the lowest-edge environment for the indicator and a good time to stay flat or reduce position size.
This workflow is consistent with the indicator's design intent: it is a trend-following tool, not a counter-trend reversal scanner. Trades taken in the direction of the trend color on the trading timeframe — and aligned with the trend color on the higher timeframe — represent the highest-probability subset of all signals the indicator generates.
Configuration Examples
The default settings ( AtrLen = 5 , Multiplier = 7.6 ) are tuned for H1 forex on major pairs. Adjusting these for other instruments and timeframes is the primary tuning task.
Tight bands — scalping and lower timeframes
Setting Multiplier = 4.0 (or even 3.0) produces narrow bands that flip frequently. Suitable for M5 and M15 on liquid forex pairs where the trader is targeting 10–20 pip moves per signal. The cost is more whipsaws — expect 30–50% of signals to be reversed within a few bars.
| Setting | Value |
|---|---|
| AtrLen | 5 |
| Multiplier | 4.0 |
| Source | PRICE_CLOSE |
| ColorBars | true |
| ShowLabels | true |
| ShowArrows | true |
Default — H1 to H4 swing trading
The original Pine Script defaults. Suitable for major forex pairs on H1 or H4. Two to five signals per week per pair on H1, one to three per week on H4.
| Setting | Value |
|---|---|
| AtrLen | 5 |
| Multiplier | 7.6 |
| Source | PRICE_CLOSE |
Wide bands — daily and weekly position trading
Setting Multiplier = 12.0 produces wide bands that capture only the largest structural shifts. Suitable for D1 or W1 charts where the trader is positioning for multi-week trends. Signal frequency drops to a few per quarter on most pairs.
| Setting | Value |
|---|---|
| AtrLen | 5 |
| Multiplier | 12.0 |
| Source | PRICE_CLOSE |
| AlertOnTrendUp | true |
| AlertOnTrendDown | true |
For cryptocurrency or volatile indices, raise AtrLen to 10 or 14 ( Multiplier stays at 7.6) to smooth out micro-volatility while keeping the band-distance proportional to the instrument's typical range.
Parameter Reference
Bands
| Parameter | Default | Description |
|---|---|---|
| Source | PRICE_CLOSE | Price source for band calculation. Selectable from the standard ENUM_APPLIED_PRICE list (Close, Open, High, Low, HL2, HLC3, HLCC4) |
| AtrLen | 5 | Wilder ATR period — number of bars for ATR smoothing |
| Multiplier | 7.6 | ATR multiplier — wider value produces wider bands and fewer flips |
UI
| Parameter | Default | Description |
|---|---|---|
| ColorBars | true | Paint candles in the active-trend color |
| ShowLabels | true | Show "L" / "S" text labels on every signal-change bar |
| ShowArrows | true | Show buy / sell arrows on every signal-change bar |
| ColorUp | clrLime | Up-trend color (bands, bars, label text) |
| ColorDown | clrRed | Down-trend color (bands, bars, label text) |
| ArrowBuyColor | clrLime | Buy-arrow color (independent of ColorUp) |
| ArrowSellColor | clrRed | Sell-arrow color (independent of ColorDown) |
| ArrowSize | 2 | Arrow size (1 to 5) |
| LabelFontSize | 10 | Font size for the L / S text labels |
Alerts
| Parameter | Default | Description |
|---|---|---|
| AlertPopup | true | Show MetaTrader's built-in popup dialog |
| AlertPush | false | Send push notification (MetaQuotes ID required) |
| AlertEmail | false | Send email (SMTP credentials required) |
| AlertSound | false | Play sound file |
| AlertSoundFile | alert.wav | Sound file — built-in MetaTrader sounds: alert.wav, alert2.wav, news.wav, ok.wav, etc. |
| AlertOnBuy | true | Fire alert on buy (Long) signal |
| AlertOnSell | true | Fire alert on sell (Short) signal |
| AlertOnTrendUp | false | Fire alert on every up-trend midline flip (more frequent than buy signals) |
| AlertOnTrendDown | false | Fire alert on every down-trend midline flip |
Installation
MT4
The indicator is delivered as a single .ex4 binary purchased from the MQL5.com Market. After purchase, it installs automatically into the user's MT4 terminal — find it under Navigator > Indicators > Market and drag onto any chart.
For source code (provided to the buyer): copy Magnet_Wall_Indicator.mq4 to <Terminal Data Folder>\MQL4\Indicators\ and compile in MetaEditor with F7. Zero errors and zero warnings expected.
MT5
Same procedure as MT4 — install via the MQL5.com Market for an automatic installation. For source: copy Magnet_Wall_Indicator.mq5 to <Terminal Data Folder>\MQL5\Indicators\ and compile in MetaEditor.
The MT5 version uses handle-based ATR ( iATR + CopyBuffer into a global array on every OnCalculate ) and creates all chart objects in OnTimer (every 500 ms) per MT5's object-rendering rules. The MT4 version creates objects directly in OnCalculate . Both architectures produce identical visual output bar-for-bar.
Conclusion
Magnet Wall Indicator is built for traders who want a structural, no-repaint trend reading without the lag of moving-average systems or the fragility of standard Supertrend. The asymmetric breakout-anchor algorithm produces walls that hold through normal noise and flip decisively on genuine reversals. Color-coded bands, optional bar coloring, signal labels, buy/sell arrows, and a complete alert package give the trader every visual cue and notification channel needed to act on the trend.
The indicator is a trend-direction component to be combined with the trader's preferred entry-timing tool. In a multi-timeframe workflow it provides the structural trend reading that almost every profitable trading system relies on as its first input.
Download the indicator:
- MetaTrader 5: Magnet Wall MT5
- MetaTrader 4: Magnet Wall MT4
CONTACT & SUPPORT
- Email: info@forexobroker.com
- Questions: Use the Comments section on the product page or send a private message
- Bug Reports: Please include your broker name, account type, and a screenshot
-
✅ All MQL Tools: https://www.mql5.com/en/users/forexobroker/ ✅
--------------------------------------------------------------------------------------------------------------
🏦 **Broker I use**: https://icmarkets.com/?camp=55869
🏦 **Broker For EU Traders I use 1**: https://www.ictrading.com?camp=91414
🏦 **Broker I use 2**: https://one.exnessonelink.com/boarding/sign-up/a/c_thuv62ocfq
💻 **VPS**: https://chocoping.com/processing/aff.php?aff=738
💼 **Companies I use for getting funded**:
Fundednext: https://fundednext.com/?fpr=kestutis39
The5ers: https://www.the5ers.com/?afmc=16kl
FTMO: https://trader.ftmo.com/?affiliates=nRAyOhmFRnEnFdOpdLeh
Risk Disclaimer
Trading foreign exchange and CFDs on margin carries a high level of risk and may not be suitable for all investors. You may sustain a loss exceeding your initial investment. Trend Quorum is a technical analysis tool and does not guarantee profitable trades. Past performance is not indicative of future results. The authors accept no liability for any loss arising from use of the indicator. By using Trend Quorum you acknowledge sole responsibility for your trading decisions.


")
![[XAUUSD]: Weekly Liquidity Activation Points (timings), June 22-26, 2026](https://c.mql5.com/6/1013/splash-preview-771790.png "[XAUUSD]: Weekly Liquidity Activation Points (timings), June 22-26, 2026")
