
MACD Stochastic Cross Is Not Enough
There are a great deal of interpretations of the “MACD Stochastic Cross” trading strategy and the principle is sound if you have the correct time frame to trade. One thing lacking in many of these strategies is a simple and repeatable entry and trade management strategy. Let’s start with the basics of the strategy first and then the true Roller Coaster.
The Overbought zone starts at 80% and then the Oversold Zone begins at 20% which are conservative but safer. These zones are subjective, and some traders use 75% and 25% respectively.
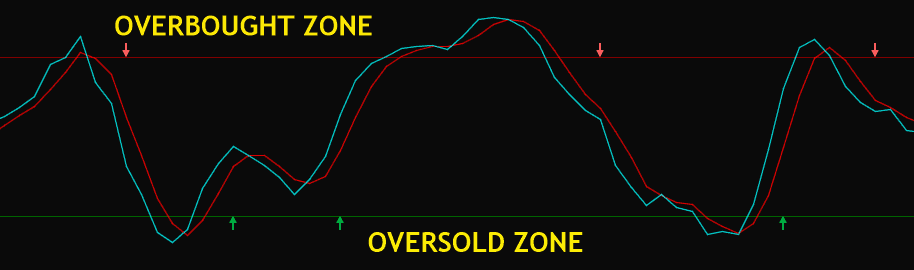
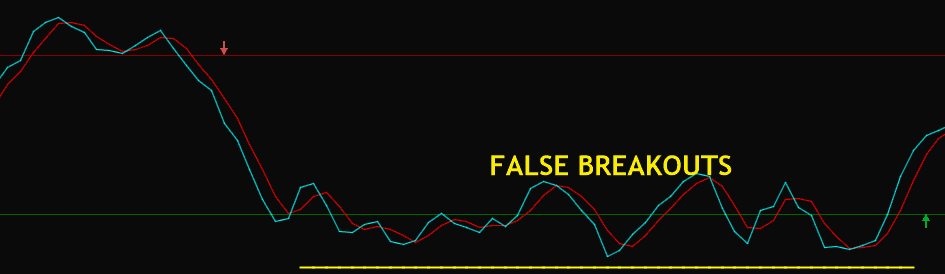
However, it’s a myth that when the stochastic is in the overbought zone it is a sell signal and vice versa for the oversold zone. We need more information before we buy or sell as the stochastic can have false breakouts in any of the zones if the trend is strong, as used in our Elliott Wave Indicator Suite.
MACD, Moving Average Convergence/Divergence
By adding a MACD to the Stochastic we are adding another layer of confirmation of a move out of the Stochastic zones mentioned above. The MACD is a “Trend Following Indicator” and the Navigator or Back Seat Driver!
The MACD indicator is a collection of 3 exponential moving averages (EMA’s) calculated from historical price data, most often the closing price. These are a Fast, Short Period, EMA and s Slow, longer period, EMA. The third is an average of the MACD itself. Now this sounds very complicated and trading education guru’s like to look clever explaining this. Just remember the MACD is trend following and compares set EMA’s and looks at the average.
The setting for these can be very numerous depending on what type of instrument and time frame you are trading. A common setting that compliments the Stochastic in this combination strategy is 12,26,9. Where the Fast EMA is 12, the Slow EMA is 26 and the Average is 9.
MACD Stochastic Cross Strategy
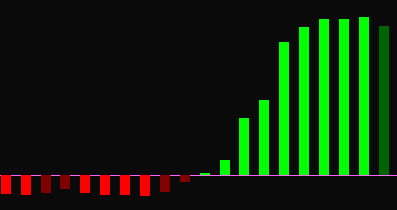
So now we have a Driver and a Navigator for our trading strategy, we have increased the probability of success! The MACD is used to filter moves when the stochastic is overbought or oversold as it lags the Stochastic. Thus, eliminating some of those false breakout moves mentioned above. Using the Histogram part of the MACD is what is required, moving from Red to Green and Vice versa.
There are two main problems now, we are adding more real estate to our charts and we don’t have a simple and repeatable entry and trade management strategy. Our Roller Coaster Indicator Suite has solved these problems!
The Roller Coaster
As the name implies, we want to ride the roller coaster from overbought to oversold zones of the stochastic as with the normal MACS Stochastic Cross strategy. However, we want a simple and repeatable entry strategy. Also, we don’t want to exit a trade as soon as we get in the opposing stochastic zone, as it may move to a false breakout state and start trending.
With this in mind we hacked our already proven entry and trade management strategy from our B.I.T.S (Breakout Intelligent Trading Signals) Strategy. Where we use a combination of 3 EMA’s specially designed for all instruments and time-frames that we call our Points of Control (POC). We have a Core, Leading and Lagging point of control.
Buy States
When the Stochastic crosses in the oversold zone and leaves it. And the MACD Histogram moves from negative (Red) to Positive (Green). Then we can say we are in a Buying State. But we need confirmation for entry. And so, when our Leading POC is above the Core and then the Lagging POC is below the Core, then we have a strong Buy State on the close of the candle. This gives a high probability entry Long.
Sell States
When the Stochastic crosses in the overbought zone and leaves it. And the MACD Histogram moves from Positive (Green) to Negative (Red). Then we can say we are in a Selling State. But we need confirmation for entry. And so, when our Leading POC is below the Core and then the Lagging POC is above the Core, then we have a strong Sell State on the close of the candle. This gives a high probability entry Short.
Trade Management
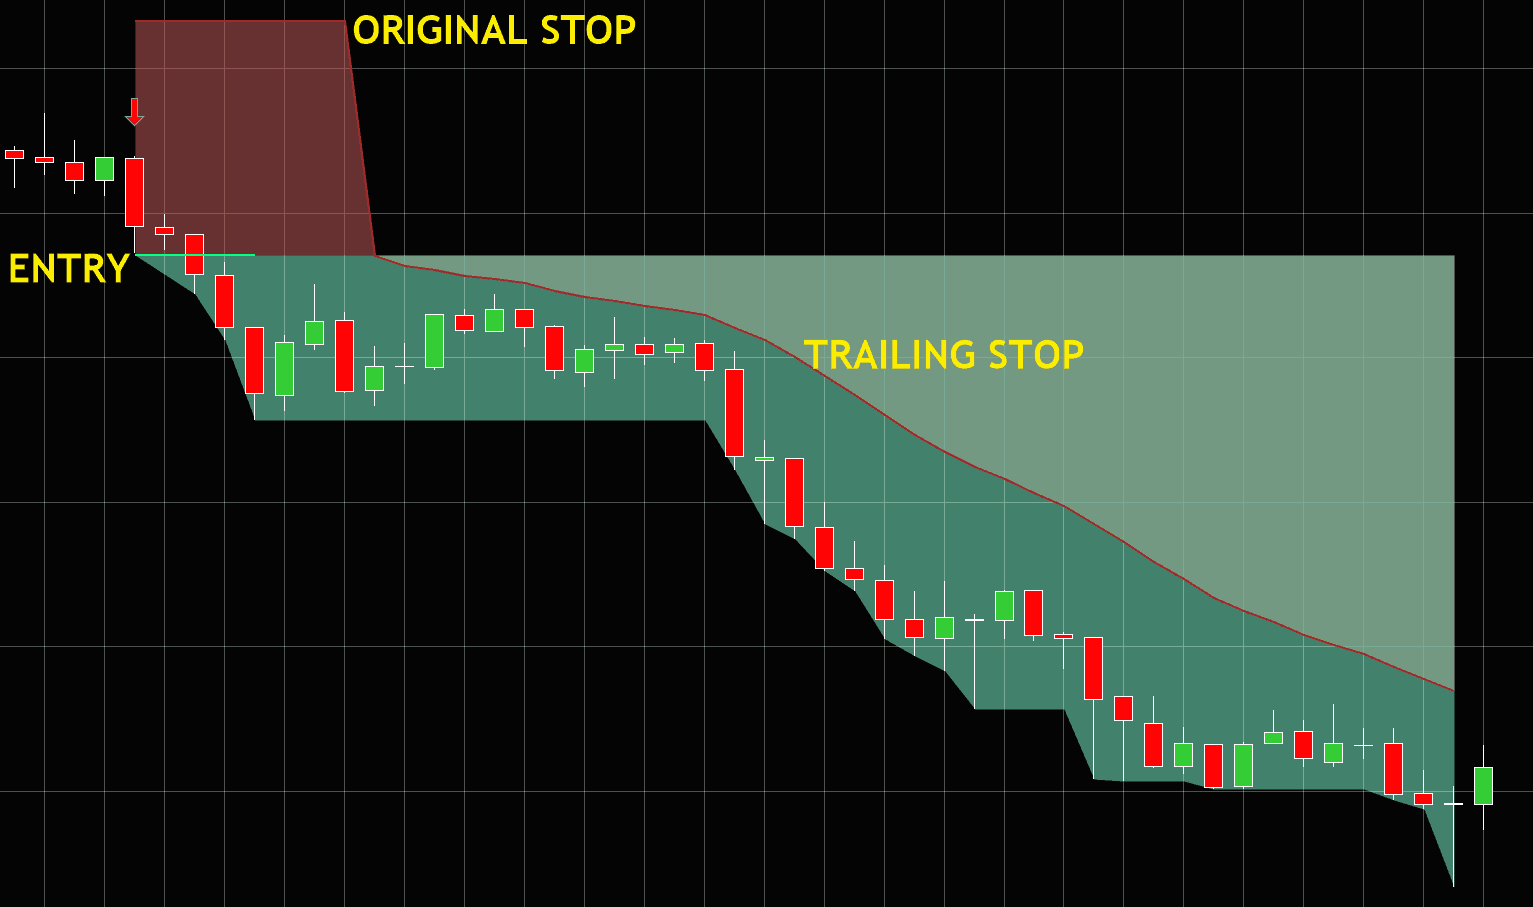
To get the most out of these MACD Stochastic Cross trades using our Roller Coaster Indicator, we use our lagging POC as the trailing stop position. So, when the Lagging POC crosses through the original entry then we start printing these Trailing stop positions and initially make the trade “Risk Free”! This trade management strategy allows for the false breakouts in either zone to occur without taking us out of the trade. Therefore, a greater opportunity to get early into trends once the price action stops going from overbought to oversold on the stochastic.
Keeping it Simple
With the addition of our POC’s to an already busy chart with Stochastic and MACD, we decided to do all the calculations behind the scenes to keep our users charts clean. So, we just print the entry position with an arrow indicating direction of trade, the initial Stop Loss and then the Trailing Stop positions. Thus, keeping, what is quite a complicated strategy, simple to use! Learn More about our Rollercoaster >>>HERE<<<


")
