EURUSD Technical Analysis 2016, 04.09 - 11.09: ranging near bearish reversal
4 September 2016, 15:07

13
261
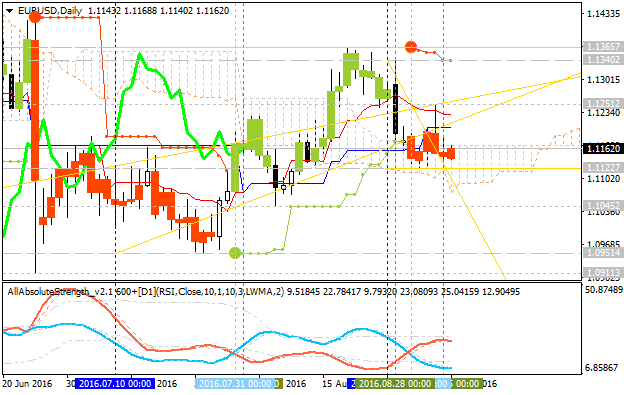
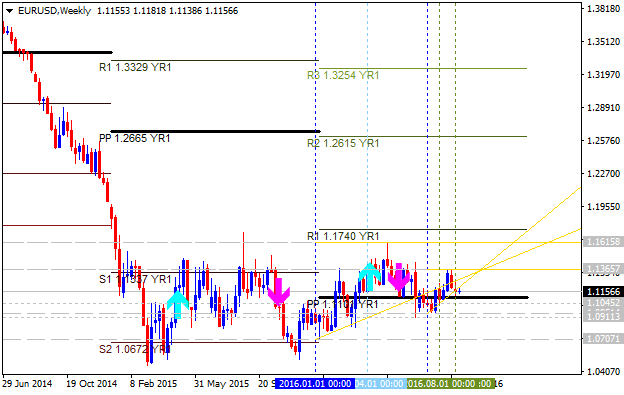
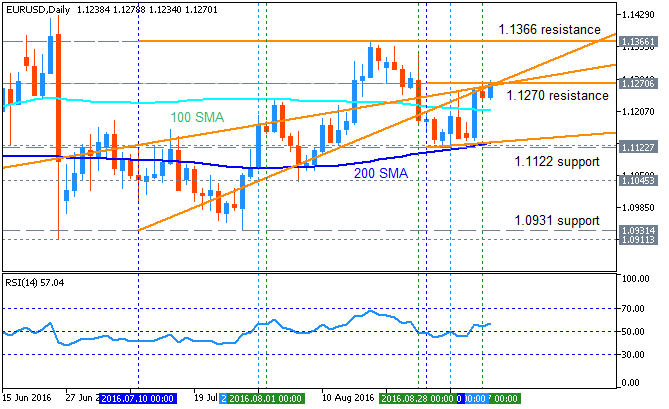
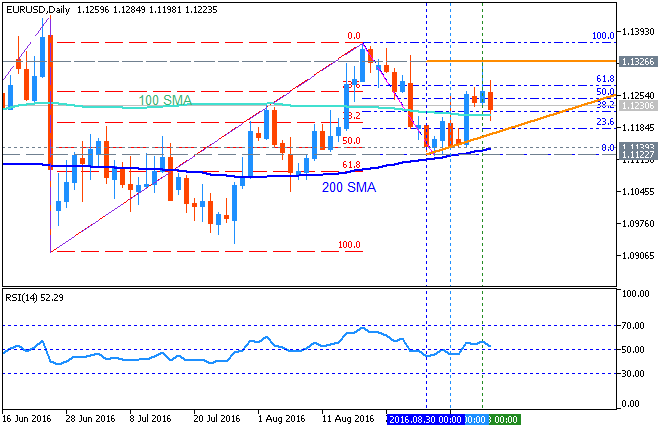
Daily price is located in the bullish area of the chart to be
near and above Senkou Span line of Ichimoku indicator on the border
between the primary bearish and the primary bullish trend.
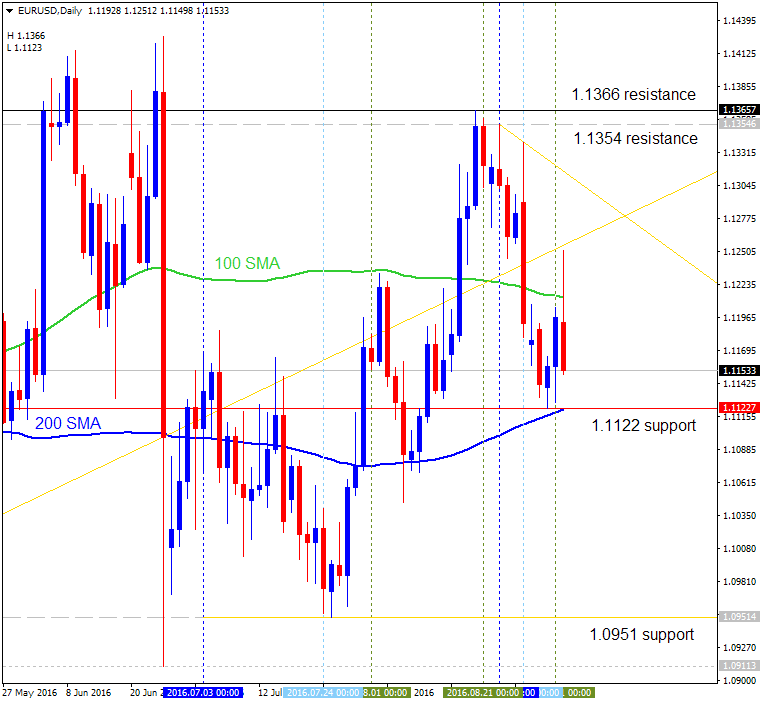
- The price is testing 1.1122 support level to below for the bearish reversal to be started.
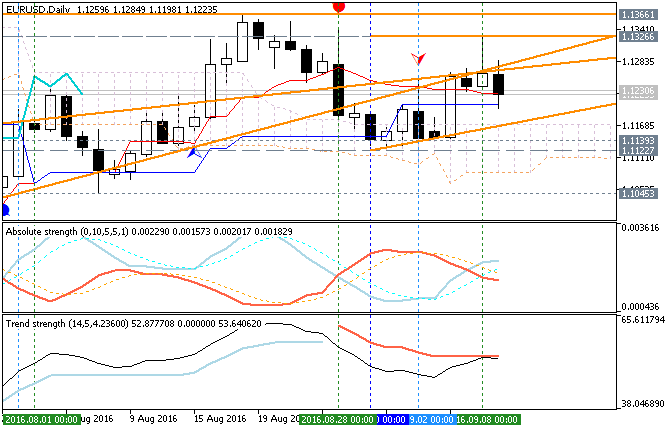
- Chinkou Span line of Ichimoku indicator is located near and above the price indicating the possible breakdown to be started in the near future.
- Absolute Strength indicator is estimating the bearish reversal.
- Symmetric
triangle pattern was formed by the price, and if the price breaks this
pattern to above together with 1.1365 resistance level so the primary
bullish trend will be resumed.
If D1 price breaks 1.1365 resistance level on close bar from below to above so the bullish trend will be resumed.
If not so the price will be on bullish ranging within 1.1365/1.1122 levels.

- Recommendation for long: watch close D1 price to break 1.1365 for possible buy trade
- Recommendation
to go short: watch D1 price to break 1.1122 support level for possible sell trade
- Trading Summary: ranging near bearish reversal
| Resistance | Support |
|---|---|
| 1.1365 | 1.1122 |
| N/A | 1.0951 |
SUMMARY : ranging near bearish reversal
TREND : ranging