September FOMC meeting concludes with a lot of media debating if the
Fed will hike rates or not. It is an interesting debate because
economic data such as jobs are improving. However, other parts of the
world are slowing in growth (think China) and US inflation is
non-existent. So, let's look at the technical picture of the EUR/USD with preferred bearish scenario and an alternate
bullish scenario.
1. Bearish Scenario
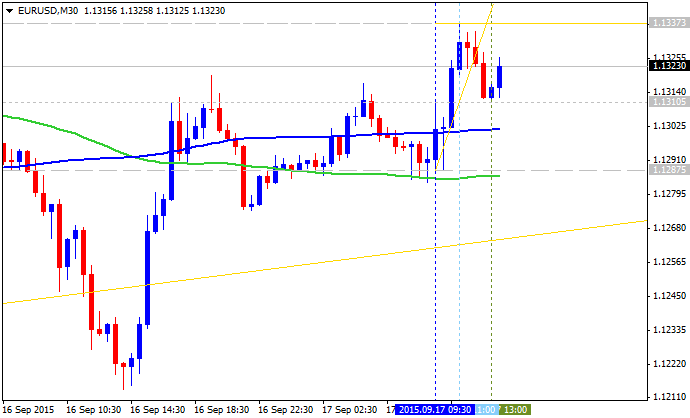
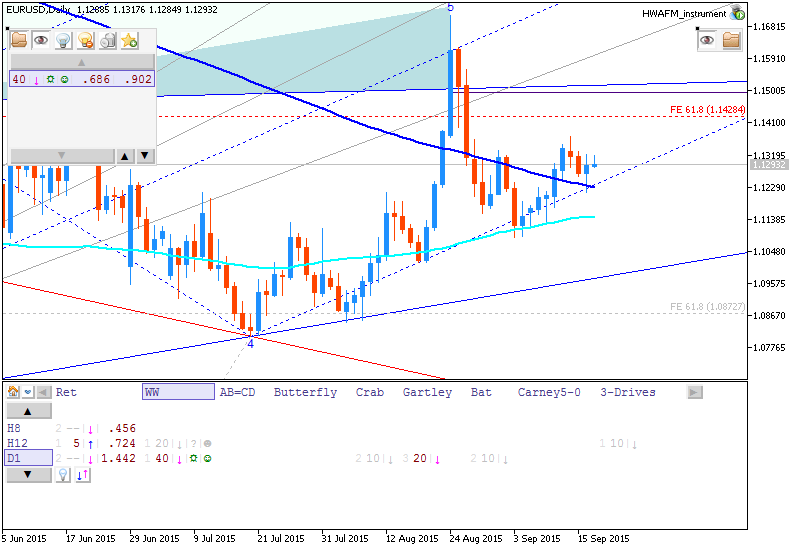
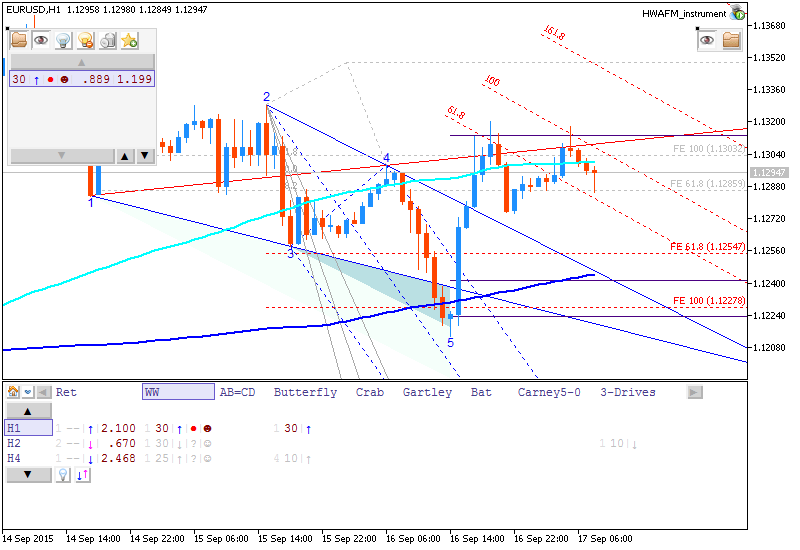
- "The August 24 high was a meaningful high. The move to the downside since then has taken place in 5 waves which terminated on September 3. At that point, we look for a 3 wave counter trend upward bounce labeled a-b-c. It appears this corrective bounce is evolving into a more complex correction (labeled w-x-y). In that case, we could see another spike up to 1.14-1.15. A less likely scenario is that the move finished on September 14 at 1.1375 and wave (iii) down has already started."
- "Third wave moves tend to be the longest and strongest. This viewpoint also places the EUR/USD in a similar situation to the Sterling, which we wrote about last week."
- "A break below 1.0975-1.1000 builds the case that a third wave is unfolding."
1. Bullish Scenario
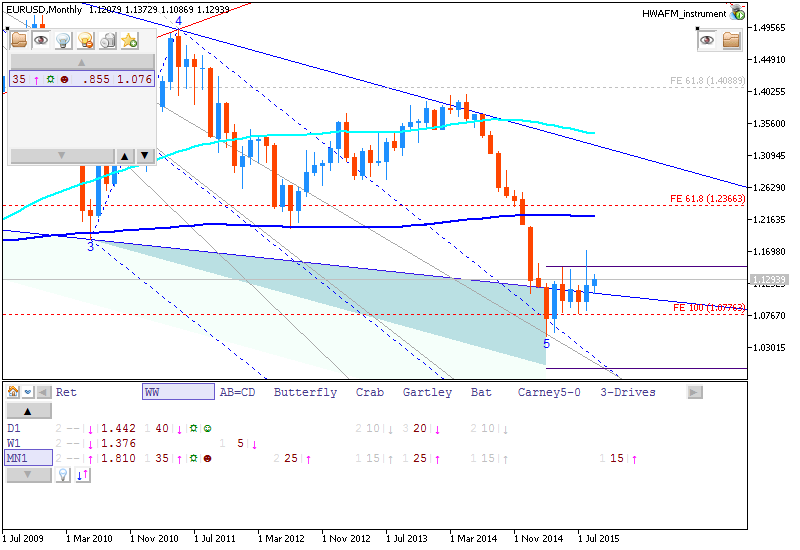
- "Since the March 2015 low, prices have been overlapping higher in complex fashion as a correction. Though the preferred wave count is that a resumption of the trend continues lower to retest the March lows, there is an alternative count that needs to be considered."
- "This wave picture is a bit trickier because so long as prices are above 1.08, this picture still is possible and ultimately suggests a retest of the 1.1700 high. In other words, wave (x) could sell off towards 1.08 and keep the door open for an eventual visit to 1.17. In these scenarios, it is important to look at the internal structure of the waves and seek out equal wave patterns or overlapping waves that suggest the corrective nature would continue higher. To date, this exists and we need to keep it in mind."
"The wave pictures are suggesting we could soon embark upon a wave 3 sell off. Therefore, a break below 1.1085 or a rise up to 1.15 would spark short trades. And we have a bullish alternative, a meaningful rise above 1.15 or a sell off towards 1.11 that is not impulsive would shift the scales towards entering long the market."