
Basically the price action is a sequence of price movement over time, and the analysis of price action is done by observing the formation of the candlestick bar. Here are some terms in trading with price action:
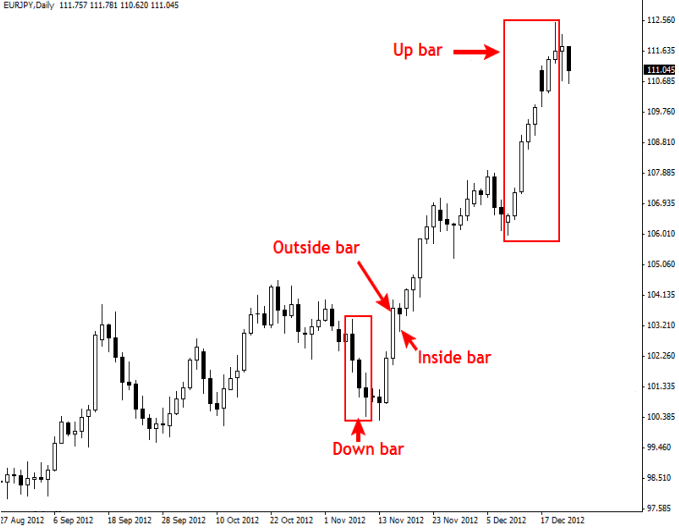
Up bar: also known as the ' bar ', which is a bullish bar with high level which is higher than the previous high (higher high) and the low level which is higher than the previous low (higher low). The sequence of the up bar in the image above shows the movement of the uptrend. Generally the closing price from the bar up higher than its opening price, but it could also lower as it appears on a black candlestick bar at a series of line-up bar picture above. However the bar is included in the up bar becausethe lowest and highest levels are still higher than the level of the highest and the lowest bar before. The sequence up the bar shows that at that time buyer or ' the bulls' were in control of the market.
Down bars: also known as ' bearish ' bar, that bar with high level that is lower than the previous high (lower high) and the low level which is also lower than the previous low(lower low). The sequence down the bar in the image above shows a downtrendmovement, and showed that it was the bears or the ' seller ' is being in control of the market.
Inside bar: bar with high level is lower than the previous low level high and higher than the previous low. Many traders consider the bar with high or low levels similar tothe previous bar as the inside bar. The formation of the bar as it shows the uncertaintyof the market or the State of consolidation where buyer and seller mutually wait, if itpenetrates the highest level bar earlier then the winning buyer and vice versa if the previous bar low level through the seller who win and take control of the market.
Outside bar: also known as the ' mother ' bar, that bar the ' swallows ' inside the bar, or on the formation of engulfing bar is the bar the ' swallows ' bar before. In principle the outside bar is a bar with high level which is higher than the previous bar's highlevel or a bar afterward, and the low level that is lower than the previous low level baror a bar afterward. In terms of candlestick formation, a combination of outside andinside the bar is often nicknamed ' harami '. In the example above the closing leveloutside the bar is higher than the opening level indicating the buyer is in control ofthe market consolidation before they occur.
Trading signals from price action
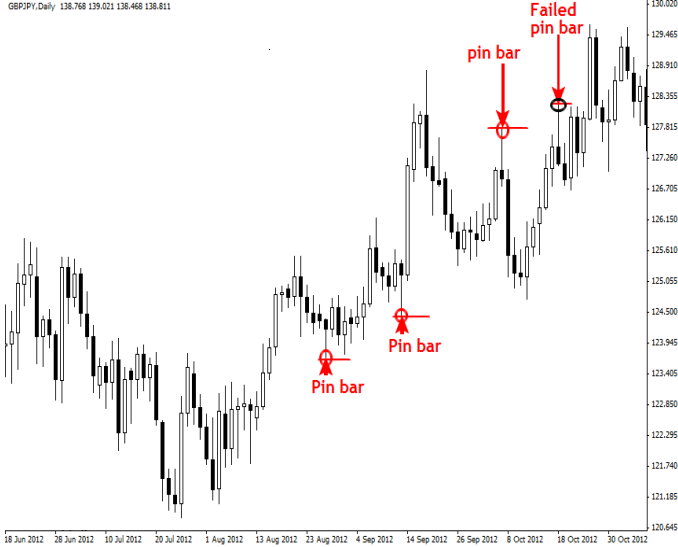
Formation of the bar on price action reflects the sentiment of the market participants,and may provide guidance or direction of price movement next. Signals or cues fromprice action is usually indicated by the formation of the bar is the bar pin with tails(axis) that is longer than its body. The long tail means that the stronger the sentimentof rejection at certain price levels. In a market that is trending pin bars usuallysuggests the impending movement of the reversal or contrary to current trends, and pin the bar often called pin bar reversal. Here are a few pin bar reversal where onefailed (failed) or a trading signal is wrong (false signals):
The factors supporting the trading signals from price action
To avoid possible errors as in the picture above, the necessary supporting factorsconfirm trading signals from the price action so that a trader can choose signals thatthe probability is highest, that is confirmed by a number of constituents. Konfirmatoror constituents are level-the level of support and resistance, trend direction as well astechnical indicators. The indicator that is often used is to confirm the direction of themoving average trend. The following sample trading signals (pin bar) with threeconstituents:
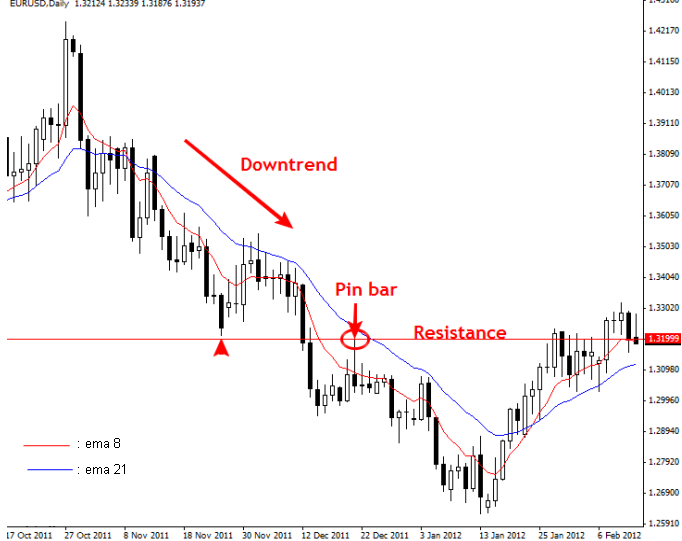
Looking pin bar formed confirmed by three factors, namely: the direction of the trend(downtrend), rejection by the horizontal line of resistance (the resistance fails topenetrate), and also the refusal by the dynamic resistance area between curveindicator exponential moving average (ema) 21 and ema 8. Thus the probability of the success of the entry sell after pin bar is high.
If not in this group are trending market conditions. Patterns of consolidation that is common is sideways (ranging), triangle (triangle), pennant, and others. There are times when the market moved in a narrow range with an erratic pattern, this State is calledon choppy that are difficult to predict and are best avoided. The following sampletrading signals from price action for trending and ranging conditions:
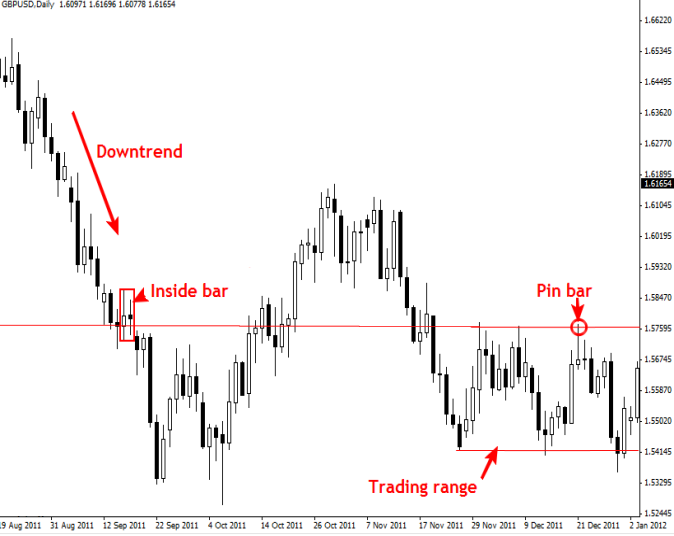
The lowest level prices seem to penetrate the outside bar, which means the seller backin control of the market. It is also supported by transpiration support level.
here some recomended tool for you


")
")