

Extreme Zone Filter — User Guide
Table of Contents
- What Is the Extreme Zone Filter?
- Why Filter Extreme Zones?
- How It Works
- Input Settings Guide
- Detailed Input Explanation
- Reading the Filter Results
- Tuning by Pattern Type
- Real-World Examples
- Combining with Other Filters
- Frequently Asked Questions
- Pro Tips for Effective Use
1. What Is the Extreme Zone Filter?
Extreme Zone Filter is a signal filtering feature that helps avoid entering trades when price is at the top or bottom of a Donchian price channel.
Simple analogy:
Imagine an elevator in a 10-story building:
- If the elevator is at floors 9–10 (near the top), you should not BUY because price has climbed too high — the chance of reversal is very high.
- If the elevator is at floors 1–2 (near the bottom), you should not SELL because price has dropped too deep — the chance of a bounce-back is very high.
This filter automatically checks where price sits within the channel and blocks signals that carry high risk due to price being at an extreme.
2. Why Filter Extreme Zones?
The Problem Without the Filter
When the Extreme Zone Filter is off, the indicator displays all signals that match the pattern (Fakey, PinBar, Inverted Hammer), including those appearing at:
- Channel tops: Price has been rising continuously — a BUY signal here risks "buying the top"
- Channel bottoms: Price has been falling continuously — a SELL signal here risks "selling the bottom"
Benefits of Enabling the Filter
| Filter OFF | Filter ON |
|---|---|
| More signals but lower quality | Fewer signals but higher quality |
| Prone to buying tops / selling bottoms | Risky signals automatically filtered out |
| Lower win rate | Significantly improved win rate |
| Must evaluate visually | Automated, objective assessment |
Who Should Enable This Filter?
- Reversal traders — especially important
- Traders who prefer safe entries, prioritizing quality over quantity
- Beginners — helps avoid the most common mistake: buying tops and selling bottoms
3. How It Works
Step 1: Determine the Donchian Price Channel
The system looks back N candles (e.g., 20 or 50 candles) and finds:
- Highest High of those N candles
- Lowest Low of those N candles
These two values form a Donchian channel — representing the recent price range.
Step 2: Calculate Price Position (%) Within the Channel
Position (%) = (Current Price - Lowest Low) / (Highest High - Lowest Low) × 100
- 0% = price is at the channel bottom (lowest)
- 50% = price is at the channel midpoint
- 100% = price is at the channel top (highest)
Step 3: Apply Filtering Rules
| Signal Type | Rule | Default Example |
|---|---|---|
| BUY | Block if position is above the allowed threshold | Block if > 70% |
| SELL | Block if position is below the allowed threshold | Block if < 30% |
Visual Illustration
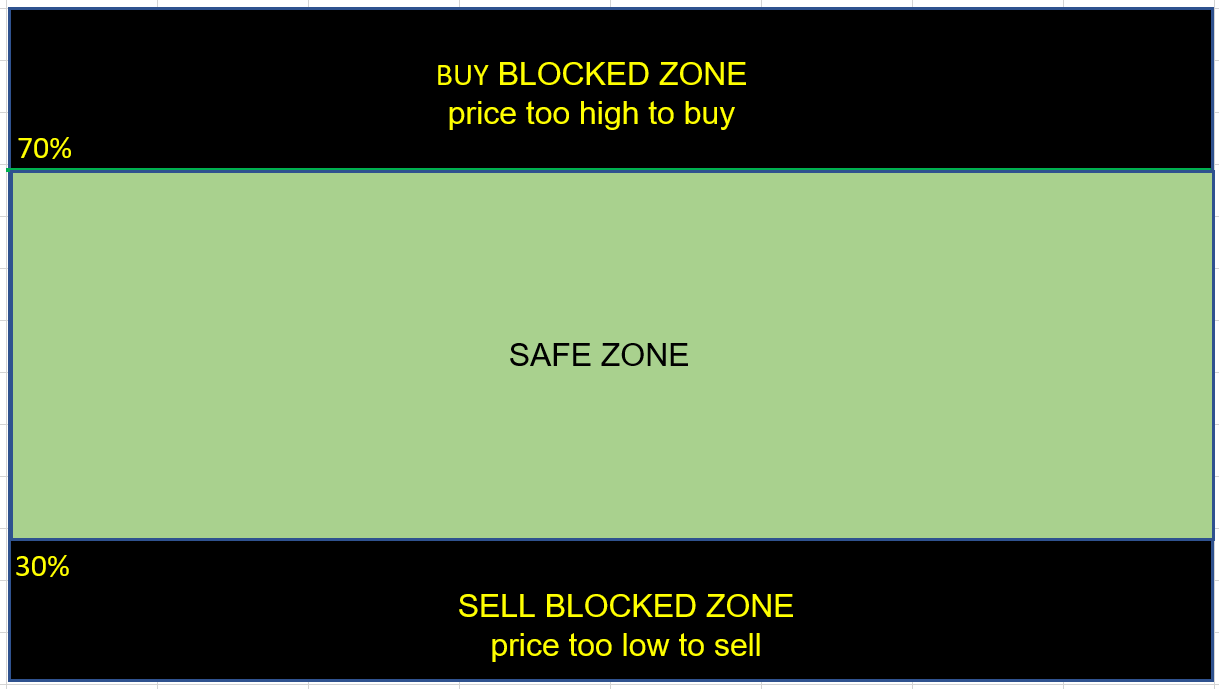
Meaning: Only signals within the safe zone (between the two thresholds) are displayed. Signals in extreme zones are automatically blocked.
4. Input Settings Guide
How to Open Settings
- Right-click the indicator on the chart → select Properties (or press Ctrl+I )
- Switch to the Inputs tab
- Find the group "=== EXTREME ZONE FILTER ==="
Input Summary Table
| MT5 Display Name | Type | Default | Meaning | Recommendation |
|---|---|---|---|---|
| Extreme Zone Filter (avoid tops/bottoms) | true/false | false (*) | Enable/disable the extreme zone filter | Set to true for live trading |
| Donchian Period for channel | Integer | 20–50 (*) | Number of candles to look back for the channel | 20 = fast response, 50 = more stable |
| Block BUY above channel (%) | Double | 65–80 (*) | Block BUY when price exceeds this % | 70 = balanced, lower = stricter |
| Block SELL below channel (%) | Double | 30–35 (*) | Block SELL when price is below this % | 30 = balanced, higher = stricter |
| Timeframe (CURRENT=chart TF) | Timeframe | PERIOD_CURRENT | Timeframe used to calculate the channel | Keep default or choose a higher TF |
(*) Default values vary by indicator — see Section 7 for details.
5. Detailed Input Explanation
5.1. Extreme Zone Filter (avoid tops/bottoms)
Function: Enable or disable the entire extreme zone filter.
- true = ON — The system checks price position within the Donchian channel before accepting a signal
- false = OFF — All signals are displayed regardless of price position
Recommendation: Enable ( true ) for live trading. Disable ( false ) only for backtesting or when you want to see all pattern signals.
5.2. Donchian Period for channel
Function: Number of candles to look back for determining the highest/lowest price channel.
| Value | Characteristic | Best For |
|---|---|---|
| 10–20 | Short channel, fast reaction | Scalping, small TFs (M1–M15) |
| 20–50 | Medium channel, balanced | Intraday trading, medium TFs (M30–H4) |
| 50–100 | Long channel, stable | Swing trading, large TFs (H4–W1) |
Important note: This is the number of candles, not days. Donchian Period = 50 on an H1 chart means 50 H1 candles (about 2 trading days), while on a D1 chart it means 50 days.
Recommendations:
- Small TFs (M5, M15): use 20–30
- Medium TFs (H1, H4): use 30–50
- Large TFs (D1, W1): use 50–100
5.3. Block BUY above channel (%)
Function: Percentage threshold — blocks BUY signals when price is above this level within the Donchian channel.
Example: Set to 70% → If price is at 75% of the channel → BUY is BLOCKED ⛔ → If price is at 65% of the channel → BUY is ACCEPTED ✅
| Value | Filter Level | Result |
|---|---|---|
| 80–90% | Very loose | Only blocks BUY near channel top — more signals |
| 65–75% | Balanced | Blocks BUY in the upper 1/3 of channel — good win rate |
| 50–60% | Very strict | Only allows BUY in lower half — fewer but safer signals |
Recommendation: 65–75% for most markets.
5.4. Block SELL below channel (%)
Function: Percentage threshold — blocks SELL signals when price is below this level within the Donchian channel.
Example: Set to 30% → If price is at 25% of the channel → SELL is BLOCKED ⛔ → If price is at 40% of the channel → SELL is ACCEPTED ✅
| Value | Filter Level | Result |
|---|---|---|
| 10–20% | Very loose | Only blocks SELL near channel bottom — more signals |
| 25–35% | Balanced | Blocks SELL in lower 1/3 of channel — good win rate |
| 40–50% | Very strict | Only allows SELL in upper half — fewer but safer signals |
Recommendation: 25–35% for most markets.
5.5. Timeframe (CURRENT=chart TF)
Function: Choose the timeframe used to calculate the Donchian channel.
| Value | Behavior |
|---|---|
| PERIOD_CURRENT (default) | Uses the chart's current TF. E.g., if your chart is H1, the filter uses H1 data |
| M5, M15, H1, H4, D1... | Fixed TF — the Donchian channel always uses the selected TF, regardless of the chart TF |
When to choose a fixed TF?
- When you want the extreme zone filter to be consistent when switching between chart TFs
- Example: Set TF = H4 → Whether the chart shows M15 or H1, the filter always uses the H4 channel (more stable)
Recommendation: Keep PERIOD_CURRENT if you typically trade on a single TF. Choose a larger TF (e.g., H4 or D1) if you want a more stable filter when switching TFs.
6. Reading the Filter Results
Blocked Signals
When a signal is blocked by the Extreme Zone Filter, it will not be displayed on the chart (no arrow, no entry/SL/TP lines).
Note: This filter operates silently — you won't see a "signal blocked" notification. The signal simply does not appear.
How to Confirm the Filter Is Working
-
Compare ON/OFF: Turn the filter off ( false ) → count signals → Turn it back on ( true ) → count again. Fewer signals = filter is working.
-
Check signal positions: With the filter on, you'll notice BUY signals no longer appear near the channel top and SELL signals no longer appear near the channel bottom.
-
MTF Dashboard: On the Dashboard, the total signal count will be lower when the filter is enabled — this is the expected behavior (fewer but higher quality).
Blocked Signals Marked on Chart
Some blocked signals may still appear as faded or crossed-out on the chart (depending on version and indicator configuration). These are signals that were "pattern detected but filtered out" — they are for reference only, do not use them for entries.
7. Tuning by Pattern Type
Each indicator (pattern type) has different default values, tuned to match the characteristics of each pattern.
Default Values Comparison
| Input | Mirage (Fakey) | PinBar | Inverted Hammer |
|---|---|---|---|
| Enabled | false | true | false |
| Donchian Period | 20 | 50 | 50 |
| Block BUY above (%) | 70% | 65% | 80% |
| Block SELL below (%) | 30% | 35% | 35% |
| Timeframe | PERIOD_CURRENT | PERIOD_CURRENT | PERIOD_CURRENT |
Why Each Pattern Is Different
Mirage (Fakey) — Moderate
Fakey is a "false breakout" pattern — inherently a strong reversal signal. The filter is set at a moderate level (70/30) because Fakey rarely appears at extreme zones (it needs a trading range to form the trap).
- Donchian Period = 20: Shorter channel because Fakey works well on small–medium TFs
- Disabled by default because Fakey already has multiple built-in filters (Quality, Direction, Stoploss Hunt)
PinBar — Strictest
PinBar is a single-candle reversal pattern, most vulnerable to "traps" at extreme zones. Therefore:
- Enabled by default ( true ) — most important among the 3 patterns
- Block BUY = 65% (stricter): PinBar BUY signals at high levels often fail
- Donchian Period = 50: Longer channel for more accurate extreme zone assessment
Inverted Hammer — Loosest
Inverted Hammer has unique characteristics: the long upper wick shows strong selling pressure that was absorbed. This pattern can work well even when price has already moved up.
- Block BUY = 80% (loosest): Allows BUY at higher positions because the pattern has momentum
- Disabled by default because Inverted Hammer already has its own confirmation mechanism (confirmation bar)
Tuning Recommendations
| Goal | Donchian | BUY Max | SELL Min |
|---|---|---|---|
| Maximum safety (fewer signals) | 50–100 | 55–65% | 35–45% |
| Balanced (recommended) | 30–50 | 65–75% | 25–35% |
| More signals (loose) | 15–25 | 75–85% | 15–25% |
8. Real-World Examples
Example 1: PinBar BUY Blocked at Channel Top
Scenario: XAUUSD H4 chart, Donchian Period = 50
Gold price rises from 2,300 → 2,380 over 50 H4 candles Donchian Channel: Low = 2,300 | High = 2,380 Bullish PinBar appears at price 2,372 Position within channel: = (2,372 - 2,300) / (2,380 - 2,300) × 100 = 72 / 80 × 100 = 90% → Block BUY threshold = 65% → 90% > 65% → BUY signal BLOCKED ⛔
Result: The indicator does not display this PinBar BUY signal. In reality, price subsequently reversed from 2,380 down to 2,340 — a significant losing trade was avoided.
Example 2: PinBar SELL Blocked at Channel Bottom
Scenario: EURUSD D1 chart, Donchian Period = 50
EURUSD drops from 1.1050 → 1.0880 over 50 D1 candles Donchian Channel: Low = 1.0880 | High = 1.1050 Bearish PinBar appears at price 1.0910 Position within channel: = (1.0910 - 1.0880) / (1.1050 - 1.0880) × 100 = 0.0030 / 0.0170 × 100 = 17.6% → Block SELL threshold = 35% → 17.6% < 35% → SELL signal BLOCKED ⛔
Result: Price is too low — selling here means "selling the bottom." In reality, EURUSD bounced from 1.0880 up to 1.0950.
Example 3: Fakey BUY Accepted in Safe Zone
Scenario: GBPUSD H1 chart, Donchian Period = 20
GBPUSD ranges between 1.2650 – 1.2750 (20 H1 candles) Donchian Channel: Low = 1.2650 | High = 1.2750 Bullish Fakey appears at price 1.2690 Position within channel: = (1.2690 - 1.2650) / (1.2750 - 1.2650) × 100 = 0.0040 / 0.0100 × 100 = 40% → Block BUY threshold = 70% → 40% < 70% → BUY signal ACCEPTED ✅
Result: Price is in the lower-middle zone of the channel with plenty of room to rise. The Fakey BUY is displayed on the chart.
9. Combining with Other Filters
Extreme Zone Filter is one of 7 filters that work in sequence. Processing order:
Signal detected → [1] Spacing → [2] Quality → [3] Extreme Zone → [4] Direction → [5] Stoploss Hunt → [6] Signal Zone → [7] Opposite
Relationship with Each Filter
| Filter | Role | How It Interacts with EZ |
|---|---|---|
| Spacing | Prevent clustered signals | Runs before EZ — if Spacing blocks, EZ is not checked |
| Quality | Filter by pattern quality | Runs before EZ — if Quality blocks, EZ is not checked |
| Direction | Filter by trend direction | Runs after EZ — signals passing EZ must still be in the right direction |
| Stoploss Hunt | Filter SL hunting zones | Complements EZ — detects "traps" at extreme zones |
| Signal Zone | Filter by market structure | Complements EZ with a market structure perspective |
| Opposite | Filter opposing signals | Final check |
Popular Combinations
Combo 1 — Safest (recommended for beginners):
- Quality Filter: true , Min Quality: 0.5
- Extreme Zone Filter: true , 50 period, 65/35
- Direction Filter: enabled with trend
Signals must be high quality + not in extreme zone + correct direction = very safe.
Combo 2 — Reversal trader:
- Quality Filter: true , Min Quality: 0.4
- Extreme Zone Filter: true , 30 period, 70/30
- Stoploss Hunt: enabled
Allows more reversal signals, but they must pass the SH filter (avoids price traps).
Combo 3 — Maximum signals (backtesting/research):
- Disable all filters → View all detected patterns
- Then enable filters one by one to evaluate their impact
10. Frequently Asked Questions
Q1: I enabled Extreme Zone Filter but no signals appear?
Possible causes:
- Thresholds are too strict (BUY Max too low or SELL Min too high)
- The market is trending strongly — price stays at the top or bottom of the channel
- Donchian Period is too small — the channel is too narrow
Solutions:
- Increase BUY Max to 80% and decrease SELL Min to 20%
- Increase Donchian Period to widen the channel
- If still no signals → temporarily disable the filter and evaluate visually
Q2: Should BUY Max and SELL Min add up to 100%?
Not required. These two values work independently:
- BUY Max = 70% means "block BUY when price is above 70% of the channel"
- SELL Min = 30% means "block SELL when price is below 30% of the channel"
You can set BUY Max = 75% and SELL Min = 40% (total = 115%). This creates:
- Safe BUY zone: 0–75%
- Safe SELL zone: 40–100%
- Zone 40–75%: both BUY and SELL are accepted
Q3: What should the Donchian Period be?
Rule of thumb: Use approximately 20–50 candles for the TF you trade on.
- If price is highly volatile → increase period to 50–100
- If price is ranging quietly → decrease period to 15–25
Q4: Does this filter affect the MTF Dashboard?
Yes. The filter applies to both local chart signals and MTF-scanned signals. When the filter is enabled, the Dashboard will show fewer signals — this is the expected behavior.
Q5: Which TF should I use for the filter?
- PERIOD_CURRENT (default): Suitable for most cases — the filter adjusts with the chart
- Fixed TF (e.g., H4 or D1): When you want the filter based on a bigger picture, regardless of the current chart TF
Q6: Does the filter work with pairs other than XAUUSD?
Yes. The filter is based on percentage position within the price channel, independent of the instrument type or price unit. Whether XAUUSD (~2,300), EURUSD (~1.09), or USDJPY (~150), the filter works correctly.
Q7: Is the filter useful during sideways (ranging) markets?
Very useful. In sideways markets:
- The Donchian channel is narrow → extreme zones are more clearly defined
- BUY signals near the range top and SELL signals near the range bottom will be blocked
- Only signals near the range middle remain — where breakout or bounce probability is highest
11. Pro Tips for Effective Use
Tip 1: Start Strict, Loosen Gradually
When first using the filter, start with strict settings (BUY Max = 60%, SELL Min = 40%) and observe for 1–2 weeks. If too few signals appear, widen by 5% at a time until you find the right balance.
Tip 2: Match Donchian Period to Your Trading TF
| Trading TF | Recommended Donchian | Reason |
|---|---|---|
| M5–M15 | 15–25 | Small TFs, fast price action, short channel reacts quickly |
| M30–H1 | 25–40 | Medium TFs, need a moderate channel |
| H4–D1 | 40–60 | Large TFs, need a stable channel to avoid noise |
| W1 | 50–100 | Long-term TF, wide channel for the big picture |
Tip 3: Combine EZ + Direction Filter = "Golden Zone"
When both Extreme Zone Filter and Direction Filter are enabled:
- EZ removes signals at extreme zones (too high/low)
- Direction removes signals against the trend
Result: Only signals that are in the right direction + at a reasonable price level remain — this is the "golden zone" with the highest win rate.
Tip 4: Use a Higher TF for the Filter When Trading Small TFs
If you trade on M15 or H1 but want to avoid entries against the larger trend:
- Set Timeframe = H4 or D1
- Price will be evaluated within the Donchian channel of the higher TF
- Example: Even if the M15 chart shows a PinBar BUY, if price is at 85% of the D1 channel → the signal is blocked because on the big picture, price is already too high
Tip 5: Backtest Before Going Live
- Open a chart, disable all filters → record total signals and win rate
- Enable Extreme Zone Filter → compare the results
- Experiment with different Donchian periods and threshold values
- Choose the configuration with the best win rate on historical data
Quick Reference
| Question | Answer |
|---|---|
| What does the filter do? | Blocks BUY signals at high prices, SELL signals at low prices |
| Should I enable it? | Yes ( true ) for live trading |
| Donchian Period? | 20–50 depending on TF (smaller = faster, larger = more stable) |
| BUY Max / SELL Min? | 65–75% / 25–35% is a good balance |
| Timeframe? | Default PERIOD_CURRENT or a higher TF |
| Affects MTF Dashboard? | Yes — Dashboard shows fewer but higher quality signals |
| Best combination? | EZ + Quality + Direction = safest combo |
Final tip: The Extreme Zone Filter is like a bouncer at the door — not there to block everyone, but to make sure only the "worthy" signals get in. Fewer, but better.


")
