
Technical Pattern Analysis for US Dollar, S&P 500, Gold and Crude Oil - Crude Oil, Gold Price Action Stalls at Technical Barriers

US DOLLAR TECHNICAL ANALYSIS
Prices look to have reversed
downward as expected after putting in a bearish Evening Star candlestick
pattern. A daily close below the 14.6% Fibonacci retracementat 11740
exposes the 23.6% level at 11653.

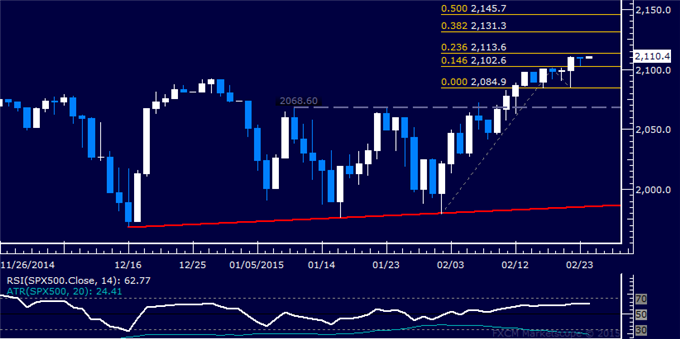
S&P 500 TECHNICAL ANALYSIS
Prices paused to consolidate
after establishing a new record high. A daily close above the 23.6%
Fibonacci expansion at 2113.60 exposes the 38.2% level at 2131.30.
Alternatively, a reversal below the 14.6% Fib at 2102.60 targets the
February 20 low at 2084.90.
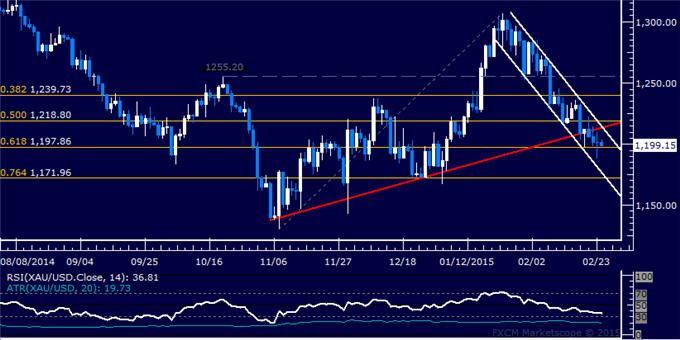
GOLD TECHNICAL ANALYSIS
Prices challenging pivotal support at
1197.86, the 61.8% Fibonacci retracement. A break below this barrier
exposes channel floor support at 1176.34, followed by the 76.4% level at
1171.96. Alternatively, a reversal above 50% Fib at 1218.80 targets the
38.2% retracement at 1239.73.
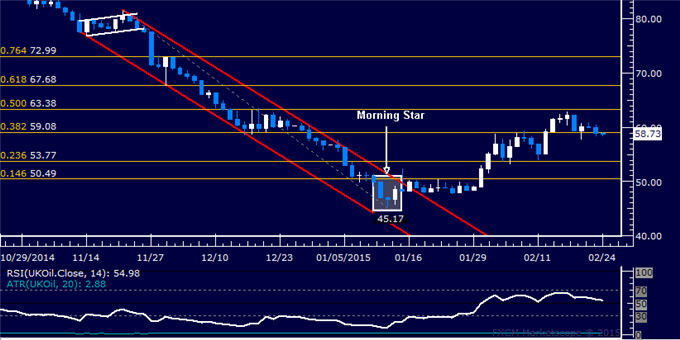
CRUDE OIL TECHNICAL ANALYSIS
Prices are digesting gains below the
$64/barrel figure after reversing upward as expected. A break above the
50% Fibonacci retracement at 63.38 on a daily closing basis exposes the
61.8% level at 67.68. Alternatively, a reversal below the 38.2% Fib at
59.08 targets the 23.6% retracement at 53.77.


")