
Auto Trading — Bollinger Band Strategy
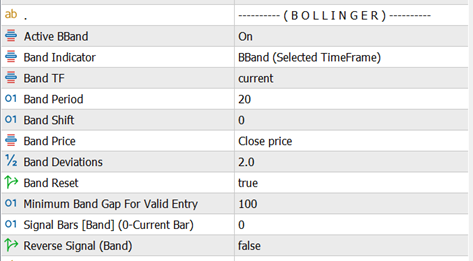
The Bollinger Band strategy is one of the built-in auto trading methods used by AZ Trade Recovery EA to open the initial trade automatically. This strategy reacts to price interaction with the Bollinger Bands and is designed for mean-reversion style entries.
Entry Logic
-
SELL Signal
When the price touches or moves beyond the Upper Bollinger Band, the EA generates a SELL signal. -
BUY Signal
When the price touches or moves below the Lower Bollinger Band, the EA generates a BUY signal.
Reset Logic (Mid Line Behavior)
The middle band (moving average) acts as a reset level to control how frequently trades are opened.
-
By default, once a trade is opened:
-
The EA waits for price to return to the middle band before allowing another trade in the same direction.
-
This prevents over-trading when price stays near the outer bands.
-
Example (Default Behavior):
-
Price touches the Upper Band → EA opens a SELL
-
Price continues near the Upper Band → no new SELL trades
-
Price comes back and touches the Middle Band → strategy is reset
-
Price touches Upper Band again → EA can open a new SELL
Open Trade After Reset Option
-
OpenTradeAfterReset = true (recommended)
Trades are opened only after price resets at the middle band. -
OpenTradeAfterReset = false
The reset rule is ignored.
Every time price touches the Upper or Lower Band, the EA can open a new trade — even without returning to the middle band.
⚠️ Disabling reset can significantly increase trade frequency and risk.
Summary
-
Upper Band → SELL
-
Lower Band → BUY
-
Middle Band → Reset control
-
Reset enabled = controlled entries
-
Reset disabled = aggressive entries
This strategy works best in ranging or mildly trending markets and can be combined with other auto strategies to create a custom hybrid trading logic.
Auto Trading — Moving Average (MA) Strategy
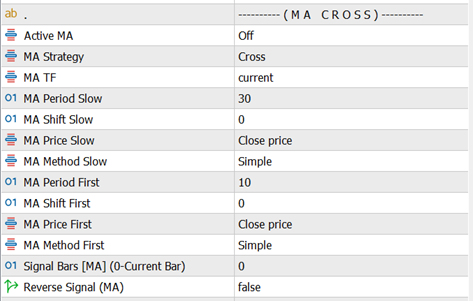
The Moving Average (MA) strategy opens trades based on the relationship between two moving averages: a Fast MA and a Slow MA. AZ Trade Recovery EA supports two MA-based entry modes, allowing you to choose between signal precision or trend-following behavior.
1. Cross Mode (MA Crossover)
This mode generates signals only at the moment of a crossover, making it more selective.
Entry Logic:
-
BUY Signal
When the Fast MA crosses upward from below the Slow MA. -
SELL Signal
When the Fast MA crosses downward from above the Slow MA.
Key Characteristics:
-
Trades open only at the crossing point
-
Fewer signals, cleaner entries
-
Best for identifying trend changes
2. Up & Down Mode (Trend Position)
This mode is more aggressive and focuses on trend direction, not the crossover event.
Entry Logic:
-
BUY Signal
When the Fast MA remains above the Slow MA. -
SELL Signal
When the Fast MA remains below the Slow MA.
Key Characteristics:
-
Trades can open as long as the trend condition is valid
-
More frequent signals
-
Suitable for strong trending markets
Summary
-
Cross Mode → Trade only on MA cross events (precision-based)
-
Up & Down Mode → Trade based on MA position (trend-following)
-
Fast MA reacts quicker to price
-
Slow MA defines overall trend direction
This strategy can be used alone or combined with other auto strategies to form a more robust trading
Auto Trading — RSI Strategy

The RSI (Relative Strength Index) strategy uses overbought and oversold levels to identify potential reversal points in the market. AZ Trade Recovery EA opens trades when the RSI reaches predefined threshold levels and uses a reset rule to avoid repeated entries in the same condition.
How the RSI Strategy Works
Entry Logic
-
SELL Signal
When the RSI line reaches or touches the Sell Level (default: 70), the market is considered overbought and a SELL signal is generated. -
BUY Signal
When the RSI line reaches or touches the Buy Level (default: 30), the market is considered oversold and a BUY signal is generated.
Both the Buy Level and Sell Level can be customized from the EA inputs to suit your trading style or market conditions.
Reset Logic (Important)
To prevent multiple trades from opening repeatedly at the same RSI extreme:
-
After a SELL trade is opened, the EA will not open another SELL until the RSI moves back below the Sell Reset level.
-
After a BUY trade is opened, the EA will not open another BUY until the RSI moves back above the Buy Reset level.
This reset mechanism ensures:
-
Cleaner signals
-
Reduced overtrading
-
Better control during ranging markets
Summary
-
RSI detects overbought and oversold conditions
-
Trades open only when RSI touches defined levels
-
Reset lines must be crossed before the next trade of the same type
-
Levels are fully adjustable from inputs
The RSI strategy works well on ranging or corrective markets and can be combined with other strategies for stronger confirmation.
Auto Trading — Heiken Ashi Strategy

The Heiken Ashi strategy uses candle color and trend consistency to identify clear market direction and reduce noise. AZ Trade Recovery EA supports two Heiken Ashi–based entry methods, both controlled by candle color rules and a confirmation filter.
Basic Rule
-
Green candles → BUY bias
-
Red candles → SELL bias
All Heiken Ashi strategies rely on the Minimum Bar for Valid Signal setting.
This defines how many consecutive candles (starting from the current candle) must confirm the signal before a trade is allowed.
Example:
If Minimum Bar for Valid Signal = 2, then the current candle + previous candle must both be the same color.
Heiken Signal Types
1) Cross Strategy
This method looks for a color change followed by confirmation.
BUY Signal
-
The required number of current candles are Green
-
The candle before them was Red (opposite color)
SELL Signal
-
The required number of current candles are Red
-
The candle before them was Green (opposite color)
This approach helps capture early trend reversals.
2) Up and Down Strategy
This method follows trend continuation without requiring a color change.
BUY Signal
-
The required number of current candles are Green
SELL Signal
-
The required number of current candles are Red
This approach is smoother and works best in trending markets.
Heiken Ashi Inputs Explained
-
Heiken TimeFrame
Selects the timeframe used to calculate the Heiken Ashi candles. This can be the current chart timeframe or a higher/lower one. -
Heiken Indicator Type
Choose between:-
Basic Heiken Ashi
-
Heiken Ashi Smoothed
Entry logic is the same for both; smoothed version reduces noise.
-
-
Heiken Smoothed Method / Period
Parameters used only when Heiken Ashi Smoothed is selected. These control how much smoothing is applied. -
Minimum Bar for Valid Signal
Number of consecutive candles (starting from the current candle) that must be the same color to confirm a signal. -
Reverse Signal (Heiken)
When enabled, BUY and SELL signals are swapped.
Useful for counter-trend or experimental strategies.
Summary
-
Green candles signal BUY, red candles signal SELL
-
Two modes: Cross (reversal) and Up & Down (trend-following)
-
Minimum candle confirmation prevents false entries
-
Works with both standard and smoothed Heiken Ashi indicators
-
Signals can be reversed if needed
This strategy is especially effective in clean trending markets and pairs well with recovery-based trade management.
Breakout Strategy
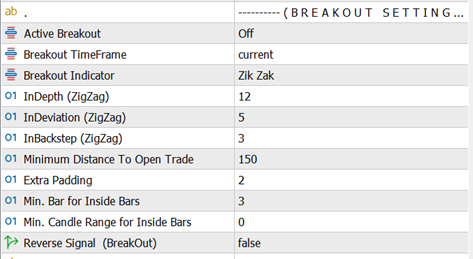
The Breakout strategy is designed to enter trades when price breaks a key structure or level. AZ Trade Recovery EA supports multiple breakout methods, allowing you to trade volatility expansions using different market behaviors. You can select one breakout method at a time from the inputs.
Breakout Strategy Types
1) ZigZag Breakout
This method uses ZigZag swing points as dynamic breakout levels.
-
BUY Trade
A buy signal is generated when price reaches or breaks the upper ZigZag swing level. -
SELL Trade
A sell signal is generated when price reaches or breaks the lower ZigZag swing level.
Important behavior
If the current market price is already above or below the most recent ZigZag level, the EA will automatically search for the nearest valid upper or lower ZigZag level and wait for a breakout from that level instead of entering immediately.
ZigZag Parameters
-
ZigZag Depth: Controls how many candles are used to form swing points.
-
ZigZag Deviation: Defines how far price must move to form a new swing.
-
ZigZag Backstep: Filters out minor swings to reduce noise.
These parameters directly affect how sensitive or smooth the breakout levels are.
2) Fractal Breakout
This method uses Fractal highs and lows as breakout reference points.
-
BUY Trade
When price breaks above the upper Fractal level. -
SELL Trade
When price breaks below the lower Fractal level.
Important behavior
If price is already beyond the current fractal level, the EA will automatically locate the nearest valid fractal level and wait for a proper breakout before opening a trade.
This strategy is useful for clean structure-based breakouts.
3) Daily Breakout
This method trades breakouts of the previous day’s range.
-
BUY Trade
When price breaks above the previous daily candle high. -
SELL Trade
When price breaks below the previous daily candle low.
Daily Breakout is simple, effective, and commonly used in intraday trading strategies.
4) Inside Bar Breakout
An Inside Bar forms when a candle is completely contained within the high and low of the previous candle. This indicates price compression and potential expansion.
Signal Formation
-
The candle that contains other candles is treated as the signal candle
-
A breakout occurs when price breaks above or below that candle
BUY Trade
-
When price breaks above the signal candle’s high
SELL Trade
-
When price breaks below the signal candle’s low
Inside Bar Filters
-
Minimum Bar In (Inside Bars)
Defines how many candles must be inside one candle to qualify as a valid signal. -
Minimum Candle Range (Inside Bars)
Sets the minimum High–Low range of the signal candle.
Value 0 disables this filter.
This strategy is effective during consolidation phases before strong moves.
Additional Breakout Controls
-
Minimum Distance To Open Trade
Sets the minimum distance (in points) price must move beyond a breakout level before a trade is allowed.
Helps avoid false breakouts. -
Extra Padding
Adds or subtracts points from the original breakout level.-
Positive value → Entry placed further away from the breakout level
-
Negative value → Entry placed closer to the breakout level
-
0 → Trade opens exactly at the breakout level
Example:
If breakout level = 1.2000 and Extra Padding = 10 points
→ Buy trade opens at 1.2010 -
-
Reverse Signal (Breakout)
When enabled, all breakout signals are inverted:-
BUY signals become SELL
-
SELL signals become BUY
Useful for counter-breakout or experimental setups.
-
Summary
-
Multiple breakout styles supported: ZigZag, Fractal, Daily, Inside Bar
-
EA automatically adjusts to nearest valid breakout levels
-
Distance and padding filters help reduce false entries
-
Signals can be reversed if required
-
Works seamlessly with the recovery engine for risk control
The Breakout strategy is best suited for volatile market conditions where price expansion is expected after consolidation or structure breaks.
Auto Trading — ADX Strategy
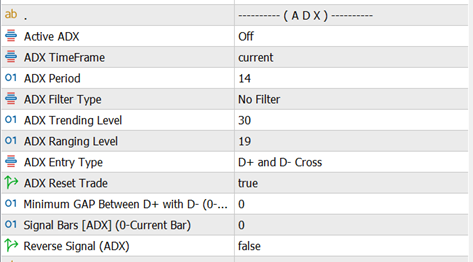
The ADX strategy uses the Average Directional Index to decide when the market is tradable and how trades should be opened.
It works in two stages:
-
ADX Filter Type – decides market condition (trend or range)
-
ADX Entry Type – decides buy or sell direction
Both settings work together to form the final trading logic.
1) ADX Filter Type (Market Condition)
This setting defines when the EA is allowed to trade.
Trade On Trending Level
-
The EA checks the ADX main line
-
When ADX is above the ADX Trending Level, the market is considered trending
-
Trades are allowed only during strong trend conditions
Use this mode when you want to trade momentum and directional moves.
Trade On Ranging Level
-
The EA checks the ADX main line
-
When ADX is below the ADX Ranging Level, the market is considered ranging
-
Trades are allowed only during sideways or low-volatility conditions
Use this mode when you want to trade consolidations or mean-reversion setups.
2) ADX Entry Type (Trade Direction)
After the market condition is confirmed by the ADX Filter Type, the EA uses the ADX Entry Type to decide whether to open a BUY or SELL trade.
D+ and D− Up & Down
-
BUY Signal
When D+ is above D− -
SELL Signal
When D+ is below D−
This method focuses on directional dominance rather than crossings.
D+ and D− Cross
-
BUY Signal
When D+ crosses above D− -
SELL Signal
When D+ crosses below D−
This method is more reactive and works well at potential trend changes.
No Entry Signal
-
The EA does not use D+ or D− for direction
-
Trades are opened only based on the ADX Filter Type
-
Direction is handled by other active strategies or settings
Use this option when ADX is intended purely as a market condition filter.
How the ADX Strategy Works Together
-
EA first checks ADX Filter Type
→ Is the market trending or ranging as defined by your settings? -
If the condition is valid, EA applies ADX Entry Type
→ Determines BUY or SELL logic (unless “No Entry Signal” is selected) -
If all conditions match, the initial trade is opened
Summary
-
ADX Filter Type controls when the EA can trade
-
ADX Entry Type controls how trades are entered
-
Can be used alone or combined with other auto strategies
-
Works best as a market condition filter to avoid poor trade environments
The ADX strategy is especially effective when combined with other entry systems to avoid trading in unfavorable market conditions.
Auto Trading — Ichimoku Strategy
The Ichimoku strategy uses the full Ichimoku Kinko Hyo system to identify trend direction, momentum, support/resistance, and market bias.
AZ Trade Recovery EA provides multiple independent Ichimoku-based strategies, each with its own entry and (optional) exit logic. These strategies do not interfere with one another.
You can select:
-
Ichimoku Strategy (For Entry) – how trades are opened
-
Ichimoku Strategy (For Exit) – how trades are closed (Pro version)
Available Ichimoku Entry Strategies
1) Tenkan–Kijun Cross
Entry Logic
-
BUY: Tenkan-sen crosses above Kijun-sen
-
SELL: Tenkan-sen crosses below Kijun-sen
This strategy focuses on short-term momentum changes.
2) Tenkan–Kijun Cross (Advanced)
Entry Logic
-
BUY when all conditions are true:
-
Tenkan-sen crosses above Kijun-sen
-
Tenkan-sen is above the Kumo cloud
-
Kumo cloud is bullish
-
-
SELL when all conditions are true:
-
Tenkan-sen crosses below Kijun-sen
-
Tenkan-sen is below the Kumo cloud
-
Kumo cloud is bearish
-
This version adds trend confirmation using the cloud.
3) Kumo Cloud Breakout
Entry Logic
-
BUY: Candle opens below the Kumo cloud and closes above it
-
SELL: Candle opens above the Kumo cloud and closes below it
Used to catch strong breakout moves.
4) Kumo Cloud Breakout (Advanced)
Entry Logic
-
BUY when all conditions are true:
-
Price breaks upward through the Kumo cloud
-
Tenkan-sen is above Kijun-sen
-
Future Kumo is bullish
-
-
SELL when all conditions are true:
-
Price breaks downward through the Kumo cloud
-
Tenkan-sen is below Kijun-sen
-
Future Kumo is bearish
-
Adds momentum and future trend confirmation.
5) Kijun–Price Cross
Entry Logic
-
BUY: Price crosses above Kijun-sen and Kijun-sen is above the cloud
-
SELL: Price crosses below Kijun-sen and Kijun-sen is below the cloud
Works well in established trends.
6) Chikou Span Breakout
Entry Logic
-
BUY when:
-
Price crosses upward relative to the Chikou Span
-
Chikou Span is above both Senkou Span A and Senkou Span B
-
-
SELL when:
-
Price crosses downward relative to the Chikou Span
-
Chikou Span is below both Senkou Span A and Senkou Span B
-
Uses historical price confirmation.
7) Kumo Future Twist
Entry Logic
-
BUY: Future Kumo turns bullish (Span A crosses above Span B)
-
SELL: Future Kumo turns bearish (Span A crosses below Span B)
This strategy anticipates future trend shifts.
Supporting Inputs
-
Ichimoku TimeFrame – Timeframe used to calculate the indicator
-
Tenkan-sen – Tenkan period value
-
Kijun-sen – Kijun period value
-
Senkou Span B – Senkou Span B period
-
Signal Bars (Ichimoku) – Which candle is used as the signal
-
0 = current candle
-
1 = previous candle
-
-
Reverse Signal (Ichimoku)
-
If enabled, BUY and SELL signals are swapped
-
Summary
-
Multiple Ichimoku strategies are available for entry and exit
-
Advanced modes add cloud and future trend confirmation
-
Entry and exit strategies can be mixed independently
-
Suitable for trend trading, breakouts, and momentum setups
The Ichimoku module is designed to be flexible, allowing traders to adapt the system to different market conditions while keeping the recovery engine fully active.


![[iVISTscalp5]: TSI — Timing Strength Index](https://c.mql5.com/6/1015/splash-preview-772243.png "[iVISTscalp5]: TSI — Timing Strength Index")

![[XAUUSD]: Weekly Liquidity Activation Points (LAP), July 6 - July 10, 2026](https://c.mql5.com/6/1015/splash-preview-772241.png "[XAUUSD]: Weekly Liquidity Activation Points (LAP), July 6 - July 10, 2026")