
Combining trend and flat strategies

Contents
- Introduction
- 1. Strategies combining principles
- 2. Developing the Expert Advisor
- 2.1. Method 1
- 2.2. Method 2
- 2.3. Method 3
- 3. Testing Expert Advisors
- 3.1. Testing method 1
- 3.2. Testing method 2
- 3.1. Testing method 3
- 4. Optimizing strategies
- 4.1. Optimizing method 1
- 4.2. Optimizing method 2
- Conclusion
Introduction
There are numerous trading strategies out there. Some of them look for a trend, while others define ranges of price fluctuations to trade within them. The market is volatile. Trends are always followed by flats. This provides profit opportunities both for trend followers and those who trade within ranges. When one of these two groups makes profit, another either loses or waits for the right moment.
Is it possible to combine these two approaches to increase profitability? Can two strategies complement each other? Let's try to combine seemingly different trading models and see the result of such a combination.
1. Strategies combining principles
Price charts witness constant change of trends. Strong movements are followed by flat ones when the price starts moving within a narrow range. Traders choose their strategies based on the current market conditions. But how can we determine, which strategy to choose at the moment? A trend or a flat one?

The articles [1] and [2] consider various trend and flat trading strategies. It is easy to notice that applying a certain strategy begins with assessing the market situation. Both strategy types use different trend indicators to determine the market state. However, while trend strategies enter the market in the presence of a trend, the flat ones expect it to quiet down to open a position. Thus, our first approach when combining two types of strategy into a single Expert Advisor is the following: if there is a trend, use the trend-following algorithm, if there is no trend, use the flat one.
After more detailed examination of price charts, we can see that neither trend, nor flat movements occur unidirectionally. All movements are accompanied by price fluctuations. In case of flat movements, they have a close range, while during a trend, some prevail over others. This feature can be used when combining trend and flat strategies. The idea is to follow a trend, although the entry point should be confirmed by the oscillators used in flat trading. This approach helps in catching an end of a correction reducing drawdowns and increasing the potential of the price movement in a favorable direction.
2. Developing the Expert Advisor
To demonstrate the principles of combining strategies, I have selected strategy 1 from the article [1] and strategy 6 from the article [2]. Both selected strategies use ADX indicator to determine a trend. EAs optimization was preliminarily performed on the period from 01.01.2017 to 8.01.2018. The following parameters were selected based on these strategies' optimization results.
Trend strategy 1.

Flat strategy 6.

Trading results of single EAs with optimized parameters are provided in the screenshots.
Trend strategy 1.


Flat strategy 6.


Both applied EAs are based on opening orders according to the indicator signals in the absence of open positions at the moment the signal appears. A position is closed according to the pre-defined take profit and stop loss values.
This approach allows excluding the position tracking module from a position greatly simplifying the EA logic. When combining the EAs, I will deliberately leave the EAs' operation logic intact to demonstrate how combining methods (rather than changing the EAs' logic) affect the result.
2.1. Method 1
The first method is sequentially checking the signals of both strategies and opening a position when any of them appears. Each strategy features its own indicator parameters, as well as stop loss and take profit levels. With this approach, the presence of an open position according to one strategy excludes opening a position according to another. Thus, there will always be no more than one position in the market, which limits the risks.
The disadvantages of this approach include possible loss of profitable trades on one of the strategies when a position opened according to another one is present in the market. However, according to this approach, the applied strategies should trade in different markets, which means that the effect of this drawback should be minimal.
To implement the method, copy the codes of both EAs into one file combining them into a single code by identical functions. To avoid name duplication, add 'Trend' to variables and functions of a trend-following strategy and 'Flat' to variables and functions of a flat-following strategy.
//--- Common parameters
input double               Inp_Lot=0.01;                          //Lot
input MarginMode           Inp_MMode=LOT;                         //MM
input int                  Inp_MagicNum=1111;                     //Magic number
input int                  Inp_Deviation = 2;                     //Deviation(points)
//---
input string               Trend_EaComment="Trend Strategy";      //Strategy Comment
input int                  Trend_StopLoss=25;                     //Stop Loss(points)
input int                  Trend_TakeProfit=90;                   //Take Profit(points)
//--- RSI_Color indicator parameters
input int                  Trend_RSIPeriod=28;                    //RSI Period
input double               Trend_Overbuying=70;                   //Overbuying zone
input double               Trend_Overselling=30;                  //Overselling zone
//--- ADX_Cloud indicator parameters
input int                  Trend_ADXPeriod=11;                    //ADX Period
input double               Trend_alpha1 = 0.25;                   //alpha1
input double               Trend_alpha2 = 0.25;                   //alpha2
//---
input string               Flat_EaComment="Flat Strategy";        //Strategy Comment
input int                  Flat_StopLoss=50;                      //Stop Loss(points)
input int                  Flat_TakeProfit=50;                    //Take Profit(points)
//--- WPR indicator parameters
input int                  Flat_WPRPeriod=7;                      //Period WPR
//--- ADX indicator parameters
input int                  Flat_ADXPeriod=11;                     //Period ADX
input int                  Flat_FlatLevel=40;                     //Flat Level ADX
At the beginning of the OnTick function, check the presence of an open position. If there is no open position, update the indicator data and check entry signals for trend and flat strategies sequentially. In case any of the signals appears, open a position according to a corresponding strategy.
void OnTick()
  {
//--- Check orders previously opened by the EA
   if(!Trade.IsOpenedBySymbol(_Symbol,Inp_MagicNum))
     {
      //--- Get data for calculation
      if(!GetIndValue())
         return;
      //--- Open orders according to a trend algorithm
      //--- Open an order in case of a buy signal
      if(TrendBuySignal())
         Trade.BuyPositionOpen(Symbol(),Inp_Lot,Trend_StopLoss,Trend_TakeProfit,Inp_MagicNum,Trend_EaComment);
      else
      //--- Open an order in case of a sell signal
      if(TrendSellSignal())
         Trade.SellPositionOpen(Symbol(),Inp_Lot,Trend_StopLoss,Trend_TakeProfit,Inp_MagicNum,Trend_EaComment);
      else
      //--- Open orders according to a flat algorithm
      //--- Open an order in case of a buy signal
      if(FlatBuySignal())
         Trade.BuyPositionOpen(Symbol(),Inp_Lot,Flat_StopLoss,Flat_TakeProfit,Inp_MagicNum,Flat_EaComment);
      else
      //--- Open an order in case of a sell signal
      if(FlatSellSignal())
         Trade.SellPositionOpen(Symbol(),Inp_Lot,Flat_StopLoss,Flat_TakeProfit,Inp_MagicNum,Flat_EaComment);
     }
  }
The full EA code can be found in the attachment (Combination1 project).
2.2. Method 2
The second method slightly complicates the process of combining, and in addition to the first method, a certain conglomeration of signals of the two strategies is created.
In the provided trend strategy example, ADX cloud indicator is used to define a trend. The indicator shows the provided difference between the DI+ and DI- lines, while the strength of the trend is not checked. At the same time, the flat strategy checks the strength of a trend using ADX threshold value before opening a position. Therefore, we can introduce an additional filter to perform a deal following the trend strategy taking the strength of a trend into account.
bool TrendBuySignal()
  {
   return(trend_adx[0]>trend_adx[1] && trend_rsi1[0]==1 && trend_rsi1[1]==1 &&  flat_adx[0]>=Flat_FlatLevel)?true:false;
  }
In the trend strategy, deals are sorted by RSI indicator, therefore we can reduce the number of loss-making deals following the flat strategy by excluding opening positions against RSI signals.
bool FlatBuySignal()
  {
   return(flat_wpr[0]<-80 && flat_adx[0]<Flat_FlatLevel && trend_rsi2[0]!=1)?true:false;
  }
The full EA code can be found in the attachment (Combination2 project).
2.3. Method 3
The third method is applicable for hedging accounts and consists of using two strategies in a single EA independently. A certain magic number is assigned to orders of each of the strategies. Positions are opened upon incoming signals regardless of whether there is an open position following another strategy.
This approach accurately simulates the use of two EAs on the same account while preserving all the pros and cons of such approaches. In particular, risks are increased as a result of the possible opening of two positions following different strategies simultaneously.
//--- Common parameters
input double               Inp_Lot=0.01;                             //Lot
input MarginMode           Inp_MMode=LOT;                            //MM
input int                  Inp_Deviation = 2;                        //Deviation(points)
//---
input string               Trend_EaComment="Trend Strategy";         //Strategy Comment
input int                  Trend_StopLoss=25;                        //Stop Loss(points)
input int                  Trend_TakeProfit=90;                      //Take Profit(points)
input int                  Trend_MagicNum=1111;                      //Magic number
//--- RSI_Color indicator parameters
input int                  Trend_RSIPeriod=28;                       //RSI Period
input double               Trend_Overbuying=70;                      //Overbuying zone
input double               Trend_Overselling=30;                     //Overselling zone
//--- ADX_Cloud indicator parameters
input int                  Trend_ADXPeriod=11;                       //ADX Period
input double               Trend_alpha1 = 0.25;                      //alpha1
input double               Trend_alpha2 = 0.25;                      //alpha2
//---
input string               Flat_EaComment="Flat Strategy";           //Strategy Comment
input int                  Flat_StopLoss=50;                         //Stop Loss(points)
input int                  Flat_TakeProfit=50;                       //Take Profit(points)
input int                  Flat_MagicNum=1112;                       //Magic number
//--- WPR indicator parameters
input int                  Flat_WPRPeriod=7;                         //Period WPR
//--- ADX indicator parameters
input int                  Flat_ADXPeriod=11;                        //Period ADX
input int                  Flat_FlatLevel=40;                        //Flat Level ADX
In the OnTick function, check open positions having a trend magic number and the ones having a flat magic number separately.
void OnTick()
  {
//--- Check trend strategy orders previously opened by the EA
   if(!Trade.IsOpenedBySymbol(_Symbol,Trend_MagicNum))
     {
      //--- Get data for calculation
      if(!GetIndValue())
         return;
      //--- Open an order in case of a buy signal
      if(TrendBuySignal())
         Trade.BuyPositionOpen(Symbol(),Inp_Lot,Trend_StopLoss,Trend_TakeProfit,Trend_MagicNum,Trend_EaComment);
      else
      //--- Open an order in case of a sell signal
      if(TrendSellSignal())
         Trade.SellPositionOpen(Symbol(),Inp_Lot,Trend_StopLoss,Trend_TakeProfit,Trend_MagicNum,Trend_EaComment);
     }
//--- Check flat strategy orders previously opened by the EA
   if(!Trade.IsOpenedBySymbol(_Symbol,Flat_MagicNum))
     {
      //--- Get data for calculation
      if(!GetIndValue())
         return;
      //--- Open an order in case of a buy signal
      if(FlatBuySignal())
         Trade.BuyPositionOpen(Symbol(),Inp_Lot,Flat_StopLoss,Flat_TakeProfit,Flat_MagicNum,Flat_EaComment);
      else
      //--- Open an order in case of a sell signal
      if(FlatSellSignal())
         Trade.SellPositionOpen(Symbol(),Inp_Lot,Flat_StopLoss,Flat_TakeProfit,Flat_MagicNum,Flat_EaComment);
     }
  }
The full EA code can be found in the attachment (Combination3 project).
3. Testing Expert Advisors
After preparing three EAs following different strategy combining methods, it is time to test the EAs and compare the results. For comparability of the results, the tests are to be conducted without changing the EAs' parameters.
3.1. Testing method 1
The first test shows profit. The total profit and recovery factor turn out to be higher than in any of the original EAs. In comparison with the flat strategy, the balance line looks more even, the number of deals increases, while the maximum drawdown in terms of balance and funds is reduced. At the same time, the profit factor slightly decreases and the total profit is still less than the total profit of the initial strategies.


3.2. Testing method 2
The use of the second method allows increasing the total profit in comparison with method 1, while the number of trades remains the same, although the total profit is still lower than the total profit of the initial EAs. In turn, the growth of profit allows increasing the recovery and profit factors (the latter becomes equal to the flat strategy), as well as the share of profitable deals. At the same time, the maximum balance drawdown is decreased.


3.3. Testing method 3
Applying the third method allows increasing the total profit up to the level of the total profit of the initial EAs. The increase in profits is made possible by the increase in the number of deals. At the same time, the deposit load and the maximum balance drawdown are increased.


4. Optimizing strategies
The EA tests performed in the previous section demonstrate the advantages of combining strategies within EAs. All three methods show an increase in profit as compared to any of the original strategies. But we should not forget that the original strategies were optimized for the tested time interval, while the same initial parameters were used for testing the complex EAs.
However, we all realize that any interference in EA's logic requires additional adjustment of its parameters. Let's try to optimize the EAs assembled using the first two methods of combining strategies and see the results.
Keep in mind that the very idea of developing EAs lies in earning money on the market, rather than in demonstrating their capabilities on historical data. Therefore, I suggest dividing the test period into two sections. Previously, we conducted tests for the period from 1.01.2017 to 8.01.2018. Now, I propose conducting optimization on the time interval from 1.01.2017 to 6.01.2018 and performing a forward test on the remaining interval.

4.1. Optimizing method 1
While choosing optimization parameters, keep in mind that each of our EAs includes blocks of two strategies. In this case, each strategy uses two indicators for an entry. But let's not forget that both strategies use ADX to determine the strength of a trend and its direction. Thus, the EAs' logic applies three indicators for defining entry points. I suggest optimizing the periods of these three indicators.
ADX indicator period optimization shows the maximum profit and robustness against changes of other parameters with the indicator period ranging from 12 to 14. The graph below shows the correlation of the EA profit with changes of ADX and RSI periods on the optimized time interval.
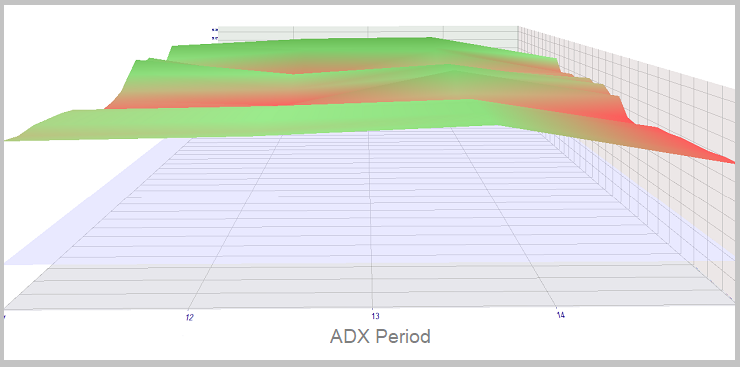
The conducted forward test confirms the possibility of making profit within the indicated range of the indicator values. The maximum stability is observed with the ADX period equal to 13. In its turn, the similarity of the optimization and forward test results prove the EA's robustness on a non-optimized time interval.

WPR period optimization shows similar results. The maximum EA robustness on the optimized interval is achieved with the indicator period equal to 7. At the same time, with the growth of the ADX indicator period, it is also possible to make profit in the range of 3 to 5. The graph below shows the correlation of the EA profit with changes of WPR and ARX periods on the optimized time interval.

The forward test confirms the specified zones. At the same time, the profit grows in the range 3-4 of the WPR indicator period. In case WPR is equal to 7, the EA profitability decreases, while ADX indicator values increase. This may be due to the shorter test time interval and its specificity.

Optimization of RSI indicator period confirms all of the above. On the optimized time interval, the range from 27 to 32 is most notable for its profitability and robustness against changes. The graph below shows the correlation of the EA profit with changes of RSI and ADX periods on the optimized time interval.

During the forward test, the profitability range of RSI periods was narrowed down to 30-32.

Attempts to optimize take profit and stop loss values did not allow increasing the EA profitability and confirmed the previously selected parameters.
According to the optimization results, the most optimal parameters are ADX period equal to 13, RSI period equal to 30 and WPR period equal to 7. With these parameters, the EA received 202.33 USD of profit on the optimized period and 46.10 USD on the forward one, while other parameters remained equal. This profitability exceeds the one obtained when combining the EAs according to the method 3 on the period tested above. The use of similar parameters in the EA combined according to the method 3 also yields worse results: 166.29 USD and 60.27 USD, respectively.


Confirmation of the forward test optimization results proves the EA robustness on a non-optimized time interval.
4.2. Optimizing method 2
It is interesting that the optimization of the EA combined according to the method 2, yielded results that are similar to the previous optimization. This may indicate the trading system robustness. The indicator periods similar to the ones in the previous section were selected as a result of the optimization. With other things being equal, the method 2 EA showed a lower profitability due to the reduction in the number of deals. Optimization graphs are provided below.


At the same time, improving the quality of trend strategy signals allows optimizing stop loss and take profit levels. As a result of the optimization, stop loss for a trend strategy is reduced from 25 to 20 points, while take profit is increased from 90 to 110 points. This allows increasing the profitability of the EA's work. Graphs of stop loss and take profit levels optimization are provided below.


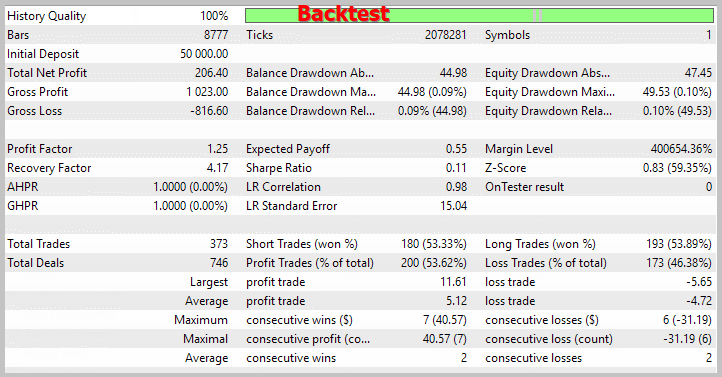
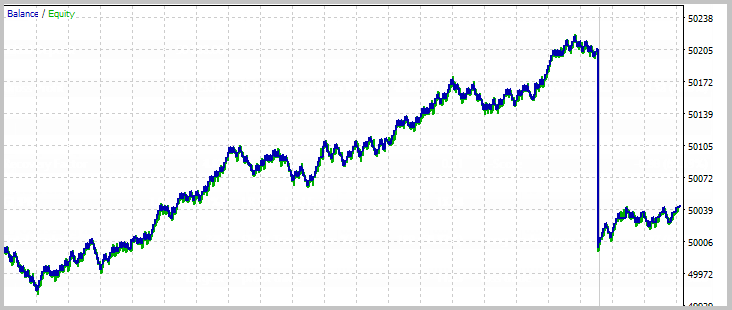
Based on the optimization results, the profitability of the EA combined according to the method 2 is the highest out of the three considered options. Applying the parameters obtained during this optimization yielded worse results on other EAs. Screenshots of testing the optimized EA are provided below.

Conclusion
In this article, I suggested three methods of combining two strategies into a single EA, showed how to arrange this in the EA and tested the EAs without changing the parameters after their optimization.
The table below summarizes the results of testing all the strategies. Optimization of combined EAs showed a higher profitability compared to the use of two separate EAs.
In your EAs, you are free to combine more than two strategies using a different combination of the proposed methods or by adding your own ones. It is impossible to say unequivocally which of the methods is the best. In each case, traders should be creative when choosing a method for combining strategies and consider the strategies themselves and their operation logic.
| Parameter | Trend strategy |
Flat strategy |
Method 1 | Method 2 | Method 3 | Method 1 opt. Back/For |
Method 2 opt. Back/For |
|---|---|---|---|---|---|---|---|
| Total profit | 51.56 | 158.96 | 160.52 | 166.12 | 210.40 | 202.33 / 46.10 | 206.40 / 43,10 |
| Profit factor | 2.39 | 1.25 | 1.24 | 1.25 | 1.31 | 1.25 / 1.58 | 1.25 /1.54 |
| Recovery factor | 3.65 | 3.55 | 3.73 | 3.86 | 4.90 | 4.08 / 1.94 | 4.17 / 1.82 |
| Maximum balance drawdown | 8.49 | 41.30 | 36.41 | 35.67 | 39.23 | 44.98 / 19.75 | 44.98 /19.75 |
| Maximum equity drawdown | 14.14 | 44.76 | 43.04 | 43.04 | 42.96 | 49.53 / 23.72 | 49.53 / 23.72 |
| Number of deals | 24 | 290 | 295 | 295 | 315 |
371 / 41 | 373 / 40 |
| Share of profitable deals | 41.67% | 55.52% | 53.22% | 53.90% | 54.29% | 53.64 / 60.98 | 53.62 / 60 |
References
- Comparative analysis of 10 trend strategies
- Comparative analysis of 10 flat trading strategies
- How long is the trend?
Programs used in the article
| # |
Name |
Type |
Description |
|---|---|---|---|
| 1 | Trade.mqh | Class library | Class of trading operations |
| 2 | Combination1.mq5 | Expert Advisor | EA combining strategies according to the method 1 |
| 3 | Combination2.mq5 | Expert Advisor | EA combining strategies according to the method 2 |
| 4 | Combination3.mq5 | Expert Advisor | EA combining strategies according to the method 3 |
Translated from Russian by MetaQuotes Ltd.
Original article: https://www.mql5.com/ru/articles/5022
Warning: All rights to these materials are reserved by MetaQuotes Ltd. Copying or reprinting of these materials in whole or in part is prohibited.
This article was written by a user of the site and reflects their personal views. MetaQuotes Ltd is not responsible for the accuracy of the information presented, nor for any consequences resulting from the use of the solutions, strategies or recommendations described.

 Deep Neural Networks (Part VIII). Increasing the classification quality of bagging ensembles
 Elder-Ray (Bulls Power and Bears Power)
 PairPlot graph based on CGraphic for analyzing correlations between data arrays (time series)
- Free trading apps
- Over 8,000 signals for copying
- Economic news for exploring financial markets
You agree to website policy and terms of use
i tried it on my mt5 but each time i place it on the chart and click ok, it goes off. i have checked everything but i guess its the ea. the combination 1,2,3 does the same thing. i wish i can test it
Hello,
i noticed no indicator file on this attached file so its ,impossible for me to play it on mt5, each time i try to drag and drop on chart, it disappears. pls can you send the file again. thank you
The same problem ...