

From Novice to Expert: Using Market Structure to Validate RSI Signals
 105
 0

In our recent work with a multi-symbol basket, we established that an isolated value becomes more useful when it is interpreted through its wider relationships. The same principle now brings us back to a single chart. Instead of allowing an oscillator threshold to decide direction alone, we will require the surrounding price structure to validate what that reading means.
A reading above 70 does not force the market to fall, just as a reading below 30 does not force it to rise. Those observations describe momentum relative to recent changes. We will combine them with confirmed swing structure so that the same Relative Strength Index (RSI) event can support continuation, reversal, or no action according to the price context.
Our objective is to build a closed-bar analytical Expert Advisor. It separates an oscillator event from the decision attached to it. By the end, you will be able to detect an RSI threshold crossing and reconstruct the current swing relationship. You will also recognize a break of structure and combine these facts through an explicit validation state. The program will show why the same overbought or oversold observation can support continuation in one market and reversal in another.
The lesson focuses on interpretation before execution. We will not place orders or introduce money-management rules because those stages would hide the question we need to answer first: does the structural context justify the oscillator signal? Instead, the EA will expose its reasoning through chart comments, uniquely named arrows, and Journal messages. This provides a visible foundation that you can test and refine. Only then should a validated state be connected to trading operations.
Contents
- The interpretation problem
- From oscillator label to structural evidence
- System architecture
- Implementing the validator
- Operating the Expert Advisor
- Testing and evidence
- Limitations
- Conclusion
- Key lessons
- Attachments
The interpretation problem
RSI is bounded between zero and 100. In common practice, values above 70 are called overbought and values below 30 are called oversold. These terms are useful descriptions, but their names can tempt us to assume the next direction. An overbought reading is not a sell order. It can be evidence that buyers still control the price. An oversold reading can likewise accompany an established bearish continuation.
The standard RSI calculation compares smoothed positive and negative changes:
RSI_t = 100 − 100 / (1 + RS_t), RS_t = G_t / L_t
Where: RSI_t is the RSI value at bar t; RS_t is relative strength at bar t; G_t is the smoothed average gain; and L_t is the smoothed average loss. The ratio measures recent directional pressure. It does not identify which swing level the price has broken.
That missing spatial information is supplied by market structure. We describe bullish structure with a higher high and a higher low. We describe bearish structure with a lower high and a lower low. Mixed relationships are classified as a range or transition rather than forced into a trend label.
From oscillator label to structural evidence
The model separates a momentum event from its directional interpretation. It first detects a closed-bar RSI threshold crossing. It then compares the two latest confirmed swing highs and two latest confirmed swing lows. This order prevents the oscillator from deciding the signal by itself.
| RSI event | Confirmed context | Classification |
|---|---|---|
| Crosses above 70 | Higher high and higher low remain intact | BUY continuation |
| Crosses above 70 | Bearish structure or downside break of structure | SELL reversal |
| Crosses below 30 | Lower high and lower low remain intact | SELL continuation |
| Crosses below 30 | Bullish structure or upside break of structure | BUY reversal |
| Either crossing | Range or incomplete evidence | Pending candidate |
A break of structure (BOS) is confirmed only when a completed candle closes beyond the latest confirmed swing level. The preceding close must not already be beyond that level. A configurable break buffer reduces equality and small-overshoot ambiguity:
BOS⁺_t = (C_t > H_s + b) ∧ (C_(t−1) ≤ H_s + b)
BOS⁻_t = (C_t < L_s − b) ∧ (C_(t−1) ≥ L_s − b)
Where: BOS⁺_t is a bullish break at completed bar t; BOS⁻_t is a bearish break; C_t and C_(t−1) are the two latest completed closing prices; H_s is the latest confirmed swing high; L_s is the latest confirmed swing low; b is the break buffer expressed in price units; and ∧ means that both conditions must be true.
If structure already agrees with continuation, the crossing can be classified immediately. When structure is mixed, the program arms a candidate. An opposite BOS can validate a reversal during the configured confirmation window. Otherwise, the candidate expires. Expiration is evidence that the original oscillator event never acquired the structural support required by our rules.
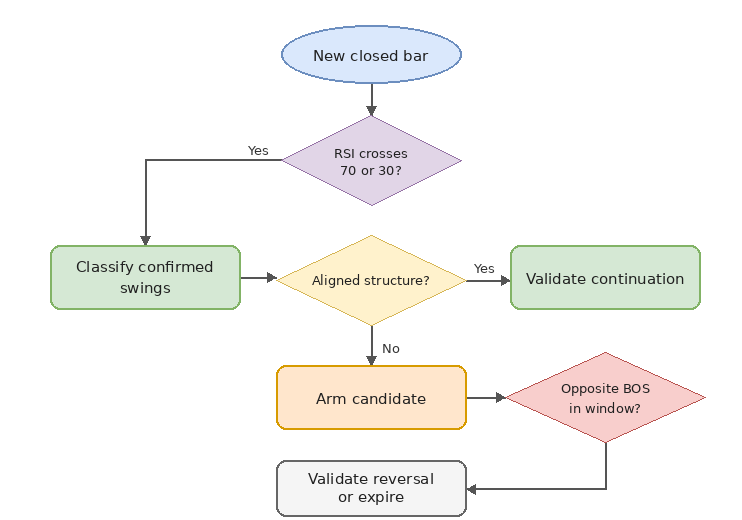
Fig. 1. RSI and market-structure validation workflow
System architecture
The Expert Advisor (EA) is deliberately analytical. It does not include order classes, position sizing, stop loss, or take profit. This boundary lets us test whether the interpretation is coherent before converting classifications into trading operations.
The closed-bar coordinator requests two sources. The RSI buffer supplies the momentum event, while the price series supplies the swing geometry. The swing detector passes four levels to the structure classifier. The validator then combines the structure state, BOS flags, threshold-crossing flags, and any active candidate. Its outputs are limited to chart comments, uniquely named arrows, and Journal messages.
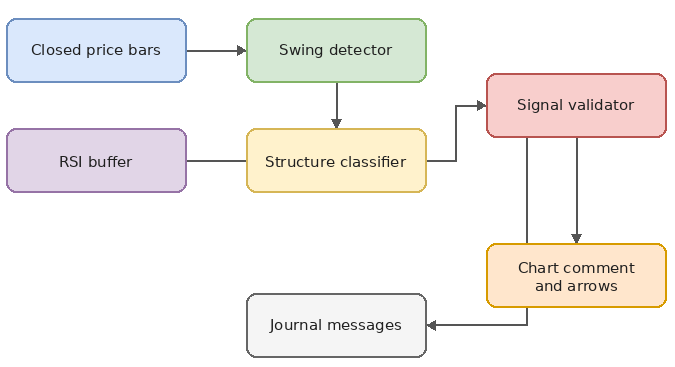
Fig. 2. Analytical Expert Advisor architecture
| Component | Input | Responsibility | Output |
|---|---|---|---|
| RSI reader | Indicator handle | Read the two latest completed RSI values | Threshold-crossing flags |
| Swing detector | OHLC bars | Find two confirmed highs and lows | Four swing levels |
| Structure classifier | Swing levels | Compare successive highs and lows | Bullish, bearish, or range |
| Candidate manager | RSI event and structure | Validate, wait, or expire | Contextual signal |
| Presentation | Current state and signal | Expose behavior without trading | Comment, arrow, Journal line |
Implementing the validator
Creating the RSI resource
The EA creates one indicator handle with iRSI(). This platform function returns a handle rather than the current oscillator value. We validate the inputs first because an invalid period or overlapping thresholds would make every later classification unreliable.
Initialization establishes the contract followed by the rest of the program. The RSI period and threshold values describe the momentum event, while the swing settings describe the structural evidence that will validate it. If either side of that contract is unusable, the EA stops before allocating an indicator resource. This early rejection keeps configuration errors separate from missing history or an unavailable indicator buffer during normal operation.
The handle also gives the indicator calculation a clear lifetime. It is created once for the chart symbol and timeframe, reused whenever a new completed bar is processed, and released during deinitialization. Recreating it on every tick would add unnecessary work and would make failure handling harder to isolate. The global handle therefore represents an owned resource rather than a temporary RSI value.
//+------------------------------------------------------------------+
//| Initializes the analytical Expert Advisor                        |
//+------------------------------------------------------------------+
int OnInit()
  {
//--- reject invalid input combinations before creating any resources
   if(!InputsAreValid())
     {
      Print("Invalid input combination.");
      return(INIT_PARAMETERS_INCORRECT);
     }


//--- create the RSI indicator handle for the current symbol and timeframe
   g_rsi_handle=iRSI(_Symbol,_Period,InpRSIPeriod,InpAppliedPrice);
   if(g_rsi_handle==INVALID_HANDLE)
     {
      PrintFormat("Failed to create the RSI handle. Error %d",GetLastError());
      return(INIT_FAILED);
     }


//--- remember the current bar and publish the initial analytical state
   g_last_bar_time=iTime(_Symbol,_Period,0);
   UpdateComment(STRUCTURE_UNKNOWN,0.0,0.0,0.0,0.0);
   return(INIT_SUCCEEDED);
  }
Initialization stores the opening time of the current bar. OnTick() therefore ignores repeated ticks and starts analysis only after another bar opens. The candle at shift one is completed at that moment, giving the oscillator and the price structure the same evaluation boundary.
This timing rule matters because RSI and swing structure must describe the same completed information set. Reading the closed-bar RSI while allowing the structural decision to react to the forming candle would mix two different states of the market. The new-bar gate prevents that mismatch and also ensures that one threshold crossing cannot be processed repeatedly as ticks arrive during the same candle.
Reading confirmed price structure
CopyRates() fills the MqlRates array used by both the swing detector and the BOS test. A swing is confirmed only when its high or low exceeds the configured number of bars on both sides. Because bars to the right must already exist, the most recent eligible swing begins at InpSwingRight plus one.
ReadStructure() receives a rates array and returns four values by reference. Its responsibility is not to decide whether the market is bullish or bearish. It only retrieves sufficient history, finds the two most recent confirmed highs and lows, and returns those levels to the classifier. Keeping detection separate from interpretation makes the swing rules reusable and prevents trend assumptions from entering the search loop.
The scan begins near the present and moves toward older bars. Consequently, the first matching pivot becomes the latest swing and the second becomes its comparison point. The loop stops as soon as both pairs are available, so the configured lookback acts as a search boundary rather than a requirement to process every copied candle. If either pair is missing, the function returns false and the coordinator reports that structure is not yet available.
//--- walk the history back to front looking for confirmed swing points
for(int shift=first_shift;shift<=final_shift;shift++)
  {
   if(highs<2 && IsSwingHigh(rates,shift))
     {
      //--- the newest swing becomes last_high, the older one prior_high
      if(highs==0)
         last_high=rates[shift].high;
      else
         prior_high=rates[shift].high;
      highs++;
     }


   if(lows<2 && IsSwingLow(rates,shift))
     {
      //--- the newest swing becomes last_low, the older one prior_low
      if(lows==0)
         last_low=rates[shift].low;
      else
         prior_low=rates[shift].low;
      lows++;
     }


      //--- both swing points are found, the scan can stop early
   if(highs==2 && lows==2)
      break;
  }
For example, a high on the current candle cannot be a confirmed swing when InpSwingRight is two: the two newer completed neighbors do not yet exist. This prevents a temporary spike from entering the structural comparison.
The left and right swing arms also explain why the latest apparent turning point is not accepted immediately. A candidate needs neighboring candles on both sides before it becomes stable enough for this model. That delay is not an execution defect; it is the cost of using confirmed structure. You can reduce the arm lengths for faster recognition, but doing so changes the analytical definition and usually increases the number of minor pivots.
Classifying the swing relationship
The classifier has one responsibility. It converts four prices into a structural state. Bullish structure requires both a higher high and a higher low. Bearish structure requires both a lower high and a lower low. Every mixed combination becomes STRUCTURE_RANGE.
The four inputs already have an established chronological meaning: last_high and last_low are the newer confirmed levels, while prior_high and prior_low are their older references. ClassifyStructure() can therefore remain a pure comparison function. It does not copy history, read the indicator, draw objects, or modify candidate state. Given the same four prices, it will always return the same classification.
Requiring agreement between highs and lows avoids interpreting partial evidence as a trend. A higher high with a lower low may describe expansion, instability, or a transition between regimes. Similarly, a lower high with a higher low may describe compression. Both cases are returned as STRUCTURE_RANGE so that the candidate manager, rather than the classifier, decides whether to wait for a subsequent break.
//+------------------------------------------------------------------+
//| Classifies the relation between consecutive swing points         |
//+------------------------------------------------------------------+
ENUM_STRUCTURE_STATE ClassifyStructure(const double last_high,
                                        const double prior_high,
                                        const double last_low,
                                        const double prior_low)
  {
//--- rising highs with rising lows confirm an uptrend
   if(last_high>prior_high && last_low>prior_low)
      return(STRUCTURE_BULLISH);


//--- falling highs with falling lows confirm a downtrend
   if(last_high<prior_high && last_low<prior_low)
      return(STRUCTURE_BEARISH);


//--- any other combination describes a range or a transition
   return(STRUCTURE_RANGE);
  }
In a widening range, a new higher high and a new lower low can occur in sequence. Labeling that pair bullish from the high alone would bypass the pending-candidate path, so the mixed case remains STRUCTURE_RANGE.
The result becomes the structural input for two later decisions. First, it can validate an RSI crossing immediately when momentum and swing direction agree. Second, it can prevent immediate validation and allow the crossing to enter a pending state. This is where the classifier contributes control rather than prediction: it decides which validation paths are currently justified by confirmed swings.
Reading a completed RSI crossing
Before requesting values, BarsCalculated() confirms that the indicator has produced enough data. CopyBuffer() then requests shifts one and two. The returned memory order places the older requested value first and the newer value second.
The program deliberately needs two RSI values because a level and a crossing are different events. current_rsi above InpOverbought tells us where momentum is now, but it does not tell us when the extreme condition began. By comparing it with previous_rsi, the EA recognizes the transition through the threshold and creates one discrete event that can be handed to the candidate state machine.
The exact copied-count check is part of the data contract. A nonnegative CopyBuffer() result is not sufficient when the decision requires two observations. If only one value is ready, neither comparison can be trusted, so ProcessClosedBar() exits without changing the active candidate. This preserves the previous analytical state until a complete pair is available.
//--- detect closed-bar RSI threshold crossings
double previous_rsi=rsi_values[0];
double current_rsi=rsi_values[1];
bool crossed_high=(previous_rsi<=InpOverbought &&
                   current_rsi>InpOverbought);
bool crossed_low=(previous_rsi>=InpOversold &&
                  current_rsi<InpOversold);
This is a crossing test, not a residence test. An RSI value that remains above 70 for six completed candles creates one entry event rather than six identical events. The structure can still evolve while the oscillator remains extreme, but a new candidate begins only after another threshold crossing.
That distinction also prevents prolonged momentum from flooding the chart with repeated arrows. Once the RSI has crossed, responsibility moves to structural validation. The oscillator does not need to cross the same level again while an existing candidate is aging; the EA instead watches whether the price confirms continuation, breaks in the opposite direction, or allows the confirmation window to expire.
Checking the break of structure
ProcessClosedBar() compares the last two completed closes with the confirmed swing boundary. Shift 1 must close beyond the boundary plus the configured buffer, while shift 2 must have remained on or inside that same boundary. This creates a fresh break event rather than a repeated signal on every bar that stays beyond the level. The following fragment is taken from the EA's classifier stage.
//--- classify the structure and detect breaks of the swing levels
   ENUM_STRUCTURE_STATE structure=ClassifyStructure(last_high,prior_high,
                                                    last_low,prior_low);
   double buffer=InpBreakBufferPoints*_Point;
   bool bullish_bos=(rates[1].close>last_high+buffer &&
                     rates[2].close<=last_high+buffer);
   bool bearish_bos=(rates[1].close<last_low-buffer &&
                     rates[2].close>=last_low-buffer);
Here buffer equals InpBreakBufferPoints × _Point. For a bullish break, the two close comparisons use last_high + buffer; for a bearish break, they use last_low − buffer. The resulting flags are passed to EvaluateSignals() beside the swing classification.
Validating continuation and reversal
EvaluateSignals() is the decision boundary. A high crossing in bullish structure becomes BUY continuation because upward momentum agrees with higher swings. The same crossing becomes SELL reversal when bearish structure or a bearish BOS is present. The low-threshold logic applies the mirrored interpretation.
The function receives already prepared facts rather than calculating them internally. structure summarizes the swing relationship; bullish_bos and bearish_bos report completed-close breaks; crossed_high and crossed_low report fresh momentum events; and bar identifies the candle on which a validated result should be displayed. This parameter boundary keeps the decision table visible and makes each branch traceable during testing.
Immediate validation is reserved for cases with sufficient agreement. An overbought crossing inside bullish structure is treated as continuation unless a bearish break contradicts that structure. When bearish evidence is already present, the same crossing becomes a reversal classification. If neither side has enough support, ArmCandidate() records the oscillator event instead of forcing a directional answer.
//--- a closed-bar crossing above the overbought threshold
if(crossed_high)
  {
      //--- bullish structure without a bearish break: continue higher
   if(structure==STRUCTURE_BULLISH && !bearish_bos)
      ValidateSignal(true,"BUY continuation",bar,rsi);
      //--- bearish structure or break: expect a reversal back down
   else if(structure==STRUCTURE_BEARISH || bearish_bos)
      ValidateSignal(false,"SELL reversal",bar,rsi);
      //--- neutral structure: arm a candidate for delayed confirmation
   else
      ArmCandidate(CANDIDATE_OVERBOUGHT,bar,rsi);
   return;
  }
A mixed structure does not invalidate the oscillator event immediately. ArmCandidate() stores the event type, time, value, and age. The age advances during each subsequent closed-bar evaluation. A bearish BOS can confirm a pending overbought reversal, while a bullish BOS can confirm a pending oversold reversal. The candidate expires when its age exceeds InpConfirmationBars.
The stored time and RSI value preserve the origin of the pending observation even though confirmation may occur several bars later. Candidate age measures how long the structural evidence is allowed to arrive. This turns an ambiguous crossing into a bounded state rather than an indefinite market bias. Expiration clears that bias explicitly and records that the required relationship never formed within the model's chosen horizon.
ValidateSignal() is the only path that converts a candidate into a visible directional classification. It draws the appropriate arrow, updates the most recent result, writes a Journal message, and clears candidate state. Centralizing those effects prevents one branch from drawing a signal while another forgets to reset its age or type.
Keeping output identifiable and recoverable
Each validated event receives a unique object name composed of the configured prefix, bar time, and classification. ObjectCreate() draws the arrow only if that name does not already exist. This prevents repeated ticks or re-evaluation from duplicating the same chart marker.
The naming rule also establishes ownership. The prefix identifies objects created by this EA, the timestamp separates events occurring on different bars, and the label distinguishes classifications that could share a time during controlled replay. ObjectFind() checks that identity before creation, making visualization idempotent for the same validated event.
The chart comment serves a different purpose from the arrow. An arrow preserves a historical validation, whereas the comment reports the live analytical state: current structure, completed-bar RSI, swing boundaries, candidate type, and latest result. The Journal adds a chronological text record. Together, these outputs allow you to compare the decision path without introducing an order-management layer.
During deinitialization, IndicatorRelease() releases the RSI resource. ObjectsDeleteAll() receives the EA prefix, so cleanup targets only objects owned by this instance. The program also clears its chart comment and requests a redraw.
Cleanup completes the ownership contract established during initialization. The EA does not delete unrelated chart annotations because their names do not begin with its prefix. Releasing the handle and removing only owned visual resources makes attachment, removal, and repeated testing predictable while leaving the chart in the state it had before this analytical layer was applied.
Operating the Expert Advisor
| Input | Default | Purpose |
|---|---|---|
| InpRSIPeriod | 14 | RSI averaging period |
| InpAppliedPrice | PRICE_CLOSE | Price series used to calculate RSI; changing it can shift the RSI values and threshold-crossing bars |
| InpOverbought | 70 | Upper crossing threshold |
| InpOversold | 30 | Lower crossing threshold |
| InpSwingLeft | 2 | Older bars required around a pivot |
| InpSwingRight | 2 | Newer bars required to confirm a pivot |
| InpStructureLookback | 150 | Maximum scan depth for confirmed swings |
| InpConfirmationBars | 5 | Lifetime of a pending reversal candidate |
| InpBreakBufferPoints | 10 | Break buffer required beyond a swing level, in points |
| InpObjectPrefix | MSRSI_ | Ownership namespace for chart arrows |
Compile the attachment in MetaEditor, place it in the Experts folder, and attach it to a chart. No trading permission is required because the EA does not send orders. The chart comment reports the current structure, completed-bar RSI value, latest swing levels, active candidate, and most recent classification.
These defaults are starting values for examining the rule, not optimized settings. Two bars on each side reject one-bar turns and require two newer completed bars before a pivot is confirmed. The 150-bar lookback limits the search for two confirmed highs and lows; if a pair is missing, the EA reports unavailable structure. A five-bar confirmation window bounds how long a pending crossing can wait. The ten-point buffer requires a close beyond the swing by ten times the symbol's _Point. On another symbol or timeframe, compare swing arms of one to three bars, shorter and longer search and confirmation windows, and buffers measured in that symbol's points. Record the settings for every comparison.
Testing and evidence
I tested the EA on EURUSD H1 and use the second of two completed runs recorded in the Journal. It began at 10:12:47 on 26 October 2026 with the settings below. Both runs list the same inputs; the selected event lines all come from the second one. The tester's times are server times as recorded in its Journal.
| Run condition | Recorded value |
|---|---|
| Tester and data source | MetaTrader 5 tester build 6230; Deriv-Demo EURUSD quote history; H1 cache beginning 1 January 2023 at 22:00 |
| Configured interval | 1 January 2024 00:00 to 31 December 2024 00:00, as printed by the tester |
| Modeling mode | Every tick generating; the Journal does not describe this as a real-tick run |
| RSI configuration | Period 14; InpAppliedPrice=1 (PRICE_CLOSE); overbought 70; oversold 30 |
| Structure configuration | Swing left/right 2/2; lookback 150; confirmation 5 bars; BOS buffer 10 points |
| Display configuration | Signal arrows enabled; object prefix MSRSI_ |
| Completion | Tester reports 20,732,299 ticks and 6,218 generated bars; the thread finished at 10:13:06 on 26 October 2026 |
The Journal follows the part of the run visible in Figure 3. It records a BUY continuation on 31 May, two candidate arming messages on 3 June, and an expiration on 4 June. A SELL continuation appears on 7 June, after the displayed chart window. Each leading timestamp is simulated event time; the final timestamp in an arming or classification message names the completed H1 bar.
| Simulated time | Journal message |
|---|---|
| 31 May 2024 13:00 | BUY continuation | RSI 78.00 | 2024.05.31 12:00 |
| 3 Jun 2024 16:00 | Candidate armed at 2024.06.03 15:00 | RSI 72.36 |
| 3 Jun 2024 19:00 | Candidate armed at 2024.06.03 18:00 | RSI 72.93 |
| 4 Jun 2024 01:00 | Candidate expired without structural confirmation |
| 7 Jun 2024 13:00 | SELL continuation | RSI 24.87 | 2024.06.07 12:00 |
The May 31 reading of RSI 78.00 produced a BUY continuation classification under bullish structure, so an overbought crossing did not automatically become a SELL. The June 3 arming messages are pending-state events, not two validated signals. The June 4 expiration shows that the required structural confirmation did not arrive within the window. This Journal excerpt records the EA’s decisions but omits the swing boundaries and closes needed to recalculate every condition. It cannot establish the frequency or accuracy of classifications across the full year. Since the EA places no orders, the final 10,000 USD balance is simply the unchanged test deposit.
Figure 3 shows the chart from 29 May through 6 June 2024, a short window within the configured annual test. The comment reads “Bullish: higher high and higher low,” closed-bar RSI 60.54, swing high 1.09020, swing low 1.08837, closed price 1.08957, candidate “None,” and “Candidate expired without structural confirmation.” The RSI subwindow reads 60.18 on the current bar, while the EA comment uses the last completed bar. The 4 June Journal expiration is consistent with the retained result, while the green arrow depicts an earlier BUY classification. The screenshot has no precise capture-bar timestamp, so the Journal establishes the surrounding sequence rather than the exact frame time. The “Skip to” field is a navigation target, not the chart date.

Fig. 3. Candidate expiration and structural status in Strategy Tester visualization
Limitations
The swing algorithm is local and deterministic, but its output depends on the selected left and right strengths. Confirmation necessarily occurs after the pivot candle because right-side bars must close. The most recent market turn can therefore exist before the model is allowed to label it.
The structure classifier uses only the latest two confirmed highs and lows. It does not measure higher-timeframe trend, liquidity, volume, volatility regime, divergence, or session context. A BOS is based on the candle close and a fixed break buffer in points; the model does not adapt that distance to the Average True Range.
The words BUY and SELL describe directional classifications, not executed recommendations. No position is opened, and the model contains no risk management. Begin the next development stage only after observations confirm that state transitions match the intended interpretation on multiple symbols and timeframes.
Conclusion
We have implemented an analytical EA that separates oscillator conditions from directional decisions. RSI supplies the momentum event, confirmed swings define the market structure, and a break of structure (BOS) provides evidence for a delayed reversal within a bounded confirmation window. This arrangement allows an overbought reading to validate bullish continuation or bearish reversal without treating either interpretation as automatic.
We also established explicit pending and expiration states, closed-bar processing, unique chart-object ownership, and safe resource cleanup. The resulting program provides a transparent, testable bridge between a familiar oscillator and the structural context needed to interpret its signals. It remains an analytical component rather than a complete trading system, and its behavior should be validated across symbols and timeframes before integration with trade execution.
Key lessons
- Overbought and oversold describe momentum conditions rather than guaranteed reversals.
- Confirmed swing relationships provide directional context that RSI does not contain.
- A threshold crossing should become a candidate before it becomes a validated interpretation.
- Aligned structure can validate continuation, while an opposite BOS can validate reversal.
- Closed-bar evaluation prevents incomplete candles from changing the decision during formation.
- Analytical validation should precede order execution and performance claims.
Attachments
| Filename | Type | Purpose |
|---|---|---|
| MarketStructure_RSI_Validator.mq5 | Expert Advisor | Complete closed-bar RSI and market-structure validator |
Warning: All rights to these materials are reserved by MetaQuotes Ltd. Copying or reprinting of these materials in whole or in part is prohibited.
This article was written by a user of the site and reflects their personal views. MetaQuotes Ltd is not responsible for the accuracy of the information presented, nor for any consequences resulting from the use of the solutions, strategies or recommendations described.

 Use of WinAPI—Implementing Text-to-Speech in MQL5
 RSI Divergence Grid Expert Advisor with Risk Manager in MQL5
 Neural Networks in Trading: Recurrent Modeling of Market Micromovements (Conclusion)
 Self-Optimizing Expert Advisors in MQL5 (Part 20): Causality Regularization With Time-Lagged Independent Components Analysis (3)

- Free trading apps
- Over 8,000 signals for copying
- Economic news for exploring financial markets
You agree to website policy and terms of use