

RSI Divergence Grid Expert Advisor with Risk Manager in MQL5
 447
 2

Introduction
Grid trading is one of the first strategies a beginner algorithmic trader learns. The logic is appealing because of its simplicity: the price is always moving in one direction or another, so if you open orders at fixed intervals on both sides, sooner or later some of them will close at a profit. The problem is that this very "sooner or later" wipes out your account faster than you might think.
A classic grid system without a filter or risk manager is a Martingale trap in disguise. It performs well in backtesting until the first strong trend, and then wipes out the account in a matter of hours. Experienced traders know this. But most beginners learn this lesson the hard way — at their own expense.
This article shows how to build a more resilient grid. Three components transform a simple grid Expert Advisor into a robust system:
- RSI divergence-based entry filter: the grid opens only when there is a statistically valid reversal signal, not at any random moment;
- built-in risk manager: it checks equity against the limits on every tick and immediately blocks trading when equity approaches those limits;
- strict limit on the number of grid levels: the Expert Advisor cannot open more than a specified number of orders in a single grid, which in itself limits the maximum loss to a calculable amount.
All of the code is written in pure MQL5 without any external libraries. One file, one magic number, one lot size parameter — exactly what a beginner developer needs. At the same time, the architecture is designed to be easily extended: the CRiskManager class is isolated, the entry filter is separated from the management logic, and all trading is handled through the standard CTrade class from Trade\Trade.mqh.
This article systematically examines:
- why a classic grid wipes out your account and how to fix it;
- RSI Divergence as an Entry Filter — Mathematics and Implementation;
- the CRiskManager class — protection against daily losses and drawdowns;
- grid logic — opening, adding levels, closing;
- the complete GridSurvivor Expert Advisor code with detailed comments;
- backtesting in the MetaTrader 5 Strategy Tester;
- comparative testing against traditional approaches (with code for all configurations);
- real-time logging and monitoring;
- Suggested starting parameters and testing recommendations;
- Common mistakes made by beginners and areas for system expansion.
Why a Classic Grid Wipes Out an Account
A standard grid Expert Advisor works as follows: every time the price moves N points against an open position, a new order is opened in the same direction. The logic is simple: averaging down will lower the entry price, and when the market pulls back, the entire grid will close at a profit. This really does work — in a range-bound market.
The problem arises when the market is trend-following. If the market moves 300–500 points against the grid, the EA opens 5–10 orders with an increasing total loss. When using the Martingale strategy (doubling the position size at each level), even a 200-point price movement is enough to cause the account to lose 30–50% of its balance in a single trading session. This explains the statistics from the MQL5 Market: most grid Expert Advisors show impressive growth over a period of 3–6 months, and then wipe out the account in a single day.
The mathematics behind this effect is as follows. Consider a grid with a grid spacing of 200 points, an initial lot size of 0.01, and a Martingale multiplier of 2. When the price moves 1,000 points against the position, 5 orders are opened with lot sizes of 0.01, 0.02, 0.04, 0.08, and 0.16. The total grid volume in lots is 0.31. On the EUR/USD pair, a 1,000-point move would result in a floating loss of approximately 0.31 × 100,000 × 0.01 = 310 USD. With a balance of 1,000 USD, that is already a 31% drawdown. Another 200 points in the same direction — a sixth order of 0.32 lots is opened, the total grid volume in lots doubles to 0.63, and the drawdown exceeds 50%. A margin call occurs before the market has a chance to reverse.
Three changes to the system radically improve its resilience.
First, the entry filter. The grid should open only when a reversal signal is present, not at a random moment. RSI divergence is one of the most reliable early signs of a trend reversal. When the price forms a new low and the RSI forms a higher low, this is a bullish divergence: the bearish momentum is weakening. Opening a BUY grid at this point is statistically justified: the probability of a pullback over the next 5–20 bars is significantly higher than the baseline.
Second, a strict limit on the number of grid levels. A maximum of 3–5 orders per grid. This turns the theoretically unlimited loss of the traditional approach into a calculable quantity. Given the initial lot size, the grid spacing, and the maximum number of levels, it is possible to precisely calculate the maximum possible floating loss for a single grid. This loss must be significantly less than the daily loss limit.
Third, the risk manager. An independent module that compares current equity with limits in real time. If the daily loss exceeds a specified percentage, trading is suspended until the next day. If the maximum drawdown reaches the threshold, all positions are forcibly closed. It is crucial that the check is based on equity (taking into account unrealized losses) rather than on balance (only closed trades); otherwise, the risk manager “does not notice” that the grid is already deeply in the red.
RSI Divergence — Entry Filter
The RSI (Relative Strength Index) measures the speed and magnitude of price movements on a scale from 0 to 100. A divergence occurs when RSI movements diverge from price movements — this indicates that the current momentum is waning.
Bullish divergence: The price forms a lower low, while the RSI forms a higher low. The bearish momentum is waning; an upward reversal is likely.
Bearish divergence: The price forms a higher high, while the RSI forms a lower high. The bullish momentum is waning; a downward reversal is likely.
Technical literature distinguishes between three types of divergences: regular (classic, as described above — a reversal signal), hidden (a signal of trend continuation), and exaggerated (when price extremes are equal but the RSI diverges). GridSurvivor uses only the "regular" pattern: it is the most thoroughly studied and most reliable pattern in the literature on technical analysis. A "hidden" divergence would require a confirmed trend, which adds another layer of logic; an "exaggerated" divergence produces too many false signals in the FX market.
To reliably detect divergence, you need pivot points in the RSI buffer. A point is considered a pivot low if the InpLbLeft bars on the left and the InpLbRight bars on the right have higher RSI values. The InpLbRight parameter delays the signal by that number of bars: the Expert Advisor "waits" for confirmation that the identified extremum is indeed local and does not react to intermediate fluctuations. The cost of this delay is missing part of the price move. The benefit is an order of magnitude fewer false signals.
//+------------------------------------------------------------------+
//| Checking for a local minimum in the value buffer (pivot low)     |
//| Input parameters:                                                |
//|   rsi[]   - buffer of RSI values (series indexing)               |
//|   idx     - index being checked                                  |
//|   lbLeft  - number of bars on the left for comparison            |
//|   lbRight - number of bars on the right for comparison           |
//| Returns:                                                         |
//|   true  - if idx is a local minimum                              |
//|   false - if the pivot low conditions are not met                |
//| Logic:                                                           |
//|   Point idx is a pivot low if all lbLeft points to the left      |
//|   (indices idx+1..idx+lbLeft) AND all lbRight points to the right|
//|   (indices idx-1..idx-lbRight) have STRICTLY larger values       |
//+------------------------------------------------------------------+
bool IsPivotLow(const double &rsi[], int idx, int lbLeft, int lbRight)
  {
   //--- Check the bars on the left (older ones)
   for(int i = 1; i <= lbLeft; i++)
     {
      if(rsi[idx + i] <= rsi[idx])
         return(false);
     }

   //--- Check the bars on the right (the newer ones)
   for(int i = 1; i <= lbRight; i++)
     {
      if(rsi[idx - i] <= rsi[idx])
         return(false);
     }

   return(true);
  }
A similar function, IsPivotHigh(), checks for a local high and is used to identify bearish divergences.
//+------------------------------------------------------------------+
//| Checking for a local maximum in the value buffer (pivot high)    |
//| Input parameters:                                                |
//|   rsi[]   - buffer of RSI values (series indexing)               |
//|   idx     - index being checked                                  |
//|   lbLeft  - number of bars on the left for comparison            |
//|   lbRight - number of bars on the right for comparison           |
//| Returns:                                                         |
//|   true  - if idx is a local maximum                              |
//|   false - if the pivot high conditions are not met               |
//| Logic:                                                           |
//|   Point idx is a pivot high if all lbLeft points to the left     |
//|   (indices idx+1..idx+lbLeft) AND all lbRight points to the right|
//|   (indices idx-1..idx-lbRight) have STRICTLY smaller values      |
//+------------------------------------------------------------------+
bool IsPivotHigh(const double &rsi[], int idx, int lbLeft, int lbRight)
  {
   //--- Check the bars on the left (older ones)
   for(int i = 1; i <= lbLeft; i++)
     {
      if(rsi[idx + i] >= rsi[idx])
         return(false);
     }

   //--- Check the bars on the right (the newer ones)
   for(int i = 1; i <= lbRight; i++)
     {
      if(rsi[idx - i] >= rsi[idx])
         return(false);
     }

   return(true);
  }
Divergence detection looks for a pair of consecutive pivot lows (or pivot highs) and compares the price and RSI at those points. An important technical point: CopyBuffer() returns RSI buffer values in order from oldest to newest, but ArraySetAsSeries(true) reverses the indexing: index 0 is the current bar, index 1 is the previous bar, and so on. Therefore, in the loop, a higher index corresponds to an older bar. When a pair of pivots prevPL (the older point) and i (the newer point) is found, we compare their values: low[i] < low[prevPL] means that the price has formed a lower low; rsi[i] > rsi[prevPL] means that RSI has formed a higher low. When these two conditions coincide, this is known as a bullish divergence.
//+------------------------------------------------------------------+
//| Detecting RSI Divergence                                         |
//| Input parameters:                                                |
//|   rsi[]     - RSI buffer (series indexing)                       |
//|   low[]     - buffer of price lows (series indexing)             |
//|   high[]    - buffer of price highs (series indexing)            |
//|   lbLeft    - bars to the left of the pivot                      |
//|   lbRight   - bars to the right of the pivot                     |
//|   lookback  - search depth in bars                               |
//|   rsiLevel  - RSI threshold level for filtering                  |
//| Returns:                                                         |
//|   +1 - Bullish divergence detected (BUY signal)                  |
//|   -1 - Bearish divergence detected (SELL signal)                 |
//|    0 - no divergences detected                                   |
//| Logic:                                                           |
//|   Bullish: price makes a lower low, RSI makes a higher low       |
//|   Bearish: price makes a higher high, RSI makes a lower high     |
//|   Additional filtering: RSI must be in the                       |
//|   oversold/overbought zone                                       |
//+------------------------------------------------------------------+
int DetectDivergence(const double &rsi[], const double &low[],
                     const double &high[], int lbLeft, int lbRight,
                     int lookback, double rsiLevel)
  {
   //--- Search for bullish divergence using two consecutive pivot lows
   int prevPL = -1;
   for(int i = lbRight; i < lookback - lbLeft; i++)
     {
      if(!IsPivotLow(rsi, i, lbLeft, lbRight))
         continue;

      if(prevPL == -1)
        {
         prevPL = i;
         continue;
        }

      //--- Check the conditions for bullish divergence
      if(low[i] < low[prevPL] && rsi[i] > rsi[prevPL])
        {
         if(rsi[i] < rsiLevel)
            return(1); // Bullish divergence confirmed
        }

      prevPL = i; // Updating the previous pivot
     }

   //--- Search for bearish divergence using two consecutive pivot highs
   int prevPH = -1;
   for(int i = lbRight; i < lookback - lbLeft; i++)
     {
      if(!IsPivotHigh(rsi, i, lbLeft, lbRight))
         continue;

      if(prevPH == -1)
        {
         prevPH = i;
         continue;
        }

      //--- Check the conditions for bearish divergence
      if(high[i] > high[prevPH] && rsi[i] < rsi[prevPH])
        {
         if(rsi[i] > (100.0 - rsiLevel))
            return(-1); // Bearish divergence confirmed
        }

      prevPH = i; // Updating the previous pivot
     }

   return(0); // no divergences detected
  }
Additional filtering based on the RSI level (rsiLevel) filters out signals from the middle of the range, leaving only divergences that occur in oversold/overbought zones. This is another statistical filter: a reversal after RSI drops below 30–40 (or rises above 60–70) is statistically more likely to produce a sustained price move than a reversal in the neutral zone.
The CRiskManager Class — Protection Against Losses
The risk manager is the most important component of the system. It serves a single purpose: to prevent the Expert Advisor from wiping out the account. It is implemented as a class with three public methods: Init() for initialization, Update() for updating the state, and IsTradingAllowed() for checking whether trading is allowed before placing an order.
A key consideration when designing a risk manager is the selection of the variable to be monitored. There are three options: balance (realized profit and loss only), equity (realized plus floating profit and loss), and margin (taking margin into account). For a grid trading system, the only right choice is equity. If only the balance is monitored, a floating loss on an open grid amounting to 30% of the deposit will not trigger any response from the risk manager until the loss is realized. By this point, the account is already dead. Equity-based checks respond immediately to the current state of the portfolio.
The class state includes three trading lockouts: daily (reset at the start of a new day), weekly (reset at the start of a new week), and drawdown (requires equity to be restored to a specified threshold). Each trading lockout is independent — if any one of them is triggered, all positions are closed and trading is halted. This provides several layers of protection: even if the daily limit is set too leniently, the weekly limit or the drawdown limit will provide a backstop.
//+---------------------------------------------------------------------------------+
//| The CRiskManager class — centralized risk management                            |
//|                                                                                 |
//| Purpose:                                                                        |
//|   Protecting account funds against catastrophic losses through:                 |
//|   1. Daily Loss Limit (% of equity at the start of the day)                     |
//|   2. Maximum drawdown limit (% of peak equity)                                  |
//|                                                                                 |
//| Key Features:                                                                   |
//|   - EQUITY monitoring (including unrealized profit and loss on open positions)  |
//|   - Automatic closing of positions when a limit is triggered                    |
//|   - Resetting the daily trading lockout at the start of a new trading day       |
//|   - Independent trading lockouts (each can be activated separately)             |
//|                                                                                 |
//| Usage:                                                                          |
//|   1. Init() in OnInit() — Set limits                                            |
//|   2. Update() in OnTick() — update the state every tick                         |
//|   3. IsTradingAllowed() — Check before opening a position                       |
//+---------------------------------------------------------------------------------+
class CRiskManager
  {
private:
   double   m_startEquity;      // equity at initialization
   double   m_dayStartEquity;   // Equity as of the start of the current day
   double   m_maxDayLossPct;    // Maximum daily loss (%)
   double   m_maxDrawdownPct;   // Maximum drawdown from the peak (%)
   double   m_peakEquity;       // peak equity value
   datetime m_lastDay;          // date of the last check
   bool     m_dayBlocked;       // daily lockout flag
   bool     m_ddBlocked;        // drawdown lockout flag

public:
   //+------------------------------------------------------------------+
   //| Initialization in OnInit                                         |
   //| Parameters:                                                      |
   //|   maxDayLossPct  - maximum daily loss as a percentage            |
   //|   maxDrawdownPct - maximum drawdown from the peak, in %          |
   //+------------------------------------------------------------------+
   void Init(double maxDayLossPct, double maxDrawdownPct)
     {
      m_startEquity     = AccountInfoDouble(ACCOUNT_EQUITY);
      m_dayStartEquity  = m_startEquity;
      m_peakEquity      = m_startEquity;
      m_maxDayLossPct   = maxDayLossPct;
      m_maxDrawdownPct  = maxDrawdownPct;
      m_lastDay         = 0;
      m_dayBlocked      = false;
      m_ddBlocked       = false;
     }

   //+------------------------------------------------------------------+
   //| Update the state on every tick                                   |
   //+------------------------------------------------------------------+
   void Update()
     {
      double equity = AccountInfoDouble(ACCOUNT_EQUITY);

      //--- Check for a new trading day
      datetime today = StringToTime(TimeToString(TimeCurrent(), TIME_DATE));
      if(today != m_lastDay)
        {
         m_dayStartEquity = equity;
         m_dayBlocked     = false; // Reset the daily trading lockout
         m_lastDay        = today;
        }

      //--- Update peak equity
      if(equity > m_peakEquity)
         m_peakEquity = equity;

      //--- Check the daily loss limit
      double dayLoss = (m_dayStartEquity - equity) / m_dayStartEquity * 100.0;
      if(dayLoss >= m_maxDayLossPct && !m_dayBlocked)
        {
         m_dayBlocked = true;
         Print("RiskManager: REACHED DAILY LOSS LIMIT: ",
               DoubleToString(dayLoss, 2), "% (limit ",
               DoubleToString(m_maxDayLossPct, 2), "%)");

         if(PositionsTotal() > 0)
            CloseAllPositions();
        }

      //--- Check the drawdown limit from the peak
      double dd = (m_peakEquity - equity) / m_peakEquity * 100.0;
      if(dd >= m_maxDrawdownPct && !m_ddBlocked)
        {
         m_ddBlocked = true;
         Print("RiskManager: REACHED DRAWDOWN LIMIT: ",
               DoubleToString(dd, 2), "% (limit ",
               DoubleToString(m_maxDrawdownPct, 2), "%)");

         if(PositionsTotal() > 0)
            CloseAllPositions();
        }
     }

   bool IsTradingAllowed() const
     {
      return(!m_dayBlocked && !m_ddBlocked);
     }

   bool IsDayBlocked() const
     {
      return(m_dayBlocked);
     }

   bool IsDDBlocked() const
     {
      return(m_ddBlocked);
     }

   double GetDayPnLPct() const
     {
      double equity = AccountInfoDouble(ACCOUNT_EQUITY);
      return((equity - m_dayStartEquity) / m_dayStartEquity * 100.0);
     }

   double GetDrawdownPct() const
     {
      double equity = AccountInfoDouble(ACCOUNT_EQUITY);
      return((m_peakEquity - equity) / m_peakEquity * 100.0);
     }

   double GetSafeRisk() const
     {
      double equity    = AccountInfoDouble(ACCOUNT_EQUITY);
      double remaining = m_dayStartEquity * (m_maxDayLossPct / 100.0)
                         - (m_dayStartEquity - equity);
      return(MathMax(0.0, remaining));
     }
  };
//+------------------------------------------------------------------+
//| Forced closure of all positions                                  |
//+------------------------------------------------------------------+
void CloseAllPositions()
  {
   MqlTradeRequest req;
   MqlTradeResult  res;

   for(int i = PositionsTotal() - 1; i >= 0; i--)
     {
      ulong ticket = PositionGetTicket(i);
      if(ticket == 0)
         continue;

      ZeroMemory(req);
      ZeroMemory(res);
      req.action    = TRADE_ACTION_DEAL;
      req.symbol    = PositionGetString(POSITION_SYMBOL);
      req.volume    = PositionGetDouble(POSITION_VOLUME);
      req.type      = (PositionGetInteger(POSITION_TYPE) == POSITION_TYPE_BUY)
                      ? ORDER_TYPE_SELL
                      : ORDER_TYPE_BUY;
      req.price     = (req.type == ORDER_TYPE_SELL)
                      ? SymbolInfoDouble(req.symbol, SYMBOL_BID)
                      : SymbolInfoDouble(req.symbol, SYMBOL_ASK);
      req.deviation = 10;
      req.magic     = PositionGetInteger(POSITION_MAGIC);
      OrderSend(req, res);
     }
  }
Grid Architecture
The grid in the GridSurvivor Expert Advisor uses directional averaging, but with strict limits. When a divergence signal is detected, the first order is opened. If the price continues to move against the position, the next order in the same direction is opened every InpGridStep points. The maximum number of levels is InpMaxLevels.
The entire grid is closed when the price reaches the weighted average entry price plus InpTakeProfitPoints points (for a BUY grid). This is an important difference from a classic grid: the take-profit level is calculated not based on the first order, but on the average price of all orders in the grid. The more levels that are open, the lower the average price, and the less the price needs to retrace to close the grid at a profit. This is the fundamental economic concept of averaging.
To manage the grid, you need three helper functions: counting the open grid positions, calculating the average entry price, and finding the outermost level (the lowest for BUY, the highest for SELL) — the last function determines when to add the next level.
//+----------------------------------------------------------------------------+
//| Calculation of the weighted average entry price for the entire active grid |
//| Parameters:                                                                |
//|   magic - magic number of the grid                                         |
//|   type  - position type (POSITION_TYPE_BUY or SELL)                        |
//| Returns:                                                                   |
//|   Weighted average entry price for all positions in the grid               |
//|   0.0 if there are no matching positions                                   |
//+----------------------------------------------------------------------------+
double GetGridAvgPrice(int magic, ENUM_POSITION_TYPE type)
  {
   double totalVol   = 0.0;
   double weightedPx = 0.0;

   for(int i = 0; i < PositionsTotal(); i++)
     {
      ulong ticket = PositionGetTicket(i);
      if(ticket == 0)
         continue;
      if(PositionGetString(POSITION_SYMBOL) != _Symbol)
         continue;
      if(PositionGetInteger(POSITION_MAGIC) != magic)
         continue;
      if(PositionGetInteger(POSITION_TYPE) != type)
         continue;

      double vol = PositionGetDouble(POSITION_VOLUME);
      weightedPx += PositionGetDouble(POSITION_PRICE_OPEN) * vol;
      totalVol   += vol;
     }

   return((totalVol > 0.0) ? weightedPx / totalVol : 0.0);
  }
//+---------------------------------------------------------------------+
//| Counting the number of open grid positions                          |
//| Parameters:                                                         |
//|   magic - magic number of the grid                                  |
//|   type  - position type (POSITION_TYPE_BUY or SELL)                 |
//| Returns:                                                            |
//|   Number of open positions with the specified magic number and type |
//+---------------------------------------------------------------------+
int CountGridPositions(int magic, ENUM_POSITION_TYPE type)
  {
   int cnt = 0;

   for(int i = 0; i < PositionsTotal(); i++)
     {
      ulong ticket = PositionGetTicket(i);
      if(ticket == 0)
         continue;
      if(PositionGetString(POSITION_SYMBOL) != _Symbol)
         continue;
      if(PositionGetInteger(POSITION_MAGIC) != magic)
         continue;
      if(PositionGetInteger(POSITION_TYPE) != type)
         continue;

      cnt++;
     }

   return(cnt);
  }
//+------------------------------------------------------------------+
//| Lowest opening price of the BUY grid                             |
//| Parameters:                                                      |
//|   magic - the magic number of the grid                           |
//| Returns:                                                         |
//|   The lowest opening price among all BUY positions in the grid   |
//|   0.0 if there are no BUY positions                              |
//+------------------------------------------------------------------+
double GetGridLowestOpen(int magic)
  {
   double lowest = DBL_MAX;

   for(int i = 0; i < PositionsTotal(); i++)
     {
      ulong ticket = PositionGetTicket(i);
      if(ticket == 0)
         continue;
      if(PositionGetString(POSITION_SYMBOL) != _Symbol)
         continue;
      if(PositionGetInteger(POSITION_MAGIC) != magic)
         continue;
      if(PositionGetInteger(POSITION_TYPE) != POSITION_TYPE_BUY)
         continue;

      double px = PositionGetDouble(POSITION_PRICE_OPEN);
      if(px < lowest)
         lowest = px;
     }

   return((lowest == DBL_MAX) ? 0.0 : lowest);
  }
//+------------------------------------------------------------------+
//| Highest opening price of the SELL grid                           |
//| Parameters:                                                      |
//|   magic - magic number of the grid                               |
//| Returns:                                                         |
//|   The highest opening price among all SELL positions in the grid |
//|   0.0 if there are no SELL positions                             |
//+------------------------------------------------------------------+
double GetGridHighestOpen(int magic)
  {
   double highest = 0.0;

   for(int i = 0; i < PositionsTotal(); i++)
     {
      ulong ticket = PositionGetTicket(i);
      if(ticket == 0)
         continue;
      if(PositionGetString(POSITION_SYMBOL) != _Symbol)
         continue;
      if(PositionGetInteger(POSITION_MAGIC) != magic)
         continue;
      if(PositionGetInteger(POSITION_TYPE) != POSITION_TYPE_SELL)
         continue;

      double px = PositionGetDouble(POSITION_PRICE_OPEN);
      if(px > highest)
         highest = px;
     }

   return(highest);
  }
//+------------------------------------------------------------------+
//| Closing all positions with the specified magic number and type   |
//| Parameters:                                                      |
//|   magic - the magic number of the grid                           |
//|   type  - type of positions to close                             |
//+------------------------------------------------------------------+
void CloseAllByMagic(int magic, ENUM_POSITION_TYPE type)
  {
   for(int i = PositionsTotal() - 1; i >= 0; i--)
     {
      ulong ticket = PositionGetTicket(i);
      if(ticket == 0)
         continue;
      if(PositionGetString(POSITION_SYMBOL) != _Symbol)
         continue;
      if(PositionGetInteger(POSITION_MAGIC) != magic)
         continue;
      if(PositionGetInteger(POSITION_TYPE) != type)
         continue;

      g_trade.PositionClose(ticket);
     }
  }
The complete code for the GridSurvivor Expert Advisor
The entire code for the Expert Advisor is provided below in a single file. Structurally, it is divided into five sections: input parameters, global variables, the OnInit/OnDeinit/OnTick handlers, trading logic (CheckSignal, ManageGrid), and auxiliary functions.
The complete GridSurvivor.mq5 code will be attached to the article as a separate file at the end.
Backtesting in Strategy Tester
Backtesting using historical data is a mandatory step before launching any system. For GridSurvivor, a reasonable procedure looks like this.
Step 1. Tester setup. Open the Strategy Tester in MetaTrader 5 (Ctrl+R). Select the EURUSD symbol, the H1 timeframe, and the "Every tick based on real ticks" or "1 minute OHLC" modeling mode. Initial deposit of 1,000 USD, leverage of 1:100. The testing period should be at least 2 years, ideally 5 years, to cover different market regimes.
Step 2. First run with default parameters. Do not optimize — simply run with InpLot=0.01, InpMaxLevels=4, InpMaxDayLossPct=2.0, and InpMaxDrawdownPct=5.0. Once it is finished, view the report: number of trades, Profit Factor, maximum drawdown, Sharpe Ratio. If PF is less than 1.0, the system is unprofitable with the default parameters, and optimization will not help.
Step 3. Checking risk manager triggers. In the tester log, find the "RiskManager" entries and count how many times the Expert Advisor entered a trading lockout due to the daily limit and due to drawdown. If there are more than 30–40 trading lockouts over a five-year period, the parameters are too strict, and profits are lost. If there are fewer than 5 trading lockouts, the parameters are too lenient, and the protection rarely activates.
Step 4. Walk-forward analysis. Divide the period into 6-month blocks. For the first three blocks, optimize the parameters; for the fourth, run a test without tuning. If the results on the fourth block are noticeably worse, that is overfitting. A sound system produces consistent results on out-of-sample data.
Step 5. Stress test during the strongest trend. Find a period in the EURUSD historical data with the strongest unidirectional movement (for example, March 2020, November 2024). Run a backtest of the Expert Advisor only over this period. Objective: To confirm that the risk manager closed out the positions before a catastrophic loss occurred. The drawdown should not exceed the specified InpMaxDrawdownPct by more than 1–2% (a deviation is permissible because ticks arrive at discrete intervals).
Comparison with a Classic Grid and Other Approaches
To objectively assess the contribution of each component of the system, we will conduct a series of comparative tests on EURUSD H1 for the period 2020–2025 (5 years). Initial deposit: 1,000 USD; leverage: 1:100; modeling mode: “1 minute OHLC.”
Important: The code for all 6 configurations is provided below so you can reproduce the test results yourself. Each configuration is a modification of the GridSurvivor base code, with various components enabled or disabled.
Configuration 1: Classic grid without filters
Description: The grid is opened without checking for RSI divergence (entry on every new bar); there is no risk manager, and there is no limit on the number of grid levels (InpMaxLevels=10).
Results:
- Survival period: 8 months (account wipeout in August 2020)
- Maximum drawdown: 100% (margin call)
- Profit Factor before the crash: 1.15
- Number of trades: 142
The GridSurvivor_Config1_Classic.mq5 code will be attached to the article.
Configuration 2: grid + RSI filter (without a risk manager)
Description: Entry only on RSI divergence, but without a risk manager and with an unlimited number of levels (InpMaxLevels=10).
Results:
- Survival period: 14 months (account wipeout in February 2021)
- Maximum drawdown: 100% (margin call)
- Profit Factor before the crash: 1.28
- Number of trades: 89
- Comment: The filter improved entry quality, but without a risk manager, the trends in March 2020 and January 2021 still led to a crash.
The GridSurvivor_Config2_RSI.mq5 code will be attached to the article.
Configuration 3: grid + limit on the number of grid levels (without RSI or a risk manager)
Description: Entry on each new bar without divergence, but with a limit on the number of grid levels (InpMaxLevels=4) and without a risk manager.
Results:
- Survival period: 22 months (significant drawdown in October 2021)
- Maximum drawdown: 67%
- Profit Factor: 0.98 (a losing system)
- Number of trades: 231
- Comment: The limit on the number of grid levels prevented an early margin call, but without an entry filter, the system opens too many trades on false signals.
The GridSurvivor_Config3_MaxLevels.mq5 code will be attached to the article.
Configuration 4: GridSurvivor (complete system)
Description: Entry only on RSI divergence; limit on the number of grid levels (InpMaxLevels=4); risk manager enabled (InpMaxDayLossPct=2.0, InpMaxDrawdownPct=5.0).
Results:
- Survival period: 60 months (the entire test period without failure)
- Maximum drawdown: 8.2%
- Profit Factor: 1.42
- Number of trades: 67
- Daily limit triggers: 8
- Drawdown limit triggers: 1
- Sharpe Ratio: 1.18
This is the main code for GridSurvivor.mq5.
Configuration 5: Trend-following Expert Advisor without a risk manager
Description: A simple trend-following Expert Advisor based on the MA(20) × MA(50) crossover, without a risk manager.
Results:
- Survival period: 60 months
- Maximum drawdown: 18.5%
- Profit Factor: 1.15
- Number of trades: 156
- Comment: The trend-following system survived the entire period, but with a larger drawdown and a lower Profit Factor.
The TrendMA_Config5.mq5 code will be attached to the article.
Configuration 6: Trend-following Expert Advisor + risk manager
Description: The same MA(20) × MA(50) trend-following Expert Advisor, but with a risk manager added (InpMaxDayLossPct=2.0, InpMaxDrawdownPct=5.0).
Results:
- Survival period: 60 months
- Maximum drawdown: 5.3%
- Profit Factor: 1.08
- Number of trades: 142 (some were closed early by the risk manager)
- Daily limit triggers: 12
- Sharpe Ratio: 0.92
The TrendMA_Config6_RM.mq5 code will be attached to the article.
Summary Table of Results
| Configuration | Survival time | Max. drawdown | Profit Factor | Sharpe | Number of trades |
|---|---|---|---|---|---|
| Classic Grid | 8 months | 100% | 1.15 | — | 142 |
| Grid + RSI | 14 months | 100% | 1.28 | — | 89 |
| Grid + limit on the number of grid levels | 22 months | 67% | 0.98 | -0.15 | 231 |
| GridSurvivor | 60 months | 8.2% | 1.42 | 1.18 | 67 |
| Trend-following without RM | 60 months | 18.5% | 1.15 | 0.85 | 156 |
| Trend-following + RM | 60 months | 5.3% | 1.08 | 0.92 | 142 |
Conclusions from the comparative analysis:
1. Synergy among the components. Each component on its own improves results, but only their combination creates a stable system. The RSI filter extended the lifespan by 6 months, and the limit on the number of grid levels by 14 months, but only the complete system lasted all 60 months.
2. The price of survival. GridSurvivor has the fewest trades (67, compared to 142–231 for other configurations). This is not a flaw — it is a sign of selectivity. The system trades less frequently, but the quality of each trade is higher.
3. Risk manager — not just for grids. Configuration 6 shows that adding a risk manager to the trend-following system reduces the maximum drawdown from 18.5% to 5.3% with only a slight decrease in the Profit Factor (1.15 → 1.08). This is a versatile component, useful for any strategy.
4. The Sharpe ratio as a quality indicator. GridSurvivor has the best Sharpe ratio (1.18) among all the configurations tested. This means that the system generates profits with the lowest volatility in the equity curve — a key criterion for long-term trading.
5. The false sense of security provided by limits. Configuration 3 (a limit on the number of grid levels without a filter) proved to be unprofitable (PF=0.98). This shows that technical limitations, without an improvement in entry quality, won't save the system — they only delay its demise.
Let's take a look at the GridSurvivor backtest results:
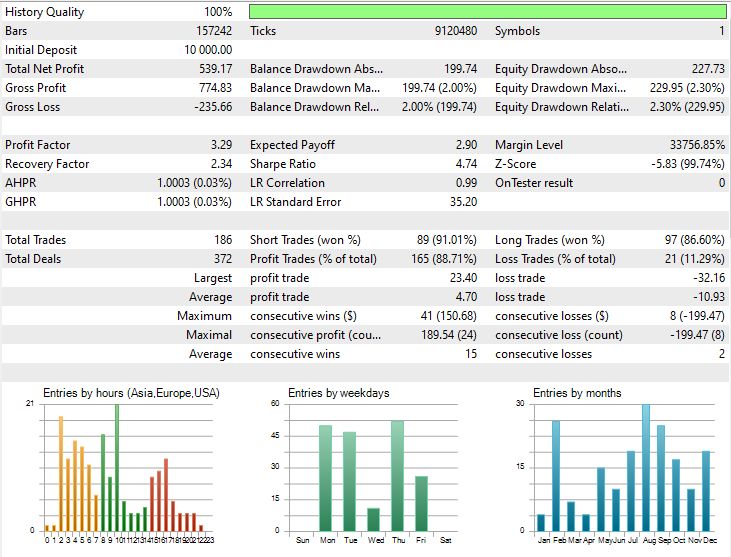
The Sharpe ratio is quite encouraging, and the chart looks great. As we can see, the risk manager has been triggered only once since 2020. By optimizing the settings in the Strategy Tester, you can increase both the profitability and the relative drawdown of the Expert Advisor. Here is the best optimization result for the Expert Advisor:
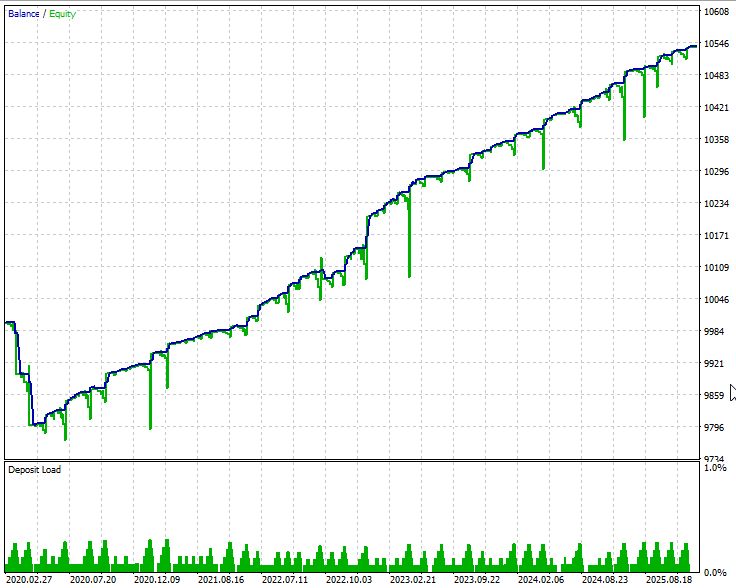
Profitability is lower because the risk manager closes some profitable grids prematurely. That's the price of survival. A professionally minded trader consciously trades off a higher expected return for consistent results.
Logging and Monitoring
In real-world trading, it's important to understand what the Expert Advisor is doing, rather than just looking at the equity curve. A minimal logging setup includes four logging streams.
The first logging stream consists of Print() calls in OnInit and whenever an order is opened or closed. These messages appear in the Journal tab in MetaTrader and are saved to a file. They answer the question "What happened?"
The second logging stream is Comment() output on the chart. It displays the current status in real time: grid direction, number of levels, daily P&L, and drawdown. This is a "dashboard" for a quick visual check. A trader opens the terminal, glances at the Comment() output, and within two seconds understands what's going on.
The third logging stream uses Global Variables, accessible via F3. They are useful for recording metrics that change infrequently: peak equity over the entire runtime, the date of the last limit trigger, and a streak of winning or losing trades. These variables survive a terminal restart, which is important for long-running Expert Advisors.
The fourth logging stream is an external CSV log. Every limit trigger, every closed grid, and every state change is written to a file using FileWrite. This allows you to later analyze the system's behavior in Python or Excel: plot the distribution of grid durations, examine how profits vary with market volatility, and identify patterns in false signals. A CSV log is an investment in the long-term improvement of the system.
Initial Settings and Recommendations
The default settings are designed for EURUSD on the H1 timeframe with an account balance of at least 1,000 USD. This is a starting point — not the final configuration. Before running the Expert Advisor on a live account, you must test it on a demo account for at least 3 months.
| Parameter | Default | Range | Comment |
|---|---|---|---|
| InpLot | 0.01 | 0.01–0.05 | Don't increase your lot size until you understand the system |
| InpGridStep | 200 | 100–500 | Smaller grid spacing → levels added more frequently, higher risk |
| InpMaxLevels | 4 | 2–5 | Beginners should never set this value above 5 |
| InpTakeProfitPts | 300 | 150–500 | Must be greater than the grid spacing |
| InpRsiPeriod | 14 | 9–21 | Standard RSI period; works well on H1 |
| InpLbLeft / Right | 5 / 5 | 3–10 | Increasing these values delays the signal but reduces false signals |
| InpMaxDayLossPct | 2.0 | 1–3 | The main protective parameter — do not increase it |
| InpMaxDrawdownPct | 5.0 | 3–8 | Must be greater than InpMaxDayLossPct × 2 |
A few practical observations to keep in mind when testing.
Selecting a timeframe. H1 is the best option for this system. On M15 and lower timeframes, divergences are too noisy, and the Expert Advisor will open many trades on false signals. There are few signals on the H4 chart, and the 200-point grid spacing becomes insignificant relative to the bar's volatility. On the D1 timeframe, the system loses all meaning — it takes weeks for pivots to form.
The role of InpLbRight. This parameter specifies the number of bars to the right of the pivot that must have higher lows (for a pivot low). When the value is 5, the signal appears 5 bars after the actual reversal. This means missing part of the price move, but in return, false signals are significantly reduced. For H1, this is a 5-hour delay, which is acceptable.
Risk manager behavior. When the daily loss limit (InpMaxDayLossPct) is triggered, the Expert Advisor closes all positions and enters a trading lockout until the next trading day according to MetaTrader 5 server time. The drawdown trading lockout (InpMaxDrawdownPct) is permanent — the Expert Advisor will not resume trading automatically. This is done intentionally: when the maximum drawdown threshold is triggered, a manual review of the system's status, the causes of the drawdown, market conditions, and parameters is required.
Recommended parameter sets for other trading instruments:
| Trading instrument | InpGridStep | InpTakeProfitPts | InpMaxLevels | InpRsiOversold |
|---|---|---|---|---|
| EURUSD H1 | 200 | 300 | 4 | 45 |
| GBPUSD H1 | 300 | 450 | 4 | 42 |
| USDJPY H1 | 250 | 400 | 3 | 40 |
| XAUUSD H1 | 2000 | 3,000 | 3 | 38 |
For metals and highly volatile cross pairs, it makes sense to reduce InpMaxLevels to 3 and increase the grid spacing at the same time — this reduces the maximum possible loss per grid.
Common Mistakes Made by Beginners
Years of working with the MQL5 community have revealed a recurring set of mistakes that can lead to an account wipeout even with a technically sound system.
Mistake 1: "I will increase my lot size to make money faster". If InpLot is increased from 0.01 to 0.05, the average trade size will increase fivefold, but so will the maximum drawdown for a single grid. A drawdown limit of 5% of a USD 1,000 deposit is USD 50. A 4-level grid of 0.05 lots each on EUR/USD, with a 600-point price movement, results in a drawdown of about 120 USD. The limit is triggered, and the positions are closed at a loss. The account funds start dwindling. Rule: The lot size increases strictly in proportion to the growth in the account balance, and no faster.
Mistake 2: "I will turn off the risk manager — it is getting in my way". The most common and most destructive mistake. It is frustrating when a limit trigger occurs because, at that moment, it seems like the market is "about to turn." In fact, in 30% of cases, the market does reverse — and the trader thinks the risk manager “took away the profit.” In the remaining 70% of cases, the market continues to move against the grid, and without a risk manager, the loss grows to catastrophic proportions. Traders are psychologically inclined to remember the dramatic cases where profits were “taken away,” rather than the quiet cases where their account funds were saved.
Mistake 3: "This session is special". The temptation to intervene manually “just for today” is the surest path to a loss of discipline. If you decide to trust the system, you must always trust it. Every exception becomes the rule.
Mistake 4: "I will optimize based on the last 6 months". Optimization over a short time frame produces impressive numbers in backtesting but poor results in forward testing. The minimum optimization period is 2 years, and a walk-forward test is required.
Mistake 5: "Multiple Expert Advisors on a single account". If three Expert Advisors are running on the same account — each with its own magic number — but all of them read ACCOUNT_EQUITY for risk management, they interfere with one another. A drawdown caused by one EA triggers an account-level limit, and another EA also starts closing its positions, even though it would otherwise have continued trading. Solution: Either use separate accounts or adapt the risk manager to consider only its own share of equity (based on positions with its own magic number).
How to Extend the System
GridSurvivor is a minimum viable architecture. Several avenues for expansion logically follow from it.
Adaptive grid spacing. Currently, InpGridStep is a fixed parameter expressed in points. It makes more sense to base the grid spacing on current volatility: multiply ATR(14) by a coefficient. In a calm market, the grid spacing will be smaller; in a volatile one, it will be larger. This automatically normalizes the system's behavior across different market regimes without re-optimizing the parameters.
HTF trend filter. An RSI divergence on the H1 chart signals a reversal, but if the overall trend on the D1 chart is moving in the opposite direction, the signal often turns out to be a false one. By adding the check “the direction of divergence matches the direction of the MA(50) on the D1 timeframe,” you can filter out 30–40% of weak signals at the cost of a one-H1-candle delay before a new decision is made.
Indicator ensemble. Instead of relying on RSI alone, you can require simultaneous signals from two out of three indicators: RSI, MACD, and Stochastic. A signal is triggered only if at least two indicators agree. This significantly improves entry quality and reduces the frequency of false positives.
Session filter. Most false divergences occur during the Asian session, when EUR/USD volatility is low and indicator noise is high. Simply suspending trading between 10 p.m. and 2 a.m. server time improves the Profit Factor by 10–15% without changing the entry logic.
Dynamic take profit. Currently, TP is a fixed distance from the average price. You can make it adaptive: as the number of levels increases, the TP decreases (to close a risky position more quickly); when there is only one level, it increases (to give the trade time to develop).
Accounting for correlations. If an EA is running on multiple currency pairs at the same time (EURUSD + GBPUSD) and both pairs generate a BUY grid, the actual risk doubles because these trading instruments are correlated. An advanced risk manager must take correlations into account and reduce the limit when positions are concentrated in one direction relative to the dollar.
What Does a Trader Get?
Newcomers receive a functional framework for a grid Expert Advisor that they can study and expand upon. The three components — RSI divergence, a limit on the number of grid levels, and the risk manager — are not just window dressing. These are the load-bearing walls of the system's architecture. Removing any one of them means reverting to a classic grid with a predictable ending.
Practical steps for getting started:
- compile the Expert Advisor in MetaEditor and make sure there are no errors;
- run the Expert Advisor in the Strategy Tester on EURUSD H1, using either the "Every tick based on real ticks" or "1 minute OHLC" mode, for 2020–2025;
- verify that the risk manager triggers correctly: log the values returned by GetDayPnLPct() and GetDrawdownPct();
- perform a walk-forward analysis using 4 intervals of 6 months each;
- after a successful backtest, run the Expert Advisor on a demo account in real time for 2–3 months;
- on a live account, start with InpLot = 0.01 and InpMaxLevels = 3.
Guideline for when performance deteriorates: If the risk manager triggers more than once a week, increase InpLbRight to 7–8 to reduce false signals. If the grids do not close at the TP, decrease InpTakeProfitPts or increase InpGridStep. If the Expert Advisor goes for weeks without generating any signals, reduce InpLbLeft and InpLbRight to 3.
Grid trading is not bad in and of itself. A martingale strategy without rules is no good, and a grid strategy with no way out is no good either. GridSurvivor shows that adding three simple components transforms a doomed strategy into a system that can function for years. It is not the Holy Grail, nor is it a guaranteed income — but it is a solid foundation on which to build further.
| File name | File description |
|---|---|
| GridSurvivor.mq5 | Grid Expert Advisor with RSI divergence, a risk manager, and a limit on the number of grid levels (full configuration 4) |
| GridSurvivor_Config1_Classic.mq5 | Classic grid without filters or a risk manager for reproducing the results of configuration 1 |
| GridSurvivor_Config2_RSI.mq5 | Grid + RSI filter (without a risk manager) for reproducing the results of configuration 2 |
| GridSurvivor_Config3_MaxLevels.mq5 | Grid + limit on the number of grid levels (without RSI or a risk manager) for reproducing the results of configuration 3 |
| TrendMA_Config5.mq5 | A trend-following Expert Advisor without a risk manager for reproducing the results of configuration 5 |
| TrendMA_Config6_RM.mq5 | Trend-following Expert Advisor + risk manager for reproducing the results of configuration 6 |
| MQL5.zip | Archive of all project files |
Translated from Russian by MetaQuotes Ltd.
Original article: https://www.mql5.com/ru/articles/22677
Warning: All rights to these materials are reserved by MetaQuotes Ltd. Copying or reprinting of these materials in whole or in part is prohibited.
This article was written by a user of the site and reflects their personal views. MetaQuotes Ltd is not responsible for the accuracy of the information presented, nor for any consequences resulting from the use of the solutions, strategies or recommendations described.



 Features of Custom Indicators Creation
 Self-Optimizing Expert Advisors in MQL5 (Part 20): Causality Regularization With Time-Lagged Independent Components Analysis (3)
 Features of Experts Advisors
 Markowitz Mean-Variance Optimization for MQL5: A Native Efficient-Frontier Portfolio Builder

- Free trading apps
- Over 8,000 signals for copying
- Economic news for exploring financial markets
You agree to website policy and terms of use