

Price Action Analysis Toolkit Development (Part 84): Validating Recorded Double-Bottom Samples
 208
208
 0
0

Contents
- Introduction
- Understanding structural validation
- System architecture
- MQL5 Implementation
- Installing and operating the validator
- Testing
- Practical value for traders and developers
- Next steps
- Conclusion
- Attachments
Introduction
A trader can recognize a W-shaped movement quickly, but visual judgement alone does not identify the exact lows, neckline, symmetry or confirmation candle. Similar charts may therefore receive different labels. A developer faces the related problem that code cannot use close-enough; it needs indices, prices, thresholds and an explicit result.
The recorder created previously supplied common ground. It preserved a selected candle sequence, its derived geometry and normalized prices in CSV format. However, placement in the double-bottom folder still represented the trader's hypothesis rather than proof that the sample met a measurable definition.
Part 84 challenges that label. The trader receives a consistent structural assessment, while the developer receives a deterministic rule engine that can be inspected and extended. Instead of returning only true or false, the validator reports key measurements: the two lows, the neckline, separation, depth, low difference, symmetry, recovery, the decisive event, and the conformity score for the selected accepted pair. When no pair passes, the panel displays a general rejection reason.
By the end, a stored sample can be classified as INVALID, CANDIDATE, CONFIRMED or FAILED. The validation module uses configurable settings and remains independent of chart drawing and file writing. Its scope is structural analysis, not a trade signal, profitability estimate or automatic scan of the complete chart.
Understanding structural validation
A recorded label becomes a testable hypothesis
Manual selection still captures the trader's observation, but the program now treats "double bottom" as a hypothesis. It asks whether the sample contains two separated swing lows, a meaningful recovery, comparable low prices, a reasonably positioned neckline and a decisive close after the second low.
The formulas allow a rejection to be investigated numerically. The panel reports a general reason when no pair passes; it does not list each rejected pair or its failed thresholds. The detailed low-difference calculation in the testing section is a separate examination of the CSV. A developer can change a threshold and evaluate the same sample again.
The validator evaluates one stored SPatternSample, not the complete chart. The selected interval must therefore contain enough neighboring candles for both pivots and must extend beyond the second low if confirmation or failure is to be observed.
Finding local swing lows
A double bottom needs distinct lows, not merely the two smallest prices, which could belong to adjacent candles in one decline. With the default pivot strength of two, each candidate is compared with two candles on either side. It cannot be higher than those neighbors and must be strictly lower than at least one candle on each side.
Qualifying lows within one pivot-strength window are consolidated by retaining the lower candle. A smaller strength detects short turns but admits more noise; a larger value requires broader structure and more surrounding candles.
Evaluating possible pairs
A sample may contain several swing lows, so the validator evaluates each chronological pair of distinct swing lows instead of assuming that the first two are correct. The default minimum separation is five bars. For every surviving pair, the highest high between the lows becomes the neckline; exactly equal highs are resolved by choosing the candle nearest the pair's midpoint. Equally central highs retain the earlier candle. Equality uses the stored values without a tick-size tolerance, so near-equal highs are treated as different prices.
The average low provides the base of the structure, and depth measures the recovery to the neckline:
average low = (first low + second low) / 2
pattern depth = neckline price - average low
depth percent = pattern depth / reference close * 100
The reference is the first recorded close. The default minimum depth of 0.05 percent rejects pairs below that configured recovery threshold. This is a research setting, not an empirically established boundary between meaningful and insignificant movement.
Similarity between the lows is measured relative to pattern depth:
low difference percent = abs(first low - second low) / pattern depth * 100
By default, the low-price difference may not exceed 20 percent of depth. A higher intervening neckline increases depth and makes the same absolute low gap easier to accept. The metric is therefore a depth-relative similarity rule, not an independent measure of low equality. Changing the reference close affects depth percent but does not directly change this low-difference ratio. Neither comparison adjusts for tick size or spread.
Temporal balance is measured around the neckline. The program counts bars from the first low to the neckline and from the neckline to the second low, then divides the shorter side by the longer side:
symmetry percent = shorter side / longer side * 100
A centered neckline produces 100 percent. The default minimum of 40 percent permits visible imbalance while rejecting a peak positioned almost against one low.
Recovery and the first decisive close
After a pair passes the mandatory rules, recovery uses the highest close from the second-low candle through the end of the sample. It measures that close above the average low, divides by pattern depth and clamps the percentage between zero and one hundred. The scan includes candles after a decisive event, so even a FAILED pair can have high recovery.
Classification uses the first decisive close. The breakout level is the neckline plus an optional fraction of depth; the failure level is below the lower low by the configured tolerance. A breakout first produces CONFIRMED, failure first produces FAILED, and no decisive close leaves a CANDIDATE. INVALID means that no pair passed the mandatory structural rules or the input could not be evaluated. It does not by itself mean that recording failed. CONFIRMED records the first close above the configured breakout level; it does not rule out a later false breakout. Once a decisive event is found, later events do not change that pair's status.
Interpreting the structural score
Every accepted pair receives a score from zero to one hundred: similarity contributes 35 percent, symmetry 25 percent, depth quality 20 percent and recovery 20 percent. The score selects the highest-scoring accepted pair under these chosen weights. Status has no selection priority: a higher-scoring CANDIDATE or FAILED pair can be selected instead of a lower-scoring CONFIRMED pair. Equal scores retain the first pair encountered, favouring the earlier first low and then the earlier second low. The weights have not been calibrated to recognition accuracy or trading outcomes. The score expresses conformity to this formula, not confidence or probability of profit.
System architecture
Part 84 adds one module and extends two integration points. DoubleBottomValidator.mqh owns the validation settings, result structure and rule engine. PatternRecorderPanel.mqh gains a validation button and a result area. DoubleBottomRecorderEA.mq5 exposes the thresholds as inputs, verifies them during initialization and passes them to the panel.
The data, extraction, storage and library modules retain their existing responsibilities. In particular, validation does not call SaveSampleToFile() and does not add columns to the recorded CSV. The panel obtains a copy of the selected SPatternSample, passes that copy to the validator and displays the returned measurements. This boundary preserves the raw observation and allows the same sample to be evaluated under different settings.
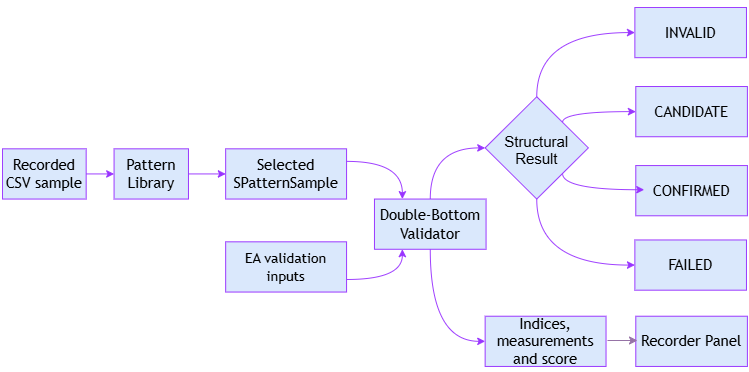
Figure 1. A stored sample and the configured rules enter the validator; the panel receives an explainable status without modifying the source CSV.
This arrangement is useful beyond the current pattern. A future scanner can call the validator without chart UI elements. A test script can supply synthetic samples without opening files. The panel remains an interface controller, the library remains an owner of samples and the validator remains responsible for pattern logic. Each layer can change without absorbing the responsibilities of the others.
MQL5 implementation
The completed project contains seven source files. The following excerpts show the central additions; the attached package contains the complete compile-ready implementation.
1. Validation contracts
The status enumeration separates rejection from the three states that can follow an accepted pair. Settings travel together through the EA, panel and validator, while the result records both classification and evidence.
//--- Describes the structural state assigned to a recorded sample
enum ENUM_DOUBLE_BOTTOM_STATUS
  {
   DOUBLE_BOTTOM_INVALID = 0,
   DOUBLE_BOTTOM_CANDIDATE,
   DOUBLE_BOTTOM_CONFIRMED,
   DOUBLE_BOTTOM_FAILED
  };

//--- Stores the configurable rules used by the validator
struct SDoubleBottomSettings
  {
   int               pivot_strength;
   int               min_low_separation;
   double            max_low_difference_pct;
   double            min_depth_pct;
   double            min_symmetry_pct;
   double            breakout_buffer_pct;
   double            failure_tolerance_pct;
  };

//--- Stores the selected structure and its calculated measurements
struct SDoubleBottomValidation
  {
   ENUM_DOUBLE_BOTTOM_STATUS status;
   int               first_low_index;
   int               second_low_index;
   int               neckline_index;
   int               breakout_index;
   int               failure_index;
   int               separation_bars;
   double            first_low_price;
   double            second_low_price;
   double            neckline_price;
   double            pattern_depth;
   double            depth_pct;
   double            low_difference_pct;
   double            symmetry_pct;
   double            recovery_pct;
   double            score;
   string            reason;
  }
Indices begin at -1 because zero is a valid candle. Candidates have no decisive index; confirmed and failed results populate breakout_index or failure_index. InitDoubleBottomValidation() resets every field, ensuring that early returns still produce predictable data and a readable reason.
2. Configurable rules and input validation
The EA publishes seven structural inputs. They are research parameters rather than optimized trading parameters.
| Input | Default | Purpose |
|---|---|---|
| Input_PivotStrength | 2 | Number of neighboring candles examined on each side of a pivot |
| Input_MinLowSeparation | 5 | Minimum index distance between the two lows |
| Input_MaxLowDifferencePct | 20.0 | Maximum low difference as a percentage of pattern depth |
| Input_MinPatternDepthPct | 0.05 | Minimum neckline depth as a percentage of reference price |
| Input_MinSymmetryPct | 40.0 | Minimum temporal balance around the neckline |
| Input_BreakoutBufferPct | 0.0 | Additional breakout distance as a percentage of depth |
| Input_FailureTolerancePct | 10.0 | Distance below the lower low, expressed as a percentage of pattern depth. |
Settings are checked before creating the library or panel. Pivot strength must be between 1 and 100,000, separation between 2 and 100,000, magnitude thresholds must be positive, symmetry must be between 0 and 100, and tolerances must be non-negative. All floating-point settings must be finite. Invalid values return INIT_PARAMETERS_INCORRECT.
//--- Build and verify the validation settings before creating objects
   InitDoubleBottomSettings(g_validation_settings,
                            Input_PivotStrength,
                            Input_MinLowSeparation,
                            Input_MaxLowDifferencePct,
                            Input_MinPatternDepthPct,
                            Input_MinSymmetryPct,
                            Input_BreakoutBufferPct,
                            Input_FailureTolerancePct);
   string settings_error;
   if(!CheckDoubleBottomSettings(g_validation_settings, settings_error))
     {
      Print("Invalid validation settings: ", settings_error);
      return(INIT_PARAMETERS_INCORRECT);
     }
The structure also permits several configurations to be applied to the same unchanged sample.
3. Detecting and consolidating swing lows
IsValidationSwingLow() rejects a candidate when a lower neighbor exists. Two flags require at least one strictly higher candle on each side.//+------------------------------------------------------------------+ //| Check whether one candle is a local swing low | //+------------------------------------------------------------------+ bool IsValidationSwingLow(const SPatternSample &sample, const int index, const int strength) { bool lower_on_left = false; bool lower_on_right = false; double candidate_low = sample.candles[index].low; //--- Compare the candidate with the same number of candles per side for(int offset = 1; offset <= strength; offset++) { double left_low = sample.candles[index - offset].low; double right_low = sample.candles[index + offset].low; if(candidate_low > left_low || candidate_low > right_low) return(false); if(candidate_low < left_low) lower_on_left = true; if(candidate_low < right_low) lower_on_right = true; } return(lower_on_left && lower_on_right); }
The collector stays inside safe neighbor boundaries and consolidates compact clusters before pair evaluation.
      int count = ArraySize(indices);
      if(count > 0 && i - indices[count - 1] <= strength)
        {
         //--- Retain only the lower candle from a compact low cluster
         if(sample.candles[i].low < sample.candles[indices[count - 1]].low)
            indices[count - 1] = i;
         continue;
        }
      ArrayResize(indices, count + 1);
      indices[count] = i;
A flat low can be missed when its window contains no strictly higher candle on one side. Consolidation retains the earlier candle when lows are exactly equal. This is a fixed pivot convention; plateau-aware and volatility-adaptive pivots remain possible extensions.
4. Locating the neckline and applying mandatory filters
For each pair, FindValidationNeckline() selects the highest intervening high, preferring the position nearest the midpoint when highs are equal. EvaluateDoubleBottomPair() then applies mandatory depth, low-difference and symmetry rules. Pairs rejected by mandatory filters are not scored. An accepted pair that later receives FAILED still has a score.
//--- Apply the mandatory depth, similarity and symmetry rules
   double depth_pct = depth / reference * 100.0;
   double low_difference_pct = MathAbs(first_price - second_price) /
                               depth * 100.0;
   int left_bars = neckline - first_low;
   int right_bars = second_low - neckline;
   int longer_side = left_bars;
   if(right_bars > longer_side)
      longer_side = right_bars;
   int shorter_side = left_bars;
   if(right_bars < shorter_side)
      shorter_side = right_bars;
   double symmetry_pct = (double)shorter_side / longer_side * 100.0;

   if(depth_pct < settings.min_depth_pct ||
      low_difference_pct > settings.max_low_difference_pct ||
      symmetry_pct < settings.min_symmetry_pct)
      return(false);
Depth percent always uses sample.candles[0].close. No alternate normalization reference or fallback is used.
5. Scoring accepted structures
Only accepted pairs are scored; strong recovery cannot rescue a mandatory-rule failure.
//+------------------------------------------------------------------+
//| Calculate a weighted conformity score for one accepted pair      |
//+------------------------------------------------------------------+
double CalculateDoubleBottomScore(const SDoubleBottomSettings &settings,
                                  const double low_difference_pct,
                                  const double depth_pct,
                                  const double symmetry_pct,
                                  const double recovery_pct)
  {
   double similarity = 100.0 - low_difference_pct /
                       settings.max_low_difference_pct * 100.0;
   similarity = ClampValidationPercent(similarity);
   double depth_quality = depth_pct / settings.min_depth_pct * 50.0;
   depth_quality = ClampValidationPercent(depth_quality);
   double recovery = ClampValidationPercent(recovery_pct);

//--- Weight similarity most heavily while retaining shape and recovery
   double score = similarity * 0.35 + symmetry_pct * 0.25 +
                  depth_quality * 0.20 + recovery * 0.20;
   return(ClampValidationPercent(score));
  }
Depth quality is 50 at the minimum permitted depth and reaches 100 at twice that depth; larger values remain capped at 100. Similarity contributes zero at the maximum permitted low difference and 100 when the lows are equal. The explicit weights can be revised without changing pivot detection, persistence or the panel.
6. Assigning candidate, confirmed and failed states
An accepted pair begins as a candidate. Breakout and failure levels derive from depth, and the first decisive close sets the final state.
//--- Classify the first decisive close after the second low
   double breakout_level = neckline_price +
                           depth * settings.breakout_buffer_pct / 100.0;
   double lower_low = MathMin(first_price, second_price);
   double failure_level = lower_low -
                          depth * settings.failure_tolerance_pct / 100.0;
   for(int i = second_low + 1; i < sample.bars; i++)
     {
      if(sample.candles[i].close > breakout_level)
        {
         result.status = DOUBLE_BOTTOM_CONFIRMED;
         result.breakout_index = i;
         result.reason = "A candle closed above the neckline before invalidation.";
         break;
        }
      if(sample.candles[i].close < failure_level)
        {
         result.status = DOUBLE_BOTTOM_FAILED;
         result.failure_index = i;
         result.reason = "A candle closed below the failure level before breakout.";
         break;
        }
     }
An upward reaction alone is not confirmation, while a brief wick below a low is not automatically failure.
7. Selecting the highest-scoring accepted pair
ValidateDoubleBottom() checks sample completeness, gathers swing lows and retains the highest-scoring accepted pair.
//--- Compare chronological pairs and retain the highest score
   bool found = false;
   for(int first = 0; first < swing_count - 1; first++)
     {
      for(int second = first + 1; second < swing_count; second++)
        {
         SDoubleBottomValidation candidate;
         if(!EvaluateDoubleBottomPair(sample, settings,
                                      swing_lows[first], swing_lows[second],
                                      candidate))
            continue;
         if(!found || candidate.score > result.score)
           {
            result = candidate;
            found = true;
           }
        }
     }
Exhaustive evaluation suits short recorded samples. A future real-time scanner may require candidate pruning and incremental processing.
8. Connecting validation to the panel
The panel adds VALIDATE SELECTED and a multi-line result area. The trader opens the sample list, selects an existing ID and requests validation. OnValidateSample() retrieves a copy from the library; no storage function is called.
//+------------------------------------------------------------------+
//| Validates the sample selected in the panel                       |
//+------------------------------------------------------------------+
void CRecorderPanel::OnValidateSample()
  {
   if(m_selected_sample_id == 0)
     {
      ShowStatus("No sample selected. Click a sample in the list first.", true);
      return;
     }

//--- Copy the stored sample without altering its original CSV record
   SPatternSample sample;
   if(!m_library.GetSample(m_selected_sample_id, sample))
     {
      ShowStatus("Selected sample could not be loaded from the library.", true);
      return;
     }

//--- Apply the configured structural rules and display every outcome
   SDoubleBottomValidation result;
   bool structurally_valid = ValidateDoubleBottom(sample,
                                                   m_validation_settings,
                                                   result);
   ShowValidationResult(m_selected_sample_id, result);
   string status = DoubleBottomStatusToString(result.status);
   if(structurally_valid)
      ShowStatus("Sample #" + IntegerToString(m_selected_sample_id) +
                 " validation: " + status + ".", false);
   else
      ShowStatus("Sample #" + IntegerToString(m_selected_sample_id) +
                 " validation: INVALID.", true);
   ChartRedraw(m_chart_id);
  }
The panel shows score, indices, separation, neckline, depth, low difference, symmetry and recovery. It also reports the breakout or failure index. Confirmed text is green, candidates blue and failed or invalid results red, with the written status preserving accessibility.
9. Initializing the enhanced EA
The EA constructs g_validation_settings from its inputs and passes a copy to the panel.
There is still no OnTick(): recording and validation are user actions handled through OnChartEvent(). Automatic scanning belongs to a later stage.
Installing and operating the validator
Copy DoubleBottomRecorderEA.mq5 to MQL5\Experts\PatternRecorder and the six headers to MQL5\Include\PatternRecorder, preserving the supplied structure. Open the EA in MetaEditor and compile it.
The library uses MQL5\Files\PatternLibrary\DOUBLE_BOTTOM_CANDIDATE and the CSV format defined in Part 83. Files produced by that recorder load without conversion. The supplied SAMPLE_11.csv uses the same format. Copy it into the candidate folder only if SAMPLE_11.csv is not already present; keep existing records intact.
Attach the EA and review its inputs. To create a reference, select the formation, adjust the rectangle, enter a note and record it. Include neighboring candles around both lows and extend beyond the second low when studying confirmation.
Click VIEW SAMPLES, choose an ID and press VALIDATE SELECTED. To compare definitions, change the inputs, reinitialize the EA and validate the same unchanged sample again.
Testing
Recording and validating a sample
The test used a USDCAD M30 chart. The library initially contained nine samples. I positioned the selection rectangle over the intended interval and pressed Record. The recorder created sample #11, increased the sample count to ten and displayed the recorded boundaries.
The saved file contained 41 candles, covering 8 September 2026 at 22:00 through 9 September 2026 at 18:00. Opening View Samples showed sample #11 with the corresponding candle count.
I selected this entry and pressed Validate Selected. The panel returned CONFIRMED, identifying candle 31 as the breakout candle and displaying a score of 87.4. The result area showed the selected lows, their separation, the neckline, depth, low difference, symmetry and recovery.
During the same recording, samples #9 and #10 also returned CONFIRMED, while samples #7 and #8 returned INVALID. For the rejected records, the panel reported that swing lows had been found but no pair passed all mandatory rules. It did not identify individual failed thresholds.
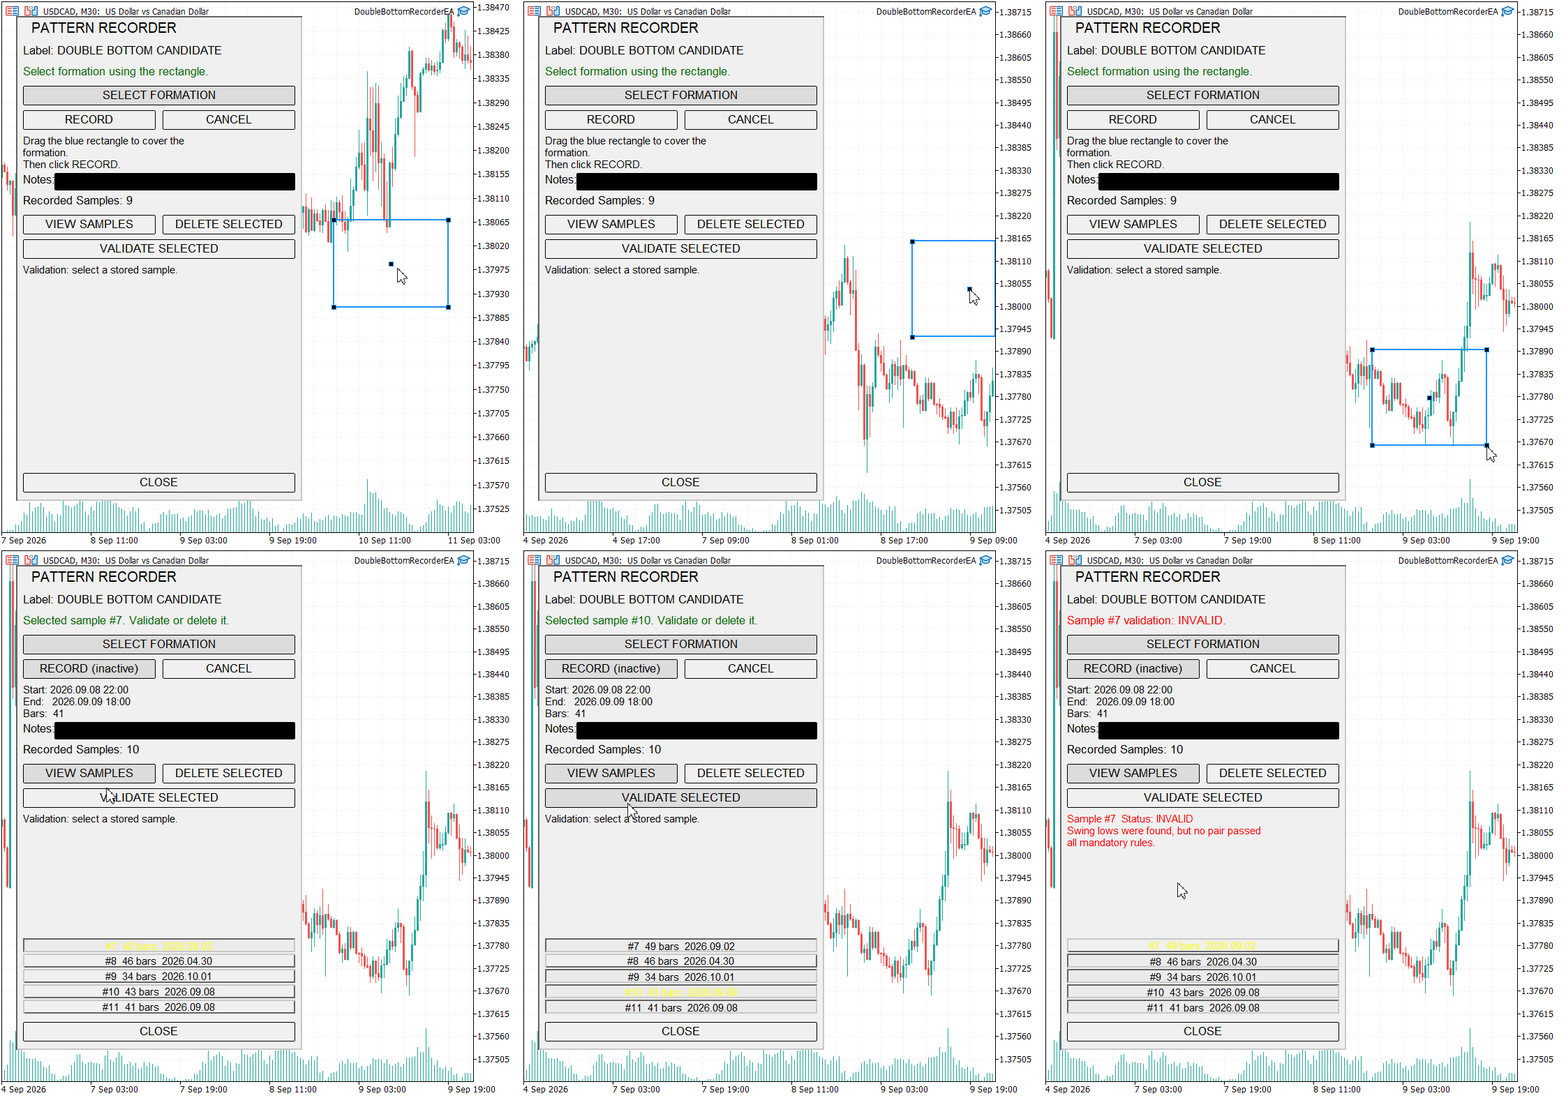
Figure 2. Recording USDCAD M30 sample #11 and reviewing validation results for stored samples.
Checking the recorded measurements
The recorder saved the new sample as:
MQL5\Files\PatternLibrary\DOUBLE_BOTTOM_CANDIDATE\SAMPLE_11.csv
The CSV identified sample #11, USDCAD, the M30 timeframe and the DOUBLE_BOTTOM_CANDIDATE category. Its candle rows were indexed from 0 to 40.
The selected structure used the following prices:
| Component | Candle index | Price |
|---|---|---|
| First low | 18 | 1.37665 |
| Second low | 28 | 1.37660 |
| Neckline | 24 | 1.37868 |
The first recorded close was 1.37824. Using this reference, the calculations were:
Average low = (1.37665 + 1.37660) / 2
= 1.376625
Pattern depth = 1.37868 - 1.376625
= 0.002055
Depth percent = 0.002055 / 1.37824 × 100
≈ 0.149103%
Low difference percent = |1.37665 - 1.37660| / 0.002055 × 100
≈ 2.433090%
The lows were ten bars apart. The neckline lay six bars after the first low and four bars before the second, giving:
Symmetry percent = 4 / 6 × 100
≈ 66.6667%
These measurements satisfied the published default thresholds:
| Measurement | Sample #11 | Default requirement |
|---|---|---|
| Low separation | 10 bars | At least 5 bars |
| Depth | 0.149103% | At least 0.05% |
| Low difference | 2.433090% | At most 20% |
| Symmetry | 66.6667% | At least 40% |
Reproducing the score and status
Using the default maximum low difference of 20%, the similarity component was approximately 87.83455. Depth quality reached its cap of 100 because the measured depth exceeded twice the minimum depth. Recovery also reached 100.
Applying the configured weights produced:
Score = 87.83455 × 0.35
+ 66.66667 × 0.25
+ 100 × 0.20
+ 100 × 0.20
≈ 87.40876
Rounded to one decimal place, this gives 87.4, matching the panel.
With a zero breakout buffer, the breakout level was the neckline price, 1.37868. The default failure tolerance placed the failure level 10% of pattern depth below the lower low:
Failure level = 1.37660 - 0.002055 × 0.10
= 1.3763945
Candle 31 supplied the first decisive close above the breakout level, before a qualifying failure close. This reproduced the displayed CONFIRMED result. The classification records that event within the selected interval; it does not establish that the breakout subsequently succeeded as a trade.
Scope of the results
The recording demonstrates sample creation, selection and validation display. The CSV calculations reproduce the reported measurements, score and confirmation event under the published defaults. This agreement checks the implementation of those formulas, rather than proving that the rules correctly identify every double bottom.
The session showed CONFIRMED and INVALID outcomes. It did not exercise CANDIDATE or FAILED, compare threshold settings, or establish performance across instruments and timeframes. The notes field was empty, so note preservation was not tested in this recording.
Practical value for traders and developers
For the trader, the validator introduces discipline without removing visual judgement. The trader still decides which market interval deserves attention, but the program applies the same measurements to every saved example. A chart that appears convincing can be rejected for unequal lows or weak symmetry, while a developing structure can remain a candidate instead of being prematurely called confirmed. Notes are saved in the sample CSV. Validation measurements and statuses are displayed temporarily; preserving them requires a separate report.
The library supports deliberate practice. Confirmed, failed and invalid examples can be compared using normalized candles and a common structural vocabulary. The collection can reveal restrictive settings, recurring shapes and characteristics shared by failures without relying on hindsight screenshots.
For the developer, ValidateDoubleBottom() receives data and settings and returns an explainable result without chart or file dependencies. It is therefore suitable for controlled tests, batch research and eventual reuse by an automatic scanner.
Configuration is explicit rather than embedded in scattered conditions. Settings can later be loaded from a profile, optimized in a controlled experiment or varied by timeframe. The pair evaluator provides a clear extension point for additional hard rules, while the scoring function can evolve independently. Because validation does not alter the raw recording, competing definitions can be compared against identical evidence.
The trader and developer participate in a shared feedback loop. Trader-selected samples reveal the variation the rules must handle. Developer measurements show where selections match or conflict with the current definition. Revised rules can then be applied to the same library to support the next discussion. Neither perspective is reduced to a supporting role: market judgement supplies relevant cases, and software engineering makes their evaluation repeatable.
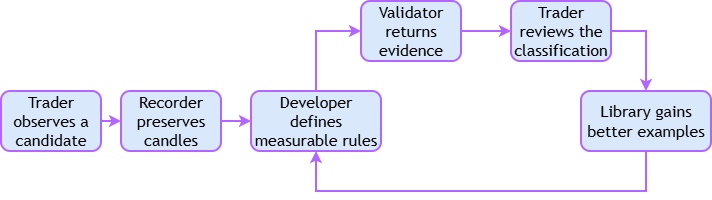
Figure 3. Trader observations and developer rules improve the sample library through repeated review.
Next steps
The validator formalizes one definition; it does not establish a universal definition of a double bottom. Pivot strength and all thresholds remain configurable assumptions. Different symbols, timeframes and volatility regimes may require different settings, and changing them can change which pair is selected.
The program evaluates only the recorded interval. It does not independently prove that a meaningful downtrend preceded the first low, and it cannot classify a breakout that lies outside the sample. The neckline is the highest high between the lows rather than a broader resistance zone. Volume, session context, spread, news conditions and higher-timeframe structure are not part of the score.
A single price spike can raise the neckline, increase depth and reduce the relative low difference. Changing the sample boundaries can remove pivot neighbours or decisive closes and alter the result. Repeatable calculations therefore do not eliminate subjectivity in sample selection.
Most importantly, structural confirmation is not trading validation. The current result says that price closed above a measured neckline before closing below a measured failure level. It does not account for entry cost, stop placement, target selection, maximum adverse excursion or subsequent return. Those require outcome fields and a separate evaluation process.
A logical next stage is to visualize the chosen lows and neckline directly on the chart and store validation reports separately from the raw samples. Once a sufficiently diverse library exists, the same validator can be run in batch to examine threshold sensitivity. Automatic chart scanning should follow only after the stored examples show that the definition behaves consistently.
Conclusion
Part 84 moves the toolkit from collection to examination. A manually assigned double-bottom label is now treated as a hypothesis that must survive explicit structural rules. The system detects local lows, evaluates every eligible pair, derives a neckline and measures depth, similarity, symmetry and recovery. It then distinguishes an unresolved candidate from confirmation or failure by inspecting the first decisive close after the second low.
The trader can review saved formations consistently, inspect accepted-pair measurements and investigate rejected samples using the documented formulas. The developer leaves with an independent validation module, configurable contracts and explainable outputs that can be tested without coupling pattern logic to the chart interface or storage layer.
The achievement is not a promise that a validated double bottom will be profitable. It is a more dependable foundation: raw observations remain preserved, definitions become measurable and decisions can be investigated against the recorded candles and thresholds. That foundation is suitable for the later work of visualization, dataset review, statistical evaluation and automatic detection.
Attachments
| Name | Type | Responsibility |
|---|---|---|
| DoubleBottomRecorderEA.mq5 | Expert Advisor | Exposes validation settings, initializes the library and panel, and forwards chart events |
| DoubleBottomValidator.mqh | Include | Detects swing lows, evaluates pairs, measures structure, scores accepted pairs and assigns status |
| PatternRecorderPanel.mqh | Include | Records samples, manages selection and displays validation results |
| PatternData.mqh | Include | Defines candle and sample structures used by recording and validation |
| PatternExtractor.mqh | Include | Extracts the rectangle's candle interval and normalizes its prices |
| PatternLibrary.mqh | Include | Owns the in-memory sample collection and coordinates persistence |
| PatternStorage.mqh | Include | Reads, writes, discovers and deletes sample CSV files |
| SAMPLE_11.csv | CSV data | Contains the complete 41-candle USDCAD M30 sample used in the validation test. Store it under MQL5\Files\PatternLibrary\DOUBLE_BOTTOM_CANDIDATE. |
| MQL5.zip | Archive | Complete project archive containing all source files arranged in the required MetaTrader 5 directory structure. Extract the archive into the terminal's Data Folder so all files are placed automatically in their correct locations. |
Warning: All rights to these materials are reserved by MetaQuotes Ltd. Copying or reprinting of these materials in whole or in part is prohibited.
This article was written by a user of the site and reflects their personal views. MetaQuotes Ltd is not responsible for the accuracy of the information presented, nor for any consequences resulting from the use of the solutions, strategies or recommendations described.

 Ollivier-Ricci Curvature: Reading the Shape of a Correlation Network, Not Its Level
 Neural Networks in Trading: Training Deep Spiking Models (SEW-ResNet)
 Harris Hawks Optimization (HHO)
 Foundation Models for Trading (Part III): Running a Generative AI Forecaster Inside MetaTrader 5

- Free trading apps
- Over 8,000 signals for copying
- Economic news for exploring financial markets
You agree to website policy and terms of use