

Foundation Models for Trading (Part III): Running a Generative AI Forecaster Inside MetaTrader 5
 88
88
 0
0

Introduction
Across Part 1 and Part 2, we built a complete native MQL5 port of Kronos and proved, stage by stage, that it reproduces the PyTorch model: exact encoder tokens, decoder and predictor logits within floating-point noise, and autoregressive generation verified through the context-sliding boundary. That answers only the easy question. Fidelity to PyTorch is not the same as forecasting skill. A faithful port of a model that cannot predict the market is still a model that cannot predict the market.
The distinction matters more than it might seem. Verification is a closed question with a right answer: either our matrices agree with the reference or they do not, and a tolerance of 1e-06 settles the argument. Forecasting skill is an open question with no reference to check against, only the market, which is happy to hand you a convincing-looking result that means nothing at all. The tools that settle the first question are useless for the second. The habits that made the port trustworthy, namely tight tolerances and exact comparisons, can also leave you overconfident when you switch to measuring value.
This part asks the hard question honestly. First, we put the model to work in the most satisfying way: an Expert Advisor that draws Kronos's forecast candles directly on the chart. This lets you watch it predict in real time. Then we stop admiring the picture and measure it. We dump forecasts across a stretch of history under strict look-ahead discipline, score them against a naive baseline, and run a deliberately simple strategy through the Strategy Tester. The result is a negative one, and reported plainly, because a negative result that is honestly arrived at is worth more than a positive one that is not.
The most useful thing the project produced is a lesson in reading a backtest. A simple rule on these forecasts ends in profit with a rising equity curve, and two plain checks, the spread of the trade results and a split of the trades by direction, show that the profit is the market's drift rather than anything the model knew.
We will cover:
- Forecasting Live on the Chart
- An Honest Evaluation and the Look-Ahead Problem
- Forecast Skill Against a Random Walk
- A Backtest That Profits Without an Edge
- The Verdict, and Why
- Conclusion
Forecasting Live on the Chart
The KronosForecast Expert Advisor attaches the model to a chart. On each new completed bar it gathers the last context window of candles, runs the full pipeline from Part 2, and paints the predicted bars to the right of the current price as forecast candles.
Inference is expensive: a full Predict at the real configuration takes seconds, which rules out running one per tick, so the Expert Advisor gates on the bar. SERIES_LASTBAR_DATE is the open time of the newest, still-forming bar, so it changes once per bar, at the moment a new bar opens and the previous one completes. The handler returns immediately while it matches the remembered value:
//+------------------------------------------------------------------+
//| Tick handler: re-forecast only when a new bar has completed.     |
//+------------------------------------------------------------------+
void OnTick()
  {
   if(!g_ready)
      return;
   datetime t = (datetime)SeriesInfoInteger(_Symbol, _Period, SERIES_LASTBAR_DATE);
   if(t == g_last_bar)
      return;        // only on a new completed bar
   g_last_bar = t;
   RunForecast();
  }
The work happens in RunForecast, which assembles the same raw window and time stamps the verification used and calls the single Predict entry point. The window build is where a detail matters more than it looks:
//--- assemble raw window oldest->newest into (L,6): open,high,low,close,vol,amount
   matrix raw = matrix::Zeros((ulong)L, KR_NFEAT);
   datetime ctx_time[];
   ArrayResize(ctx_time, L);
   for(int i = 0; i < L; i++)
     {
      int src = L - i;                // rates[L]..rates[1] -> rows 0..L-1 (oldest first)
      double o = rates[src].open, h = rates[src].high, lo = rates[src].low, c = rates[src].close;
      double vol = 0.0, amt = 0.0;
      if(InpVolMode == VOL_TICK_DERIVED)
        {
         vol = (double)rates[src].tick_volume;
         double typical = (o + h + lo + c) / 4.0;
         amt = vol * typical;
        }
      raw[i][0] = o;
      raw[i][1] = h;
      raw[i][2] = lo;
      raw[i][3] = c;
      raw[i][4] = vol;
      raw[i][5] = amt;
      ctx_time[i] = rates[src].time;
     }
The loop reads rates[L] down to rates[1], never rates[0], so the window holds closed bars only. The still-forming bar at index zero changes with every tick, and feeding it to the model would make the forecast depend on the moment you happened to look. The index reversal is deliberate too: RunForecast calls ArraySetAsSeries on rates before CopyRates fills it, so the array runs newest-first, and reading rates[L - i] puts the oldest bar in row zero, as the model expects.
The second point is volume. Two of Kronos's six features, volume and amount, do not exist in a retail FX feed, so we fill them from tick volume and a turnover of tick volume times the typical price. That turnover formula is the reference predictor's own fallback when it has volume but no amount. The problem is the volume itself: a tick count differs from exchange volume in scale and in distribution, and the per-window normalization removes only the scale. A third of the model's input therefore comes from a distribution it never saw in training, which will matter when we judge the forecast.
The stamp matrix hides a subtlety. Kronos conditions on time stamps as well as prices, and it wants one for every position, including the bars it is about to predict. Those bars have not happened, so their stamps are projected forward from the last known bar time:
//--- full stamp (L+P, 5): context times + projected future bar times
   int secs = PeriodSeconds(_Period);
   matrix full_stamp = matrix::Zeros((ulong)(L + P), 5);
   for(int i = 0; i < L; i++)
     {
      int st[];
      KronosStamp(ctx_time[i], st);     // verified: weekday remap Sun->Mon
      for(int j = 0; j < 5; j++)
         full_stamp[i][j] = st[j];
     }
   datetime last_time = ctx_time[L - 1];
   for(int i = 0; i < P; i++)
     {
      datetime ft = last_time + (datetime)((i + 1) * secs);
      int st[];
      KronosStamp(ft, st);
      for(int j = 0; j < 5; j++)
         full_stamp[L + i][j] = st[j];
     }
Projecting last_time + (i + 1) * secs assumes a fixed grid of bars, which holds inside a session and fails across a weekend or holiday. A stamp that lands on a Saturday perturbs the temporal embedding for those positions, but it does not corrupt the price history, and it is not look-ahead: future time stamps are known in advance and say nothing about future prices. The effect can also be measured. In the evaluation below, 115 of the 947 forecasts cross a weekend, and the other 832, scored on their own, are still less accurate than the no-change baseline at every horizon. The projection does not decide the result.
There is no candle object in MQL5, so the drawing routine assembles each predicted bar from two trend lines, a thin one from high to low and a thick one from open to close, with a dotted segment joining consecutive predicted closes:
//+------------------------------------------------------------------+
//| Draw predicted candles as chart objects to the right.            |
//+------------------------------------------------------------------+
void DrawForecast(const matrix &fc, datetime last_time, int secs, double last_close)
  {
   ObjectsDeleteAll(0, KR_OBJ_PREFIX);
   int P = (int)fc.Rows();
   double prev_close = last_close;

   for(int i = 0; i < P; i++)
     {
      datetime t  = last_time + (datetime)((i + 1) * secs);
      double o = fc[i][0], h = fc[i][1], lo = fc[i][2], c = fc[i][3];
      color col = (c >= o) ? InpUpColor : InpDownColor;

      //--- wick: high-low vertical line
      string wick = StringFormat("%swick_%d", KR_OBJ_PREFIX, i);
      ObjectCreate(0, wick, OBJ_TREND, 0, t, h, t, lo);
      ObjectSetInteger(0, wick, OBJPROP_COLOR, col);
      ObjectSetInteger(0, wick, OBJPROP_WIDTH, 1);
      ObjectSetInteger(0, wick, OBJPROP_RAY, false);

      //--- body: thick open-close line
      string body = StringFormat("%sbody_%d", KR_OBJ_PREFIX, i);
      ObjectCreate(0, body, OBJ_TREND, 0, t, o, t, c);
      ObjectSetInteger(0, body, OBJPROP_COLOR, col);
      ObjectSetInteger(0, body, OBJPROP_WIDTH, 4);
      ObjectSetInteger(0, body, OBJPROP_RAY, false);

      //--- connector close[i-1] -> close[i] (dotted path)
      string seg = StringFormat("%sseg_%d", KR_OBJ_PREFIX, i);
      datetime t0 = last_time + (datetime)(i * secs);
      ObjectCreate(0, seg, OBJ_TREND, 0, t0, prev_close, t, c);
      ObjectSetInteger(0, seg, OBJPROP_COLOR, clrSilver);
      ObjectSetInteger(0, seg, OBJPROP_STYLE, STYLE_DOT);
      ObjectSetInteger(0, seg, OBJPROP_RAY, false);
      prev_close = c;
     }
Every object carries the KronosFC_ prefix, which makes the routine's first line safe: ObjectsDeleteAll with that prefix clears the previous forecast without touching anything else on the chart, and OnDeinit clears it the same way. Setting OBJPROP_RAY to false keeps each trend line a finite segment rather than the default infinite ray.
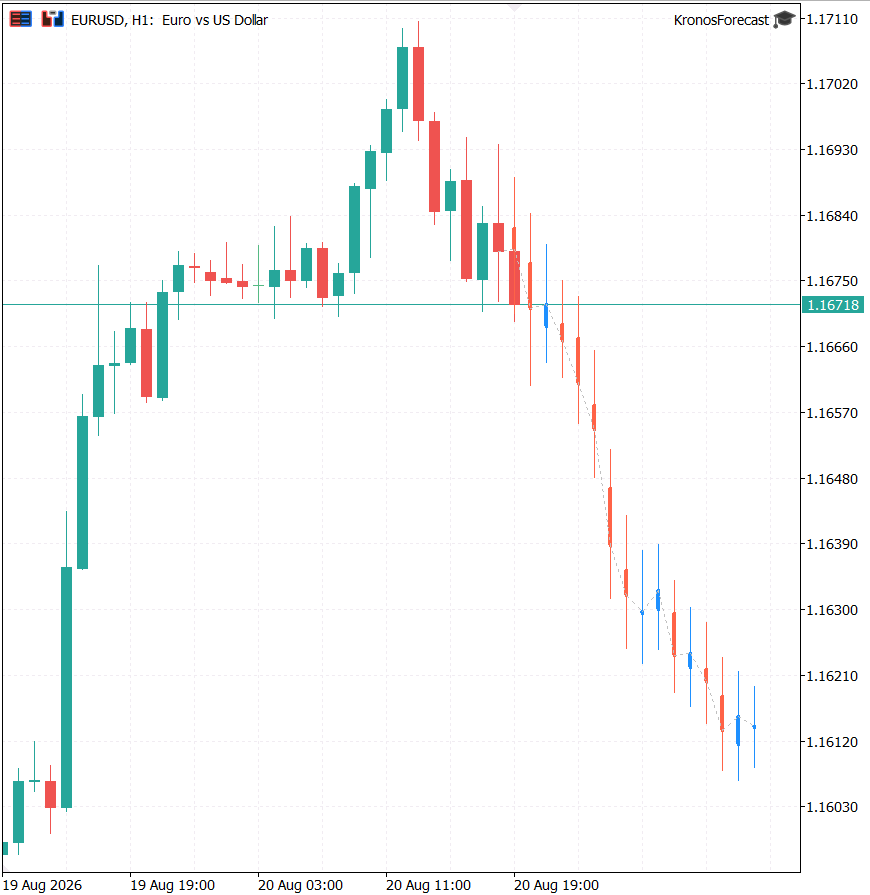
Fig. 1. The KronosForecast Expert Advisor drawing the predicted candles to the right of the current price, refreshed on each new bar
It is a compelling picture, and that is precisely the danger. The forecast arrives as a clean, decisive sequence of candles with a shape and a direction, drawn in the same style as the real price beside it, and nothing in the rendering distinguishes a confident prediction from a coin flip. The model is equally happy to draw sixteen bars of nonsense. The rest of this part is about resisting that invitation and measuring whether the picture is worth anything.
An Honest Evaluation and the Look-Ahead Problem
Evaluating a forecasting model on market data is full of ways to fool yourself, and almost all of them reduce to one mistake: letting information from the future leak into a decision about the past. A backtest that peeks, even slightly, can turn a useless model into a brilliant one on paper. The leak is rarely deliberate. It arrives as an off-by-one in an array index, a bar that was not yet closed when it was read, or a series quietly recalculated over the full history before the walk begins. So the evaluation is built around a strict separation, and the architecture is chosen to make leakage structurally hard rather than merely promised.
The design has three pieces, run in order: a script that walks history once and dumps forecasts to a file, a script that reads the file and reports forecast quality with no trading, and an Expert Advisor that reads the same file and runs a strategy in the Strategy Tester.
Splitting it this way is partly a matter of cost, though less than you might expect. Part 2's headline figure was a full Predict in about sixteen seconds, measured with five sampled paths. The dump runs a single greedy path instead. At the same 256-bar context, one autoregressive step costs about 200 milliseconds, and a sixteen-bar forecast takes sixteen of them plus the encoding and decoding around them. Measured across the full run, a forecast came to just under five seconds, so 947 evaluation bars took about an hour and a quarter of uninterrupted computation. That is enough to rule out running inference inside the Strategy Tester, where every threshold change would pay the whole bill again. But the more important reason is discipline. Because the model runs once and writes its output to a file, everything downstream reads the same fixed numbers, and no analysis can accidentally change what the model predicted. Running the dump with greedy decoding rather than sampling completes the picture: the forecasts become deterministic, so the entire study reproduces exactly rather than approximately.
That choice deserves one caveat stated up front rather than buried. Greedy decoding is not the mode the chart Expert Advisor runs in, and it is not the mode the reference implementation uses either: both draw sampled paths and average them, five of them in the figure above. Greedy takes the highest-probability token at every step, so it traces the single most likely trajectory instead of the center of the distribution. Averaging many sampled paths approximates that same center, which is why we do not expect the verdict to move, but we did not separately verify it, and we would rather say so than let the reader assume the two were tested. What follows is a statement about greedy Kronos on this data.
The dump script's inputs define the whole experiment, and they are worth reading as a specification:
input datetime      InpStartDate   = D'2025.04.01 00:00'; // eval window start (first eval bar)
input datetime      InpEndDate     = D'2025.06.01 00:00'; // eval window end   (last eval bar)
input int           InpStep        = 1;                   // dump density (evaluate every Nth bar)
input int           InpLookback    = 256;                 // context bars (<=512)
input int           InpPredLen     = 16;                  // forecast horizon (bars)
input ENUM_VOL_MODE InpVolMode     = VOL_TICK_DERIVED;    // volume/amount handling
input double        InpTemperature = 1.0;                 // sampling temperature (greedy ignores)
input int           InpTopK        = 0;                   // top-k (greedy ignores)
input double        InpTopP        = 0.9;                 // nucleus top-p (greedy ignores)
input int           InpSampleCount = 1;                   // averaged sample paths (1 for greedy)
input bool          InpGreedy      = true;                // greedy => deterministic / reproducible
input string        InpOutFile     = "kronos_eval\\eurusd_h1_forecasts.csv"; // output (Common\Files)
Two months of EURUSD H1, every bar, with a 256-bar context and a 16-bar horizon. The window is modest because forecasting is the expensive step, and it is trivial to extend. It yields 947 forecasts, just over fifteen thousand individual predictions to score, though, as we will see, far fewer independent ones.
Look-ahead prevention starts with how much history the script requests. Each evaluation bar needs a full context behind it and the realized bars ahead of it, so the copy range is padded on both sides:
//--- Pull enough history: L bars before the start, P bars after the end, so
//--- every eval bar has a full context AND P realized bars. Oldest-first.
   datetime from = InpStartDate - (datetime)((L + 2) * secs);
   datetime to   = InpEndDate   + (datetime)((P + 2) * secs);
   MqlRates rates[];
   int got = CopyRates(_Symbol, _Period, from, to, rates);
The array stays oldest-first, with no series flag, which is the orientation the model expects and removes a whole class of index-reversal bugs. The padding lets the walk treat every bar identically, with no special cases at the edges, which is exactly where leaks hide.
The padding is measured in calendar seconds while the loop counts bars. Stepping back 258 hours from the first of April reaches the twenty-first of March, but weekends remove about a third of those hours from an H1 series, so the 256th bar of the fetched array lands several days into the requested window. The first forecast is therefore keyed at 2025.04.04 rather than 2025.04.01, which costs a few evaluation bars and nothing else. Too little history is the safe direction to err in: a bar without a full context is skipped, never forecast from a short one.
The walk itself then reduces to a single indexed loop, and the comment above it states the whole look-ahead argument in two lines:
//--- Eval bar t: context is rates[t-L+1 .. t], ending at t's close (the anchor),
//--- and forecasts cover t+1..t+P. Nothing at or after t+1 feeds the forecast.
   int rows_written = 0;
   ulong t0 = GetTickCount64();

   for(int t = L - 1; t + P < got; t++)
     {
      if(rates[t].time < InpStartDate || rates[t].time > InpEndDate)
         continue;
      if(((t - L + 1) % InpStep) != 0)
         continue;

      matrix raw;
      datetime ctx_time[];
      BuildWindow(rates, t - L + 1, L, raw, ctx_time);   // closed bars t-L+1..t
The bound t + P < got means a bar is evaluated only if all P of its future bars exist, so no forecast is scored against missing bars. The context passed to BuildWindow is rates[t-L+1 .. t], the L closed bars ending at the evaluation bar itself, so the last candle the model sees is the one whose close is the anchor. Nothing at or after t+1 touches the forecast.
The window has to end exactly there, and the opposite error is harder to notice. End it one bar early, at t-1, and the model's first forecast is of bar t, yet it is scored against bar t+1 from a close the model never saw. Nothing leaks, so no look-ahead check flags it, but every horizon is scored one bar out of step and the model is penalized for information it was never given. The forecasts are identical either way, only keyed one bar apart, so only the indices give it away.
The realized future closes go into the same row, purely so the quality script can score against them. The writing routine states that contract in the file itself:
//+------------------------------------------------------------------+
//| One row: eval-bar time, its close, forecast closes 1..P, then the|
//| REALIZED future closes 1..P (rates[t+1..t+P]). Stored for scoring|
//| only, never an input to any forecast/trade decision.             |
//+------------------------------------------------------------------+
void WriteRow(int fh, const MqlRates &rates[], int t, int P, const matrix &forecast)
  {
   string row = TimeToString(rates[t].time, TIME_DATE | TIME_MINUTES);
   row += StringFormat(",%.6f", rates[t].close);
   for(int h = 0; h < P; h++)
      row += StringFormat(",%.6f", forecast[h][3]);     // col 3 = close
   for(int h = 1; h <= P; h++)
      row += StringFormat(",%.6f", rates[t + h].close);
   FileWrite(fh, row);
  }
Storing the answer next to the prediction feels wrong at first glance, and it is worth being clear about why it is safe. The realized closes occupy their own columns, written after the forecast was already computed, and the two consumers treat them very differently. The quality script reads them because scoring is exactly the act of comparing a prediction to what happened. The signal Expert Advisor, as we will see, reads the forecast columns and explicitly discards the realized ones. The separation is enforced by which columns each program keeps. That is a structural guarantee, not a promise.

Fig. 2. One evaluation bar. The context is the L closed bars ending at it, its close is the anchor, the forecast covers the P bars after it, and the realized bars are read only when scoring, never when forecasting or trading
Forecast Skill Against a Random Walk
The cleanest measure of a forecast involves no strategy at all: no threshold, no sizing, no stop loss, and so no parameter combination to stumble on. The KronosEvalQuality script reads the dump and asks two questions for each horizon from 1 to 16 bars. Does the predicted direction match the realized one more often than a rule that ignores the model? And is the predicted return closer to the truth than a random walk, the naive prediction that the price will not move?
That baseline is the crux of the whole evaluation. On liquid intraday FX, "no change" is a famously hard prediction to beat, because the next move really is close to unpredictable and the current price is already the market's best estimate of the next one. A forecasting model does not earn its keep by being roughly right about the level, which the previous close achieves for free. It earns its keep by beating that baseline, and any model that cannot is worse than doing nothing.
The accumulators keep both errors side by side, per horizon, so the comparison is always made on identical samples:
//+------------------------------------------------------------------+
//| Per-horizon running accumulators.                                |
//+------------------------------------------------------------------+
struct HorizonStat
  {
   int    n;            // directional samples (actual and forecast both non-flat)
   int    dir_hit;      // Kronos directional hits
   int    up;           // realized up-moves among those samples
   double k_abs;        // sum |kronos_ret - actual_ret|
   double k_sq;         // sum (kronos_ret - actual_ret)^2
   double rw_abs;       // sum |0 - actual_ret| == sum |actual_ret|
   double rw_sq;        // sum actual_ret^2
  };
Working in returns rather than prices keeps the numbers comparable while the level drifts. As the dump is loaded, every forecast and realized close becomes a cumulative return from the anchor close:
      for(int h = 0; h < P; h++)
        {
         g_k[g_rows * P + h] = (fc[h] - last_close) / last_close;   // predicted cumulative return to h
         g_a[g_rows * P + h] = (ac[h] - last_close) / last_close;   // realized   cumulative return to h
        }
The scoring routine walks those returns and accumulates the two error series. It takes a list of row indices rather than reading the rows in order, for a reason that becomes clear when we measure the uncertainty:
         double k_ret = g_k[base + h];
         double a_ret = g_a[base + h];

         //--- directional accuracy: skip flat actuals (no direction to call)
         //--- and flat forecasts (no call made)
         if(a_ret != 0.0 && k_ret != 0.0)
           {
            if((k_ret > 0.0) == (a_ret > 0.0)) st[h].dir_hit++;
            if(a_ret > 0.0) st[h].up++;
            st[h].n++;
           }

         double k_err = k_ret - a_ret;
         st[h].k_abs += MathAbs(k_err);
         st[h].k_sq  += k_err * k_err;
         st[h].rw_abs += MathAbs(a_ret);    // baseline error == |actual return|
         st[h].rw_sq  += a_ret * a_ret;
Predicting "no change" means predicting a zero return, so the baseline's error is whatever the price did, and rw_abs simply accumulates the absolute realized return. The directional count skips flat realized closes, which have no direction to call, and flat forecasts, which make no call. That is why it comes to 15,121 rather than the 15,152 that 947 forecasts at sixteen horizons would give: twenty-three realized closes landed exactly on the anchor, and eight forecasts did. The error sums run over every forecast and are divided by the forecast count, not the directional count.
The up field supplies a second directional baseline. A coin flip scores 50%, but in a window where the price mostly rose, a rule that always calls "up" scores more without any model. The share of realized up-moves per horizon is that rule's score, and a forecaster has to beat it, not just the coin.
The report then turns the two error sums into one ratio per horizon, the number that settles the question:
      //--- skill ratio < 1 means Kronos beats random-walk on that error metric
      double rmse_skill = (rw_rmse > 0) ? k_rmse / rw_rmse : 0.0;
      double mae_skill  = (rw_mae  > 0) ? k_mae  / rw_mae  : 0.0;

      PrintFormat("%2d| %6.2f%%  %5.1f%% | %.6f %.6f %5.3f | %.6f %.6f %5.3f",
                  h + 1, diracc * 100.0, upshr * 100.0, k_rmse, rw_rmse, rmse_skill,
                  k_mae, rw_mae, mae_skill);
A skill ratio below 1.0 would mean Kronos beats the random walk on that horizon; above 1.0 means it does worse. The results are unambiguous:
| Horizon (bars) | Directional accuracy | Realized up-moves | RMSE skill ratio | MAE skill ratio |
|---|---|---|---|---|
| 1 | 51.86% | 53.0% | 1.124 | 1.166 |
| 2 | 50.64% | 53.0% | 1.094 | 1.131 |
| 3 | 51.80% | 54.0% | 1.095 | 1.137 |
| 4 | 51.53% | 53.2% | 1.098 | 1.119 |
| 5 | 49.63% | 53.9% | 1.093 | 1.115 |
| 6 | 50.58% | 53.7% | 1.081 | 1.106 |
| 7 | 51.90% | 53.7% | 1.071 | 1.092 |
| 8 | 50.32% | 52.9% | 1.077 | 1.097 |
| 9 | 51.00% | 53.1% | 1.073 | 1.088 |
| 10 | 51.59% | 51.9% | 1.093 | 1.094 |
| 11 | 51.90% | 50.3% | 1.120 | 1.109 |
| 12 | 54.03% | 50.7% | 1.188 | 1.144 |
| 13 | 52.91% | 49.8% | 1.252 | 1.171 |
| 14 | 53.49% | 49.4% | 1.300 | 1.198 |
| 15 | 52.48% | 49.0% | 1.371 | 1.231 |
| 16 | 53.59% | 48.8% | 1.403 | 1.250 |
Both skill ratios exceed 1.0 at every horizon, so the point forecasts are less accurate than assuming the price will not move, and the two error measures agree everywhere, so the result is not an artifact of squaring the errors. Directional accuracy is 51.83% overall across 15,121 scored predictions, which looks like a sliver of skill until it is set beside the up-move column. For the first nine horizons the price rose 53% to 54% of the time, so always predicting "up" would have beaten Kronos at every one of them. Only from eleven bars out, where the up share falls to around 50%, does the model edge ahead of the majority call, by 1.5 to 3.3 points.
The skill column stays in a narrow band between 1.07 and 1.13 from one bar to ten, least bad at 1.071 at seven bars, then climbs to 1.403 at sixteen. Near the anchor the model adds a steady amount of error to a baseline that is already as good as it gets on near-random hourly moves; further out, sixteen bars of accumulated autoregressive drift carry the forecast away from the price.
How Much Evidence the Sample Holds
The rise in directional accuracy at the longest horizons is tempting, but the samples overlap heavily. Stepping one bar at a time, each 16-bar forecast shares fifteen of its bars with its neighbour, so consecutive rows nearly repeat the same measurement, and treating them as independent would overstate the confidence of every number in the table.
The script measures this with a moving-block bootstrap. It rebuilds the evaluation many times from randomly chosen runs of consecutive forecasts, a trading day at a time, so the overlap within each run survives, and it records every metric on each rebuild. The spread of those values is the uncertainty, and it is why Score takes a list of rows: a resample is just a different list, repeats allowed:
//--- moving-block bootstrap: neighbouring forecasts share most of their path,
//--- so whole runs of rows are resampled to keep that dependence intact
   int B    = MathMax(1, MathMin(InpBlockLen, g_rows));
   int reps = MathMax(2, InpBootReps);
   MathSrand(InpSeed);

   double boot_dir[];                       // overall directional accuracy per resample
   double boot_hdir[];                      // [rep*P + h] directional accuracy
   double boot_rmse[];                      // [rep*P + h] RMSE skill ratio
   ArrayResize(boot_dir, reps);
   ArrayResize(boot_hdir, reps * P);
   ArrayResize(boot_rmse, reps * P);
   int pick[];
   ArrayResize(pick, g_rows);
   HorizonStat bs[];

   for(int r = 0; r < reps; r++)
     {
      for(int filled = 0; filled < g_rows; )
        {
         int start = RandIndex(g_rows - B + 1);
         for(int j = 0; j < B && filled < g_rows; j++)
            pick[filled++] = start + j;
        }
      Score(pick, P, bs);
With a fixed seed the intervals reproduce exactly. Here they are for a few representative horizons, from 2,000 resamples in blocks of 24 forecasts:
| Horizon (bars) | Directional accuracy, 95% interval | RMSE skill ratio, 95% interval | Resamples with skill below 1.0 |
|---|---|---|---|
| 1 | 48.88% to 55.32% | 1.075 to 1.181 | 0.0% |
| 4 | 48.10% to 55.56% | 1.055 to 1.151 | 0.0% |
| 7 | 47.67% to 57.34% | 1.016 to 1.130 | 0.3% |
| 12 | 48.09% to 59.62% | 1.029 to 1.409 | 0.6% |
| 16 | 46.78% to 60.28% | 1.038 to 1.874 | 0.4% |
The two halves of the verdict differ sharply. The error result is robust: at every horizon the skill ratio's interval lies entirely above 1.0, and no horizon has more than 0.8% of its resamples below it. The directional result is not a result at all. The overall 51.83% carries a 95% interval of 47.47% to 56.38%, which includes both 50% and the always-up rule, and its spread corresponds to about 503 independent predictions, not 15,121. The data show no evidence of directional skill, a weaker statement than proof of a coin flip, and the rise toward sixteen bars sits well inside the noise.

Fig. 3. Forecast quality by horizon: the hit rate stays near 50% and below the always-up rule at short horizons, while the error skill ratio and its 95% interval sit above 1.0 throughout
The per-horizon table condenses what the script prints to the Experts log, which also carries the raw Kronos and random-walk errors behind each ratio, followed by the full sixteen-horizon bootstrap table. Nothing is hand-assembled, so the whole result regenerates from the dump.
A Backtest That Profits Without an Edge
A skeptic might still ask whether a simple trading rule could extract something the error metrics miss. It is not an unreasonable question. A model can be poorly calibrated on average and still be informative when it speaks loudly, and directional accuracy weights every prediction equally when a trader would not. So we built a rule, deliberately trivial, so that any result reflects the model and not clever strategy engineering.
The KronosSignalEA runs no inference at all. It loads the dump into parallel arrays at initialization, deliberately discarding the realized-close columns as it parses:
      double last_close = (double)FileReadString(fh);
      double fc[]; ArrayResize(fc, P);
      for(int h = 0; h < P; h++) fc[h] = (double)FileReadString(fh);
      for(int h = 0; h < P; h++) FileReadString(fh);   // skip realized actuals (scoring only)
That fourth line is the enforcement mentioned earlier. The realized closes are read off the stream and thrown away without ever being assigned, so they never reach a variable the trading logic could see. What survives into memory is only the eval-bar time, its anchor close, and the sixteen forecast closes; the answer key is simply not in the Expert Advisor's address space. Row lookup is then an ordinary forward-only cursor over those times, since the Strategy Tester advances through history in order.
One piece of this Expert Advisor is worth dwelling on, because it cost real debugging time and the lesson generalizes well beyond this project. The obvious way to track whether a position is open is a member variable, set when you buy and cleared when you close. That shadow flag desynchronizes the moment an order fails or anything closes a position without going through your own code path. The flag then records a trade that never happened, and the Expert Advisor goes on managing a position it does not have, or opens a duplicate of one it does. The fix is to stop remembering and start asking:
//+------------------------------------------------------------------+
//| Current position direction held by THIS EA on this symbol: +1    |
//| long, -1 short, 0 flat. Reading the terminal each bar instead    |
//| of a shadow flag keeps the EA in step with the real position     |
//| and prevents duplicate same-bar orders.                          |
//+------------------------------------------------------------------+
int CurrentDir()
  {
   if(!PositionSelect(_Symbol))
      return 0;
   if(PositionGetInteger(POSITION_MAGIC) != (long)InpMagic)
      return 0;
   long ptype = PositionGetInteger(POSITION_TYPE);
   return (ptype == POSITION_TYPE_BUY) ? +1 : -1;
  }
The magic-number check stops the Expert Advisor claiming a position that something else opened. The state now comes from the terminal every bar, so it cannot drift from reality. Selecting by symbol does assume one position per symbol, which always holds on a netting account and holds for this Expert Advisor's own trades, since it closes before reversing. On a hedging account shared with other positions on the symbol, loop over PositionsTotal with PositionGetTicket and check each magic number instead.
The bar logic ties the pieces together, and its first two lines carry the look-ahead guarantee into the trading half of the study:
//+------------------------------------------------------------------+
//| Bar logic. The forecast keyed at the PREVIOUS bar (the just-     |
//| closed bar) is the one we may act on now, at this bar's open,    |
//| so the decision never uses information from the bar it trades on.|
//+------------------------------------------------------------------+
void OnBar()
  {
//--- the just-closed bar is index 1; its time keys the forecast we trade now
   datetime closed_time = (datetime)iTime(_Symbol, _Period, 1);
   int r = FindRow(closed_time);
The forecast is keyed at bar index 1, the bar that just finished, and acted on as the current bar opens, so the decision uses nothing from the bar it trades on, the tester-side twin of the dump's context rule. The signal itself is as plain as it can be:
   double pred_ret = (fc_h - last_close) / last_close;
   int want = 0;
   if(pred_ret >  InpThreshold) want = +1;
   else if(pred_ret < -InpThreshold) want = -1;

   if(want == 0 || want == dir)
      return;   // no signal, or already in the wanted direction (no dup order)

//--- flip or fresh entry: close any opposite position first, then open once
   if(dir != 0)
      CloseAll();
   if(want > 0)  g_trade.Buy(InpLots);
   else          g_trade.Sell(InpLots);
   g_hold = InpHorizon;      // reset hold for the new position
If the forecast close at the chosen horizon exceeds the anchor close by more than the threshold, go long; if it falls short of it by more than the threshold, go short; hold for the horizon or until the signal flips. Both runs use InpHorizon = 16, so the rule trades the model's view of the price sixteen hours out. There are no stops, targets or filters, so that only the model is being tested, and InpThreshold is the only knob.
The two thresholds are placed by the model's own output. At sixteen bars, 69.6% of forecasts predict a move above 0.1%, so that threshold trades on most bars. Only 5.2% predict a move above 0.6%, so that threshold keeps only the loudest calls, where a model poorly calibrated on average might still be informative. They represent those two regimes, and we report both rather than the better one.
Both runs cover a tester range spanning the dump's window on EURUSD H1, and the tradeable span inside it shows the look-ahead rules at work. The first forecast is keyed at 2025.04.04 21:00, for the calendar-versus-bars reason above. The last is keyed at 2025.05.30 07:00, a Friday, because no later bar could have sixteen realized bars ahead of it before the weekend. Outside that span the row lookup finds nothing and the Expert Advisor stands aside, so the dump alone defines the experiment.
The runs use the "Open prices only" model, sufficient because the Expert Advisor acts only as a bar opens, with a $10,000 deposit, 1:500 leverage and a fixed 0.1 lot, so a dollar of profit is a pip of EURUSD movement. The tester charges this account's real costs: the spread recorded in the price history, about two points as measured from the fills, a commission of $0.70 per round turn, and overnight swap. One detail links back to the shadow flag. In this mode the tick that opens a 00:00 bar can precede the trading session, and an order sent on it is rejected with [Market closed]. That happened eleven times in the fair run, and because the Expert Advisor reads its position from the terminal, each rejection simply left it where it was.
With the high threshold of 0.6%, the strategy acts only eight times in two months. Four trades win, the Profit Factor is 0.66, and the run ends $73.60 down before costs. Eight trades cannot support a conclusion either way. That is the tester's first lesson, and it cuts both ways: on a different two months the same handful of trades could as easily have drawn a smooth rising curve.
Lower the threshold to 0.1% so the strategy actually trades, and the run has 133 trades:
| Metric | High threshold, 0.6% | Fair threshold, 0.1% |
|---|---|---|
| Total trades | 8 | 133 |
| Net profit before costs (USD) | -73.60 | 220.20 |
| Commission and swap (USD) | -12.32 | -130.61 |
| Net profit after costs (USD) | -85.92 | 89.59 |
| Profit Factor | 0.61 | 1.05 |
| Sharpe ratio | -0.22 | 0.34 |
| Profitable trades | 50.00% | 45.86% |
| Expected payoff (USD) | -10.74 | 0.67 |
| Recovery factor | -0.25 | 0.16 |
| Balance drawdown, relative | 2.10% | 4.28% |
| Largest profit trade (USD) | 71.10 | 105.75 |
| Largest loss trade (USD) | -157.99 | -272.89 |
| LR correlation | -0.15 | 0.50 |
| Z-Score | -0.38 | -0.80 |
The rows from the Profit Factor down are the tester's own figures, after costs. At face value the fair run is a modest success: a Profit Factor of 1.05, a Sharpe ratio of 0.34, and an equity curve that ends higher than it started.
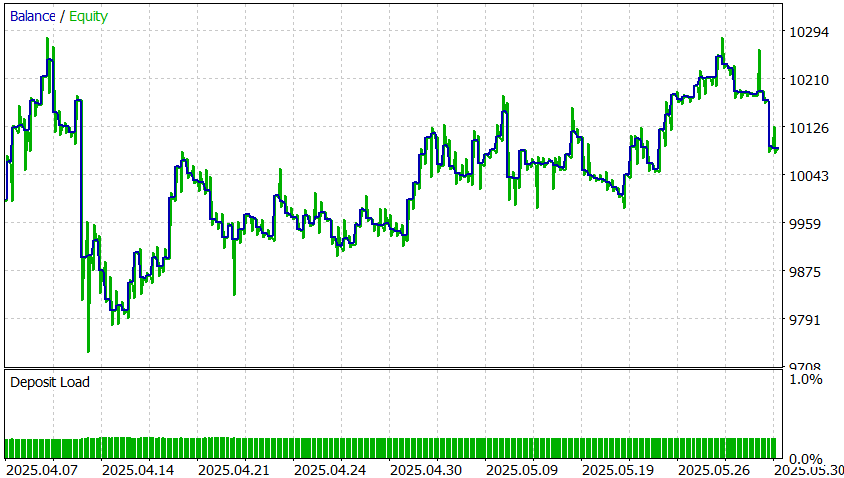
Fig. 4. The fair-threshold backtest: 133 trades and a small profit after costs, which the checks below trace to the market's drift
Two checks take that success apart. The first is the spread of the results. Before costs the strategy made $220.20 over 133 trades, $1.66 per trade, against a per-trade standard deviation of $40.29: a t-statistic of 0.47, far below any conventional threshold. Resampling the trades with replacement gives a result of zero or worse in about 31% of resamples, and the Z-Score of -0.80 says the order of wins and losses is indistinguishable from chance.
The second check asks where the profit came from. The 68 long trades made $328.70; the 65 short trades lost $108.50. EURUSD rose from about 1.094 to 1.135 over the window, roughly 3.7%, so a rule that takes about half its trades long collects part of that rise whatever its signal says. It is the same drift that let the always-up rule beat the model in the quality study, now showing up as money.
Costs take most of what is left. Commission and swap come to $130.61, about 59% of the profit before costs, the commission a fixed $0.70 per round turn regardless of the signal, and a wider live spread would cost more again. With $1.66 per trade there is little room for any of it. The extremes agree: the largest loss, $272.89, is over two and a half times the largest win of $105.75, because with no stops a directionless signal leaves large adverse moves unprotected.
The Verdict, and Why
Three views of the same 947 forecasts agree. The point forecasts are less accurate than no change at every horizon, with intervals above the baseline. The directional calls are indistinguishable from 50% and, at short horizons, lose to always calling "up". The backtest's profit is indistinguishable from zero and comes from the long side of a rising market. The views are not independent, since all three read the same forecasts over the same two months, but they ask different questions.
Two separate claims follow. Over this window of EURUSD H1, greedy Kronos shows no forecasting skill over the no-change baseline, and the simple rule built on its forecasts shows no trading edge. The reasons are specific and instructive rather than a failure of the port:
- Domain mismatch. Kronos was trained on equities and crypto, largely on daily and longer bars. We fed it hourly foreign-exchange data, a different instrument class on a different time scale from the one it learned. Foundation models generalize within their domain far better than across it, and hourly FX is a long way from daily equities in both statistical character and market structure.
- Synthetic volume. FX feeds carry no real exchange volume, so we manufactured the volume and amount features from tick volume and a derived turnover. The model has never seen those proxies; two of its six input features are, to it, out of distribution, and it has no way to signal that it is less certain because of it.
- A brutal baseline. EURUSD intraday is close to a martingale, where the next move is nearly unpredictable and "no change" is an extremely strong baseline. Beating it on this instrument at this scale is hard for any forecaster, and a skill ratio of 1.07 even at the model's best horizon is the price of insisting on a direction where none is reliably available.
We deliberately did not go looking for a kinder setup to produce a greener number. A retest on daily bars with real exchange volume, closer to where Kronos was actually trained, is the obvious follow-up and might well tell a different story. But running it only after a disappointing result and reporting only the better of the two is the exact dishonesty this evaluation was built to avoid. The verdict stands as the worst-case-but-fair one, and the retest, if anyone runs it, belongs alongside this result rather than instead of it.
Everything above reproduces exactly, because the dump is greedy. Three steps, in order:
- Run KronosForecastDump as a script on an EURUSD H1 chart with the inputs shown earlier. It writes kronos_eval\eurusd_h1_forecasts.csv into the shared Common\Files folder, the one location a Strategy Tester agent can also read. Budget about an hour and a quarter.
- Run KronosEvalQuality on the same chart. In a few seconds it prints the per-horizon skill table and the bootstrap intervals to the Experts log, with no trading involved.
- Run KronosSignalEA in the Strategy Tester on EURUSD H1 with the "Open prices only" model, once with InpThreshold = 0.006 and once with 0.001, InpHorizon at 16, over any range covering the dump's window. The trades will match ours; the net figures will differ unless your commission and swap do.
Conclusion
This series set out to run a real foundation model natively inside MetaTrader 5 and to find out honestly whether it was any good. The port is faithful, proven against PyTorch at every stage. The forecasts, greedy-decoded on two months of EURUSD H1 with synthesized volume, carry no usable edge, and three views of them, each asking a different question, agree.
- The forecast is verifiable and useless here, at once. Faithful to the reference, and without market edge on this instrument. Holding both facts honestly is the point, and neither one weakens the other.
- A profit is not an edge. The fair backtest ends in profit, and the profit is noise plus the market's drift: indistinguishable from zero, and earned on the long side of a rising market. Counting the trades, comparing the average result with the spread, and splitting by direction is what tells the two apart.
- Alignment is part of honesty. Look-ahead is the famous error, but a context window that stops one bar short leaks nothing and still scores every forecast at the wrong horizon. Only the indices reveal it.
- Architecture can enforce honesty. Dumping forecasts offline, scoring them in a separate script, and having the Expert Advisor discard the realized columns as it parses makes look-ahead structurally difficult rather than a matter of good intentions. Reading position state from the terminal instead of a shadow flag is the same instinct applied to a smaller problem.
- Honest negatives compound into trust. The reasons the model fails here, domain and time-scale mismatch and synthetic volume, are concrete, and they point at exactly the retest that would be fair to try next.
That closes the series. Running a foundation model in MQL5 turned out to be the tractable part: three articles in, the engine works, it is verified, and it is fast enough to use. Knowing whether to trust what it says is the whole game, and the discipline that answered it, verify fidelity and market value separately, refuse to let the future leak into the past, and ask what a backtest would have made without the model before believing it, is the part worth carrying to the next model. The engine outlives this particular negative result, and so does the method for judging the next one.
Getting the Source Code via MQL5 Algo Forge
All source files are attached to this article below, but the full repository is also available on MQL5 Algo Forge, the community's Git-based platform for sharing and collaborating on trading projects.
The four programs below are this part's additions. All of them include the engine built in Parts 1 and 2, so they need the MQL5\Include\Kronos headers and the exported weight files from those articles in order to compile and run.
| File name | Description |
|---|---|
| MQL5\Experts\Kronos\KronosForecast.mq5 | Visualize-only Expert Advisor: runs the full pipeline and draws the forecast candles on the chart |
| MQL5\Scripts\Kronos\KronosForecastDump.mq5 | Walks history once and dumps greedy forecasts plus realized future closes to CSV, under look-ahead discipline |
| MQL5\Scripts\Kronos\KronosEvalQuality.mq5 | Scores the dump per horizon: directional accuracy, the up-move baseline, the error skill ratio against the random-walk baseline, and block-bootstrap intervals |
| MQL5\Experts\Kronos\KronosSignalEA.mq5 | Strategy-Tester Expert Advisor: trades a deliberately simple threshold rule on the precomputed forecasts |
Warning: All rights to these materials are reserved by MetaQuotes Ltd. Copying or reprinting of these materials in whole or in part is prohibited.
This article was written by a user of the site and reflects their personal views. MetaQuotes Ltd is not responsible for the accuracy of the information presented, nor for any consequences resulting from the use of the solutions, strategies or recommendations described.

 Neural Networks in Trading: Training Deep Spiking Models (SEW-ResNet)
 Machine Learning Under Constraint (Part 3): De-Risking Near the Profit Target and the News-Window Rule
 Features of Experts Advisors
 How to Test and Customize Built-in MQL5 Programs: Envelopes with Alligator Strategy

- Free trading apps
- Over 8,000 signals for copying
- Economic news for exploring financial markets
You agree to website policy and terms of use