

Price Action Analysis Toolkit Development (Part 83): Building a Reusable Double-Bottom Pattern Library
 121
121
 0
0

Contents
Introduction
Chart patterns are easy to name and surprisingly difficult to describe in code. Two traders may point to the same section of a chart and agree that it resembles a double bottom, yet disagree about the precise starting bar, the acceptable difference between the lows, the position of the neckline, or the point at which the formation becomes valid. That ambiguity becomes a practical obstacle when we move from visual analysis to systematic research.
This part grew from a practical difficulty I encountered while preparing double-bottom examples. A chart image preserved what I had seen, but it did not preserve the candle sequence in a form that I could reload, measure and compare later.
Before an algorithm can recognize a pattern, it needs examples in a consistent data format. Each example must retain its original candle data. Percentage offsets reduce differences in absolute price scale, but do not by themselves make samples comparable across symbols, timeframes or market conditions.
At the starting point, the trader may recognize a double bottom visually but has no repeatable way to preserve its candles. Screenshots and informal notes do not directly provide normalized, searchable candle data that the Expert Advisor can reload. The immediate problem is a missing collection process.
By the end, the reader will have a six-file recorder. It selects formations, derives candle features, normalizes prices, stores CSV samples, and reloads them after a restart. The implementation moves from shared data structures through extraction, normalization, persistence and library management to the chart panel and Expert Advisor.
Scope of this part: The double-bottom designation is currently assigned by the trader. The system records and normalizes the selected candle sequence but does not yet verify the two lows, neckline, breakout or subsequent price reaction. Those analytical rules will be introduced in the next development stage.
Understanding the Concept
From visual labels to structured samples
Discretionary traders often build pattern knowledge by reviewing charts, saving screenshots and writing notes. Screenshots are useful for visual memory, but they are weak inputs for computation. They do not directly expose candle times, OHLC values, volume, wick sizes or a reliable relationship between bars. They are also difficult to search, normalize and compare in bulk.
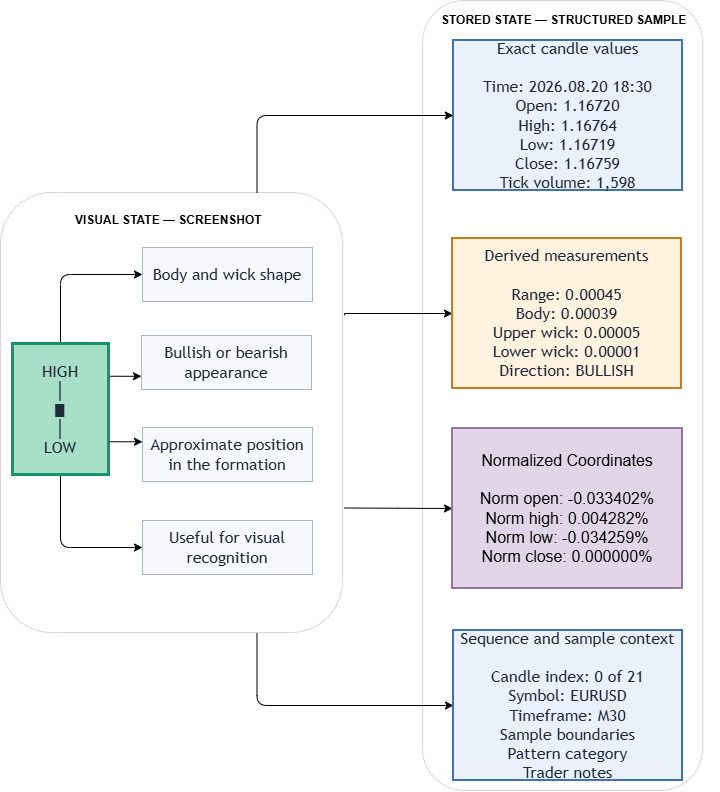
Figure 1. Visible candle features and the data preserved in a structured sample.
A structured pattern sample solves a different class of problem. Instead of preserving only an image, it preserves the sequence that produced the image. Each candle can carry its raw values, derived measurements and normalized coordinates. The sample stores the symbol, timeframe, first and last candle times, observed candle high and low, candidate category and trader's notes. The rectangle's vertical price bounds are neither stored nor used to filter candles.
Recorder workflow and deliberate boundaries
The recorder follows a single repeatable workflow. The trader attaches the Expert Advisor, enters selection mode, positions the rectangle, and optionally adds a note. When the user clicks Record, the program extracts the bars, derives candle features, normalizes OHLC values, assigns a sample ID, and saves the sample.
The panel displays the number of stored samples, lists recent records and allows a selected entry to be deleted. When the Expert Advisor is restarted, the library scans its storage folder and reconstructs the in-memory collection from the saved CSV files. This confirmed that a recorded sample was not limited to the chart session in which it was created.
This stage deliberately stops at recording. The rectangle's vertical price limits do not filter candles; only its time coordinates define the extracted sequence. The program does not locate the two lows or calculate a neckline. It does not require a preceding downtrend or wait for a breakout. It also does not label the trade outcome or calculate risk and reward. These boundaries are important because the recorder should not be mistaken for a completed double-bottom detector or trading model.
I kept the selection process manual because I did not want to impose a rigid double-bottom definition before collecting enough examples to study. My aim was first to preserve formations identified during chart review and then examine how they differed in candle structure, duration and price movement. Once a representative library has been built, repeated observations can be converted into measurable rules and tested against the stored samples.
Building a Consistent Sample Collection
The recorder stores every selection in a consistent technical format, but the trader must still apply a consistent selection method. Before collecting many samples, decide whether the rectangle should include the preceding decline, neckline breakout and candles following the second low. Applying the same convention improves later comparison.
The collection should include clear, marginal and failed formations rather than only textbook examples. Notes can identify uncertain cases until dedicated validation and outcome fields are introduced. Samples from different symbols, timeframes and market conditions will also create a more representative dataset.
At this stage, each record is a manually labelled candidate rather than verified ground truth. Its value comes from preserving the candle sequence so the label can later be measured, reviewed and tested. Rules derived from these labels will need evaluation on independently reviewed examples, including negative cases.
System Architecture
The main Expert Advisor is DoubleBottomRecorderEA.mq5. It owns and initializes the library and panel, and it forwards chart events. PatternRecorderPanel.mqh manages the visible interface and the user's interaction with chart objects. PatternExtractor.mqh converts a selected time interval into a normalized sample. PatternLibrary.mqh owns the in-memory collection and coordinates add, retrieve and remove operations. PatternStorage.mqh is responsible for CSV persistence. Finally, PatternData.mqh contains the shared enumerations, structures and helper functions used by the other modules.
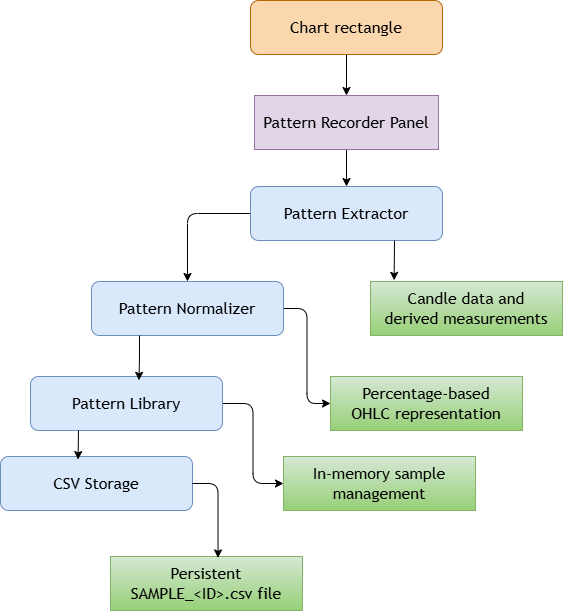
Figure 2. Data flow from a manually selected chart region to a normalized and persistent pattern sample.
Figure 2 represents processing stages rather than individual source files. The Pattern Normalizer stage refers to the NormalizeSample() helper contained in PatternData.mqh.
This layout creates a straightforward dependency flow. The panel requests an extraction and then asks the library to store the completed sample. The library delegates persistence to the storage module. All three operate on the same structures declared by the data module. The Expert Advisor remains a thin integration layer rather than becoming the location of every implementation detail.
MQL5 Implementation
The project is implemented in six modules. We begin with the shared data structures, then add extraction and normalization, persistent storage, collection management, the chart panel and finally the Expert Advisor that connects the components to the MetaTrader 5 event model.
The following excerpts highlight the central operations, while the attachments contain the complete compile-ready source files.
1. PatternData.mqh
The data model has two levels. SCandleData represents one candle, while SPatternSample represents a complete formation. The candle structure retains raw market values because normalization should not destroy the original observation. It also stores derived features so downstream code does not repeatedly calculate the same geometry.
//--- Stores raw, derived and normalized values for one candle
struct SCandleData
  {
   datetime time;
   double open, high, low, close;
   long tick_volume;
   double range, body, upper_wick, lower_wick;
   ENUM_CANDLE_DIRECTION direction;
   double norm_open, norm_high, norm_low, norm_close;
};
The pattern structure supplies identity and context. Its dynamic candle array allows the selected formation to contain any reasonable number of bars. price_high and price_low describe the extremes of the extracted candles, not the rectangle anchors. norm_reference_price records the base used for percentage normalization.
//--- Stores metadata and the complete candle sequence for one sample
struct SPatternSample
  {
   ulong id;
   ENUM_PATTERN_TYPE pattern_type;
   string symbol;
   ENUM_TIMEFRAMES timeframe;
   datetime start_time, end_time;
   int bars;
   double price_high, price_low;
   SCandleData candles[];
   string notes;
   double norm_reference_price;
   bool is_normalized;
};
Initialization is centralized in InitPatternSample(). That is more reliable than asking every caller to remember the correct empty values. In particular, price_low begins at DBL_MAX, the candle array is resized to zero and normalization is marked as incomplete. AddCandleToSample() then appends candles and updates the sample high, low and bar count as the sequence is built.
Deriving candle geometry
Raw OHLC values describe the market, but common candle characteristics are more convenient when they are calculated once. The range is the difference between high and low. The body is the absolute distance between open and close. The upper wick extends from the larger of open and close to the high, while the lower wick extends from the low to the smaller of open and close.
Direction is a descriptive candle feature. A candle is labelled doji when its body is no larger than 10% of its high-low range, including a zero-range candle. Otherwise the sign of close minus open determines bullish or bearish direction. The threshold is a fixed recording convention, not a validated trading signal. It does not depend on the chart to which the recorder is attached.
//+------------------------------------------------------------------+
//| Calculate candle range, body, wicks and direction                |
//+------------------------------------------------------------------+
void CalculateCandleDerived(SCandleData &candle)
  {
//--- Derive the candle geometry from its OHLC prices
   candle.range = candle.high - candle.low;
   candle.body = MathAbs(candle.close - candle.open);
   candle.upper_wick = candle.high - MathMax(candle.open, candle.close);
   candle.lower_wick = MathMin(candle.open, candle.close) - candle.low;
   double diff = candle.close - candle.open;
   double tolerance = candle.range * 0.10;
//--- A body no larger than 10% of the range is a descriptive doji label.
   if(candle.body <= tolerance)
      candle.direction = CANDLE_DOJI;
   else
      if(diff > 0.0)
         candle.direction = CANDLE_BULLISH;
      else
         candle.direction = CANDLE_BEARISH;
  }
The enumeration PATTERN_DOUBLE_BOTTOM_CANDIDATE identifies a manually assigned category. CSV files write the text DOUBLE_BOTTOM_CANDIDATE explicitly. Candle direction values 0, 1 and 2 represent bullish, bearish and doji labels respectively. The tick_volume field stores quote tick counts, not traded quantity; it is not directly comparable across providers or market types.
2. PatternExtractor.mqh
The chart rectangle is an intuitive selection tool because traders already understand how to move and resize it. The panel creates an OBJ_RECTANGLE named PatternRect, places it over the most recent bars and leaves it selected so the user can drag its anchors.
When the trader clicks Record, ExtractFromRectangle() first confirms that the object exists. It reads the two OBJPROP_TIME anchor values with ObjectGetInteger(), rejects an empty or zero-width interval and swaps the times when the user has dragged the anchors into reverse order.
Historical data is requested with the date-range overload of CopyRates(). The technical input check requires 2 to 100,000 bars and a synchronized series. It does not establish that the selection contains a double bottom. Each MqlRates element is copied into SCandleData, enriched by CalculateCandleDerived() and appended to the sample. After extraction, the stored start and end times are replaced with the actual times of the first and last copied candles. This matters because a rectangle can begin or end between bar openings.
//--- Request historical bars covered by the selected time interval
   MqlRates rates[];
   int copied = CopyRates(symbol, tf, t1, t2, rates);
   if(copied < 2 || copied > 100000 ||
      !SeriesInfoInteger(symbol, tf, SERIES_SYNCHRONIZED))
     {
      error = "Need 2-100000 candles and synchronized history.";
      return(false);
     }

//--- Initialize the sample and convert the copied bars
   InitPatternSample(sample, 0, PATTERN_DOUBLE_BOTTOM_CANDIDATE,
                     symbol, tf, t1, t2, "");
   for(int i = 0; i < copied; i++)
     {
      //--- Copy raw prices and calculate candle features
      SCandleData c;
      c.time = rates[i].time;
      c.open = rates[i].open;
      c.high = rates[i].high;
      c.low = rates[i].low;
      c.close = rates[i].close;
      c.tick_volume = rates[i].tick_volume;
      CalculateCandleDerived(c);
      c.norm_open = c.norm_high = c.norm_low = c.norm_close = 0.0;

      //--- Append the candle and check allocation
      if(!AddCandleToSample(sample, c))
        {
         error = "Unable to allocate candle storage.";
         return(false);
        }
     }
Normalizing the recorded shape
Raw prices are difficult to compare across symbols and historical price levels, so the recorder converts them into percentage displacements from the first close. A ten-point movement is enormous for one instrument and negligible for another. Even on the same symbol, historical price levels can change enough to distort a direct distance calculation.
The recorder uses the close of the first selected candle as its reference. Every OHLC value is converted to a percentage displacement from that reference:
normalized price = (price - reference close) / reference close * 100
The first candle's normalized close is therefore zero. Later values describe where each price sits relative to the start of the sample. A normalized close of 1.25 means that the close is 1.25 percent above the reference; -0.80 means it is 0.80 percent below.
Moving the selection start changes the reference close and every normalized value. Percentage normalization does not adjust for volatility, sessions, liquidity or tick size. Samples retain their original lengths; length alignment and a comparison method are reserved for later development. The recorder accepts positive finite prices.
//--- Normalize price scale; no pattern validation or length alignment is performed.
   if(!NormalizeSample(sample))
     {
      error = "Normalization failed.";
      return(false);
     }
//--- Use actual copied bar times as the final sample boundaries
   sample.start_time = sample.candles[0].time;
   sample.end_time = sample.candles[sample.bars - 1].time;
   error = "";
   return(true);
  }
3. PatternStorage.mqh
The recorder stores samples under MQL5\Files\PatternLibrary\DOUBLE_BOTTOM_CANDIDATE, with filenames such as SAMPLE_1.csv. The library loads files that satisfy the expected naming and data-format requirements.
Each file contains a metadata header and row, followed by the candle header and one row per bar. FORMAT identifies the schema; PATTERN_TYPE contains DOUBLE_BOTTOM_CANDIDATE; timestamps are integer datetime values; TICK_VOLUME identifies tick counts explicitly. Notes and symbols use quoted UTF-8 fields with doubled embedded quotation marks. The parser preserves commas and line breaks within quoted fields. Notes are limited to 256 characters.
The library holds an exclusive file lock while open. Saving validates the sample, writes UTF-8 bytes to a temporary file, checks the byte count, flush status and size, and moves the completed file to its final name without replacement permission. Existing sample files are never overwritten. Floating-point values are written with 17 significant digits, independently of the active chart’s precision. This is not a claim of crash-atomic storage.
//+------------------------------------------------------------------+
//| Publishes checked UTF-8 without replacing an existing sample     |
//+------------------------------------------------------------------+
bool SaveSampleToFile(const SPatternSample &sample)
  {
   if(!ValidatePatternSample(sample))
      return(false);
   string filename = GetPatternFolder(sample.pattern_type) + "SAMPLE_" + IntegerToString(sample.id) + ".csv";
   if(FileIsExist(filename))
      return(false);
   string text = SAMPLE_META + "\r\n";
   text += "2," + IntegerToString(sample.id) + ",DOUBLE_BOTTOM_CANDIDATE," + PatternCsvField(sample.symbol) + "," +
           IntegerToString((int)sample.timeframe) + "," + IntegerToString((long)sample.start_time) + "," +
           IntegerToString((long)sample.end_time) + "," + IntegerToString(sample.bars) + "," +
           PatternNumber(sample.price_high) + "," + PatternNumber(sample.price_low) + "," + PatternCsvField(sample.notes) + "\r\n";
   text += SAMPLE_COLUMNS + "\r\n";
   for(int i = 0; i < sample.bars; i++)
     {
      SCandleData c = sample.candles[i];
      text += IntegerToString(i) + "," + IntegerToString((long)c.time) + "," +
              PatternNumber(c.open) + "," + PatternNumber(c.high) + "," + PatternNumber(c.low) + "," +
              PatternNumber(c.close) + "," + IntegerToString(c.tick_volume) + "," +
              PatternNumber(c.range) + "," + PatternNumber(c.body) + "," +
              PatternNumber(c.upper_wick) + "," + PatternNumber(c.lower_wick) + "," +
              IntegerToString((int)c.direction) + "," + PatternNumber(c.norm_open) + "," +
              PatternNumber(c.norm_high) + "," + PatternNumber(c.norm_low) + "," + PatternNumber(c.norm_close) + "\r\n";
     }
   uchar bytes[];
   int count = StringToCharArray(text, bytes, 0, WHOLE_ARRAY, CP_UTF8)-1;
   if(count < 1 || count > 67108864)
      return(false);
   string temp = filename + ".tmp";
   int handle = FileOpen(temp, FILE_WRITE|FILE_BIN);
   if(handle == INVALID_HANDLE)
      return(false);
   ResetLastError();
   bool ok = (FileWriteArray(handle, bytes, 0, count) == (uint)count);
   FileFlush(handle);
   ok = ok && GetLastError() == 0 && FileSize(handle) == (ulong)count;
   FileClose(handle);
//--- Publish only the complete file; never use FILE_REWRITE here.
   if(!ok || !FileMove(temp, 0, filename, 0))
     {
      FileDelete(temp);
      return(false);
     }
   return(true);
  }
The loader validates both headers, the format version, candidate category, filename/record ID agreement, supported timeframe, row count, chronological order, OHLC bounds, tick counts, derived candle geometry, direction and normalized values. It rejects truncated files, extra rows, malformed numbers and invalid UTF-8. A failed load does not replace the caller's sample.
The normalization reference is reconstructed from the first close. Stored normalized values must agree with the raw prices within the validation tolerance before the sample is accepted. The complete reader and validation helpers are included in PatternStorage.mqh.
4. PatternLibrary.mqh
CPatternLibrary holds the collection and an exclusive lock on its candidate folder. A second recorder using the same terminal folder fails initialization. Loading accepts only canonical SAMPLE_<positive ID>.csv filenames. The next ID advances past every recognized filename, including rejected files, so a corrupt file cannot be silently replaced. IDs are local to this folder, not globally unique; manually copied files require independent ID management.
Adding a sample follows a small transaction-like sequence. The library first rejects a duplicate ID, appends the sample in memory, and then asks the storage layer to save it. If saving fails, the array is resized to its former length. That rollback prevents the panel from reporting a sample that exists only in memory and will disappear on restart.
Removal takes the opposite order. The library finds the sample, deletes its file and only then compacts the array. If file deletion fails, the in-memory record remains intact. This ordering keeps both representations aligned as far as a simple local system can.
5. PatternRecorderPanel.mqh
The recorder interface uses standard chart objects rather than an external GUI framework. Labels present the title, pattern type, status, selection details and sample count. Buttons start selection, record, cancel, list samples, delete the chosen sample and close the panel. An edit control captures notes.
Every object name begins with PatternRecorder_, except the known selection rectangle. The prefix serves two purposes: event filtering and cleanup. OnChartEvent() ignores unrelated chart objects, while DeleteObjectsWithPrefix() can remove the dynamic sample buttons without disturbing a trader's drawings.
//+------------------------------------------------------------------+
//| Chart event handler                                              |
//+------------------------------------------------------------------+
void CRecorderPanel::OnChartEvent(const int id, const long &lparam, const double &dparam, const string &sparam)
  {
   if(id == CHARTEVENT_OBJECT_CLICK)
     {
      string name = sparam;
      if(!IsMyObject(name))
         return;

      if(StringFind(name, m_sample_prefix) == 0)
         OnSampleClick(name);
      else if(name == m_btn_select_name)
         OnSelectFormation();
      else if(name == m_btn_record_name)
         OnRecord();
      else if(name == m_btn_cancel_name)
         OnCancel();
      else if(name == m_btn_view_name)
         OnViewSamples();
      else if(name == m_btn_delete_name)
         OnDeleteSample();
      else if(name == m_btn_close_name)
         OnClose();
     }
  }
The panel maintains explicit state. m_isSelectionMode records whether a selection is active, m_hasPending indicates that extraction has produced a sample, and m_selected_sample_id identifies a record chosen from the list. This state prevents Record from running before Select Formation and prevents Delete Selected from acting without a valid selection.
6. DoubleBottomRecorderEA.mq5
The main .mq5 file is intentionally short. During OnInit(), it creates a library for PATTERN_DOUBLE_BOTTOM_CANDIDATE. The library constructor loads existing records before the panel is created, so the first displayed count reflects disk storage. If panel creation fails, allocated objects are released and initialization returns INIT_FAILED.
OnChartEvent() delegates chart interaction to the panel. OnDeinit() deletes the panel first and the library second because the panel holds a pointer to the library. The panel destructor removes its chart objects, including the selection rectangle, and the library then releases its in-memory data.
//+------------------------------------------------------------------+
//| Initializes the recorder expert                                  |
//+------------------------------------------------------------------+
int OnInit()
  {
//--- Create the in-memory library and load previously saved samples
   g_library = new CPatternLibrary(PATTERN_DOUBLE_BOTTOM_CANDIDATE);
   if(g_library == NULL)
      return(INIT_FAILED);
   if(!g_library.IsReady())
     {
      Print("Library unavailable: another recorder may hold the storage lock.");
      delete g_library;
      g_library = NULL;
      return(INIT_FAILED);
     }
   Print("Pattern Library loaded. Samples found: ", g_library.GetSampleCount());

//--- Create the optional chart interface
   if(Input_ShowPanel)
     {
      //--- Stop initialization if either allocation or UI creation fails
      g_panel = new CRecorderPanel();
      if(g_panel == NULL || !g_panel.Create(g_library, 0, 0, Input_PanelX, Input_PanelY))
        {
         if(g_panel != NULL)
           {
            delete g_panel;
            g_panel = NULL;
           }
         delete g_library;
         g_library = NULL;
         return(INIT_FAILED);
        }
     }
   return(INIT_SUCCEEDED);
  }
There is no OnTick() because recording is driven by user events rather than market ticks. Avoiding unnecessary tick processing keeps the EA focused and prevents repeated work whenever a new quote arrives.
Installing and operating the completed recorder
Place DoubleBottomRecorderEA.mq5 in MQL5\Experts\PatternRecorder. Place the five .mqh files in MQL5\Include\PatternRecorder. Preserve the supplied include paths. Open the main file in MetaEditor and compile it.
To record a sample, click Select Formation. Move and resize the blue rectangle until its time span covers the intended pattern. Enter a short note describing useful context, such as the preceding trend, a news event or why the formation was selected. Click Record. A successful operation assigns an ID, saves the CSV file, removes the rectangle and refreshes the sample count.
Click View Samples to show recent records. Select an entry before using Delete Selected. Deletion is immediate, so the trader should check the highlighted ID before pressing the button. A future interface can add a confirmation step or an archive state.
Testing
The recorder was tested on a USDCAD H4 chart in MetaTrader 5, build 6182, using the Deriv-Demo server. The tests covered rejected recording attempts, sample creation, CSV calculations, recovery after restarting the terminal and deletion.
Recording and input handling
The library initially contained sample #1. Pressing Record without activating a selection displayed: Please click SELECT FORMATION first. The recorded sample count remained at one.
I then activated the selection rectangle and narrowed its time span to contain fewer than two candles. Recording was rejected, and the sample count again remained unchanged.
After widening the selection, recording succeeded. The panel reported that sample #2 had been recorded, and the count increased from one to two. Opening View Samples showed the new entry with eight candles.
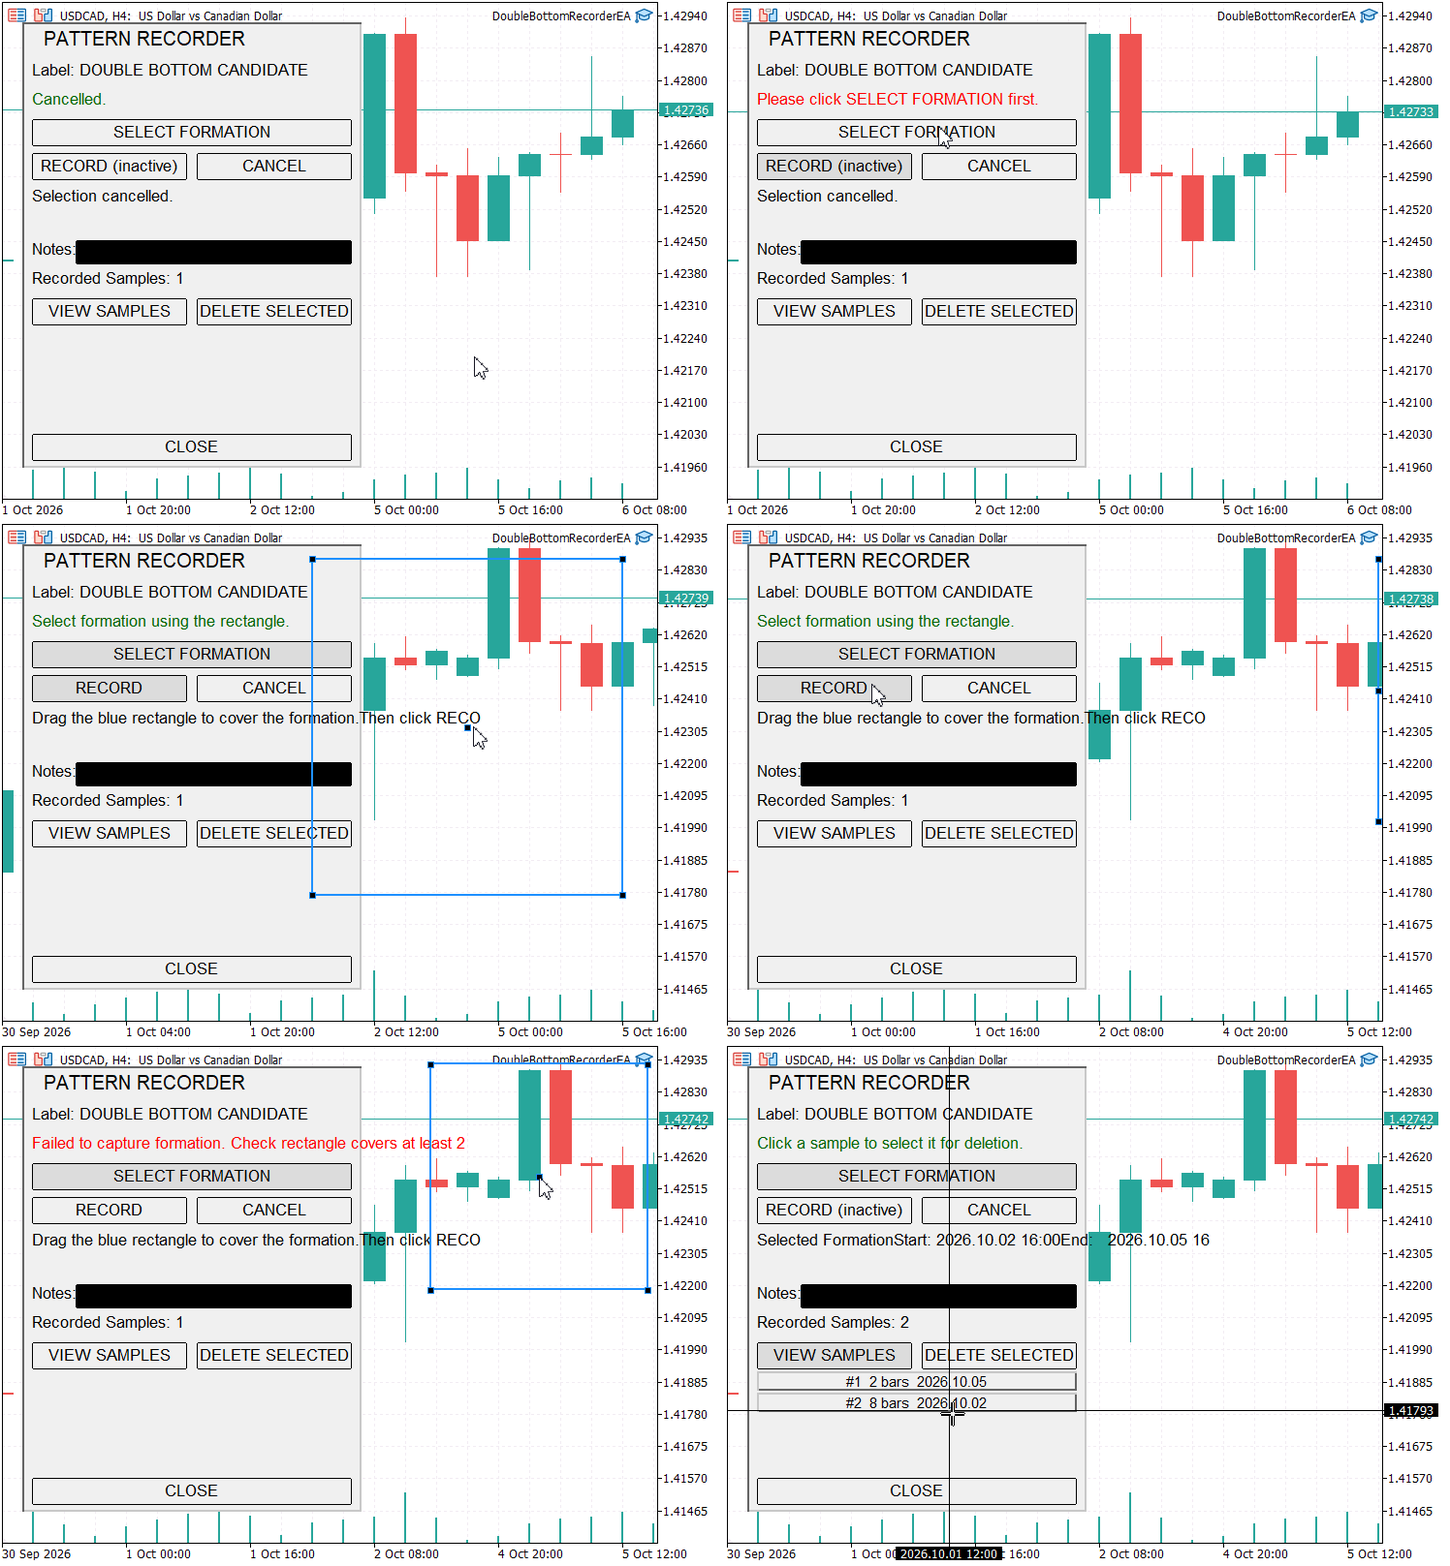
Figure 3. Rejected recording attempts followed by successful creation of an eight-candle USDCAD H4 sample.
CSV contents and calculations
The recorder saved the sample as SAMPLE_2.csv under MQL5\Files\PatternLibrary\DOUBLE_BOTTOM_CANDIDATE\. Its metadata identified sample #2, the DOUBLE_BOTTOM_CANDIDATE category, USDCAD and the H4 timeframe. The file contained eight candle rows, indexed from 0 to 7.
The first stored candle was dated 2 October 2026 at 16:00, and the last was dated 5 October 2026 at 16:00. These times matched the selection details displayed by the panel. The timestamps were strictly increasing, with a gap between Friday and Sunday. The file therefore preserved the available candle sequence rather than inserting rows for every elapsed four-hour interval.
The sample’s highest price was 1.42936, recorded in candle 4. Its lowest price was 1.42375, reached by candles 5 and 6. Both values agreed with the stored metadata.
For candle 0, the recorded prices were:
| Field | Value |
|---|---|
| Open | 1.42543 |
| High | 1.42614 |
| Low | 1.42505 |
| Close | 1.42521 |
These values produced a range of 0.00109, a body of 0.00022, an upper wick of 0.00071 and a lower wick of 0.00016. The candle was classified as bearish, with direction value 1. Recalculating the derived fields across all eight rows found no inconsistencies with the stored OHLC values.
The first close, 1.42521, served as the normalization reference, making its normalized close zero. Candle 4’s high of 1.42936 produced a normalized high of approximately 0.2911851587%. The remaining normalized values also agreed with the percentage-offset calculation.
These checks establish internal consistency between the raw and calculated fields. The notes field was empty, so this chart test did not exercise note preservation.
Recovery after restarting
After recording sample #2, I closed and reopened MetaTrader 5. The panel displayed two recorded samples. Opening View Samples showed sample #1 with two candles and sample #2 with eight candles.
This confirmed that the recorded sample remained available after the terminal session ended and was loaded into the library on restart.
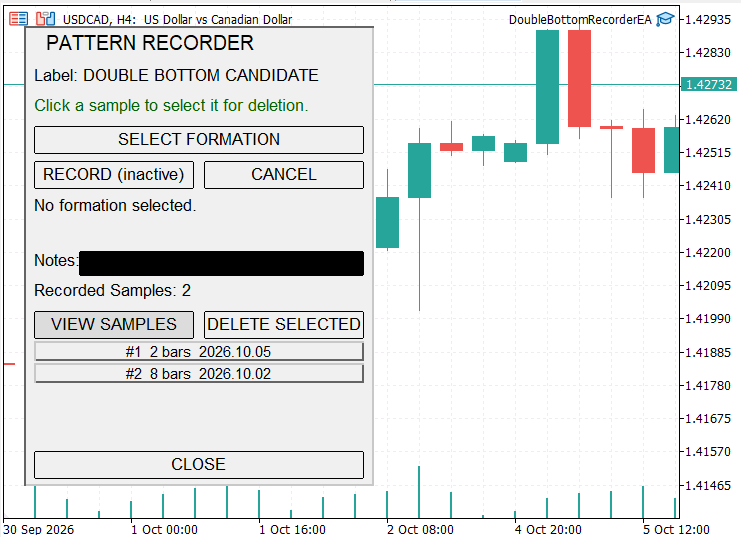
Figure 4. The sample list after restarting MetaTrader 5, showing both stored records.
Deletion and persistence
I selected sample #1 and pressed Delete Selected. Its entry disappeared from the panel, and the recorded sample count decreased from two to one. Checking the storage folder confirmed that SAMPLE_1.csv had also been removed.
I then closed and reopened MetaTrader 5 again. The panel still showed one recorded sample, and View Samples listed only sample #2 with its eight candles. The deleted record remained absent, while the retained record loaded successfully.
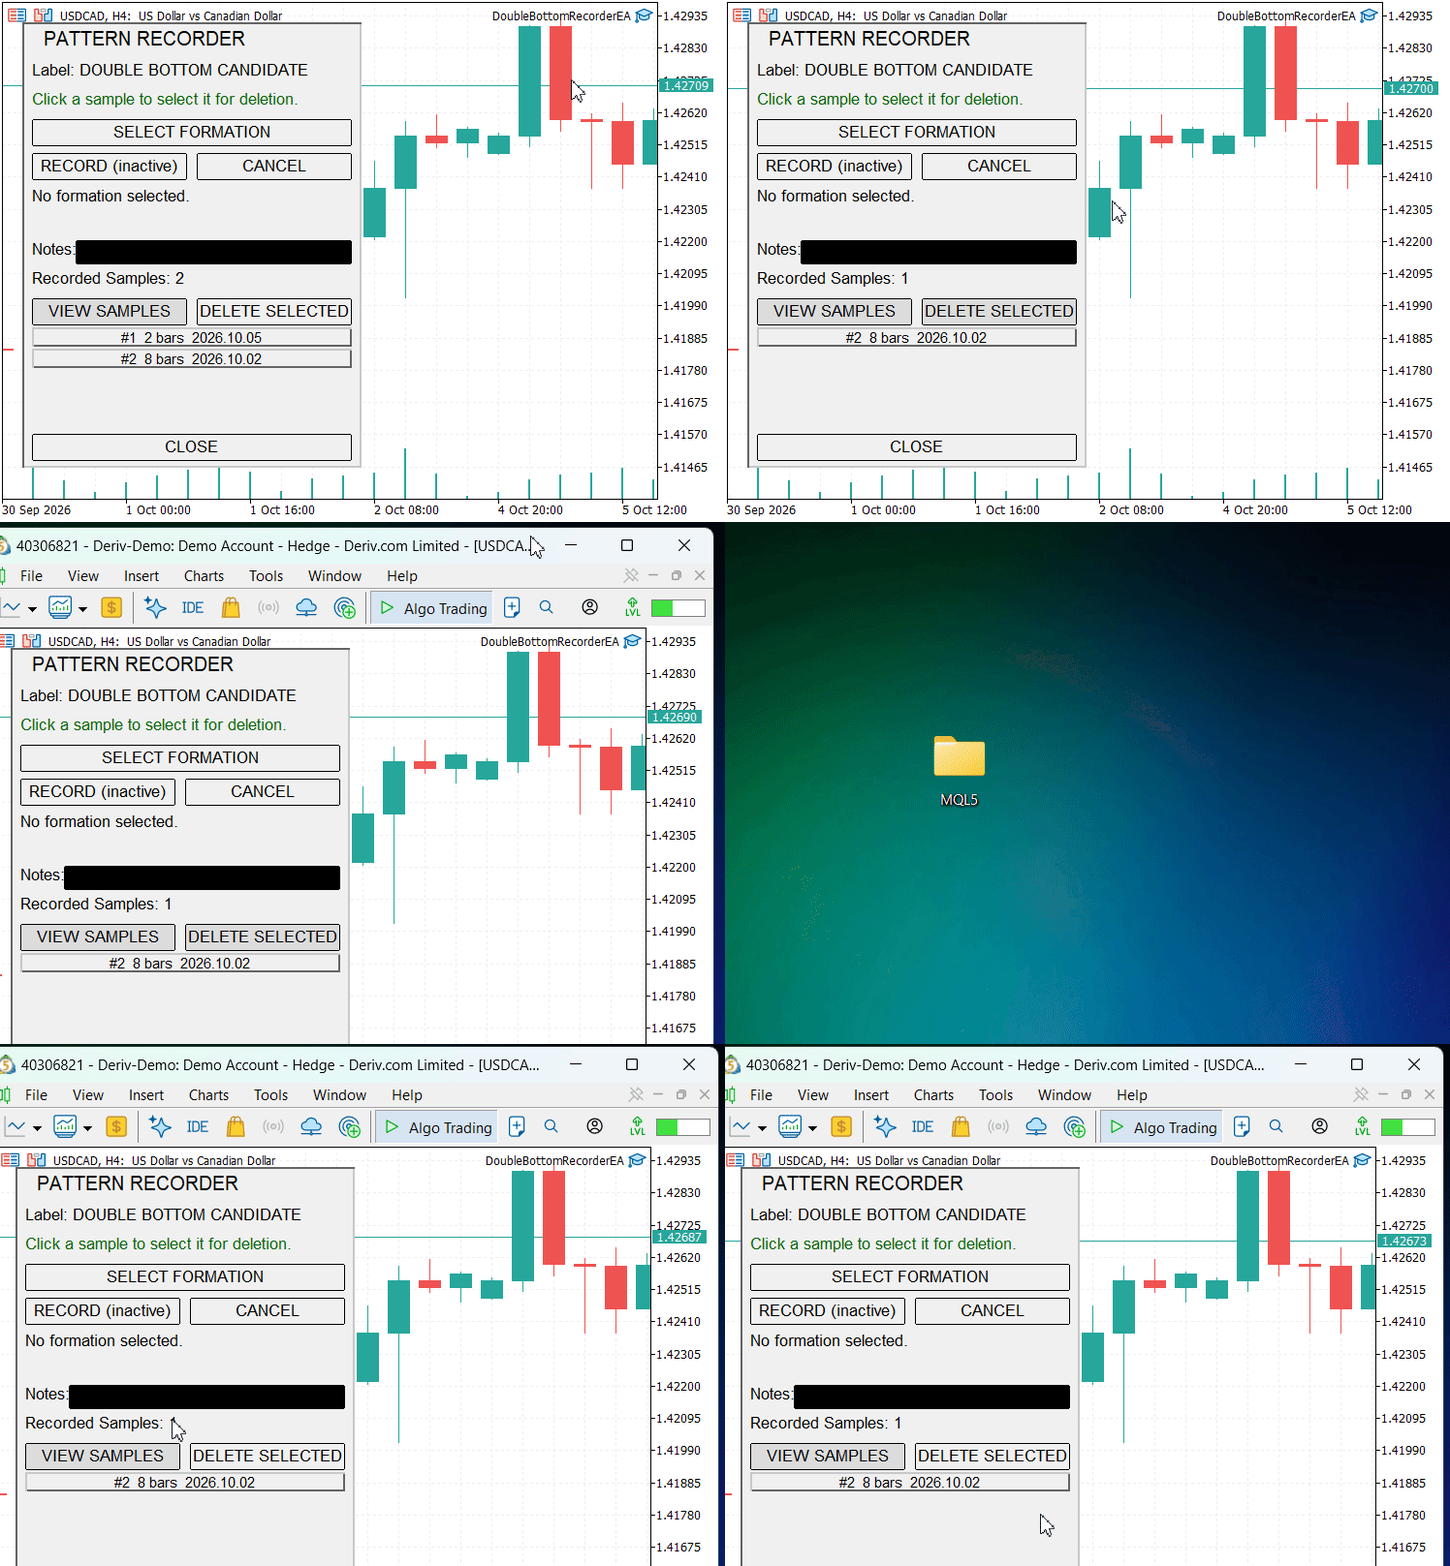
Figure 5. Deleting sample #1 and restarting the terminal, with sample #2 remaining in the library.
These observations demonstrate the recording and sample-management workflow on USDCAD H4. They do not establish behavior across other instruments or timeframes, or confirm that the selected sequence satisfies double-bottom validation rules.
Conclusion
This part establishes the recording stage of a double-bottom research workflow. It provides a consistent capture process and persistent storage for manually selected candidates. The recorder developed in this article converts a trader's chart selection into a structured sequence containing raw candles, derived candle geometry and normalized prices. It then manages those sequences through a small persistent library and an event-driven chart panel.
The six-file architecture keeps user interaction, extraction, normalization, storage and collection management separate. That separation is the practical result of this stage: future validation and analysis can evolve without requiring the recorder to be rebuilt.
The system is useful today as a way to collect and inspect manually selected double-bottom candidates. Its larger purpose is to provide clean inputs for the next stage, where the label will be challenged by measurable rules and the recorded formations can be evaluated rather than simply remembered.
Attachments
The following files form the complete recorder project. The Expert Advisor belongs in the terminal's Experts directory, while the reusable headers belong in a dedicated Include subfolder. The source archive contains the same six files for convenient distribution with the article.
| File | Type | Responsibility |
|---|---|---|
| DoubleBottomRecorderEA.mq5 | Expert Advisor | Initializes the library and panel, forwards chart events and releases application resources. |
| PatternData.mqh | Include | Defines pattern and candle structures together with shared data helpers. |
| PatternExtractor.mqh | Include | Extracts selected bars, calculates candle features and normalizes the sample. |
| PatternStorage.mqh | Include | Writes, reads, discovers and deletes sample CSV files. |
| PatternLibrary.mqh | Include | Manages the in-memory collection and coordinates persistence. |
| PatternRecorderPanel.mqh | Include | Implements selection, recording, sample viewing and deletion controls. |
| MQL5.zip | Archive | Complete project archive containing all source files arranged in the required MetaTrader 5 directory structure. The simplest installation method is to extract MQL5.zip into the terminal's Data Folder. For manual installation, preserve the Experts and Include locations used in the archive, then compile DoubleBottomRecorderEA.mq5 in MetaEditor. |
Warning: All rights to these materials are reserved by MetaQuotes Ltd. Copying or reprinting of these materials in whole or in part is prohibited.
This article was written by a user of the site and reflects their personal views. MetaQuotes Ltd is not responsible for the accuracy of the information presented, nor for any consequences resulting from the use of the solutions, strategies or recommendations described.

 How to Test and Customize Built-in MQL5 Programs: Envelopes with Alligator Strategy
 Certified Robustness Radius: Knowing How Much Noise Your ONNX Trading Model Can Survive
 Machine Learning Under Constraint (Part 3): De-Risking Near the Profit Target and the News-Window Rule
 Neural Networks in Trading: From Transformers to Spiking Neurons (Conclusion)

- Free trading apps
- Over 8,000 signals for copying
- Economic news for exploring financial markets
You agree to website policy and terms of use