

Building a Future Swing Projection Indicator in MQL5
 1 712
1 712
 1
1

Introduction
Traders using MetaTrader 5 often analyze previous price swings manually to estimate how far the next swing may extend. This process is subjective, time-consuming, and difficult to reproduce because swing identification, measurement rules, and projection methods are not clearly defined. To solve this problem, we developed a rule-based MQL5 indicator that automatically formalizes swing detection, swing measurement, and future movement projection using consistent algorithmic rules.
The indicator:
- Recalculates once for each newly completed bar;
- Identifies swing highs and swing lows using a customizable Swing Detection Length and confirmation from the following candle;
- Determines the current market structure direction from the latest confirmed pivot and applies different projection logic for bullish and bearish conditions;
- Identifies the latest sequence of six alternating swing points (three highs and three lows, or vice versa), creating five completed swing legs for analysis;
- Measures the five completed swing movements, calculates the average swing size, and applies this value to the latest confirmed swing to estimate the potential next move;
- Draws historical structure lines, a dotted projection line for a user-defined number of bars ahead, ATR-scaled support and resistance zones around key levels, and a label displaying the projected price level.
Project Overview and Implementation Plan
Understanding the concept and behavior of the future swing projection indicator is essential before beginning the implementation phase. A clear understanding of how historical swing movements are analyzed, measured, and used to estimate potential future price movement helps define the purpose of each component and creates a structured approach to the development process.
What We Are Building
In this project, we are building a Future Swing Projection Indicator that analyzes historical market swings and uses their measured characteristics to estimate potential future price movement. The indicator identifies a sequence of six alternating swing points, consisting of three swing highs and three swing lows in a potential upward market structure, or three swing lows and three swing highs in a potential downward market structure. These six points create five completed swing legs, where each leg represents the price distance between two consecutive swing points.
Potential upward market projection:
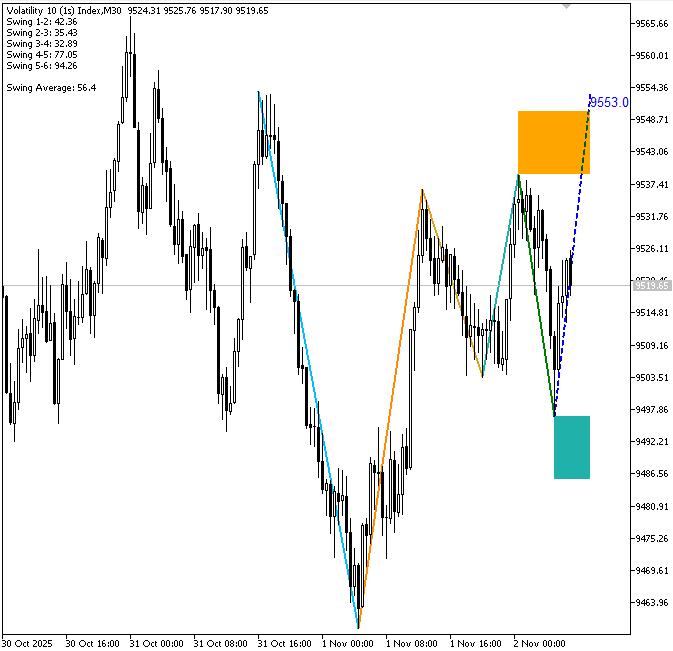
Potential downward market projection:
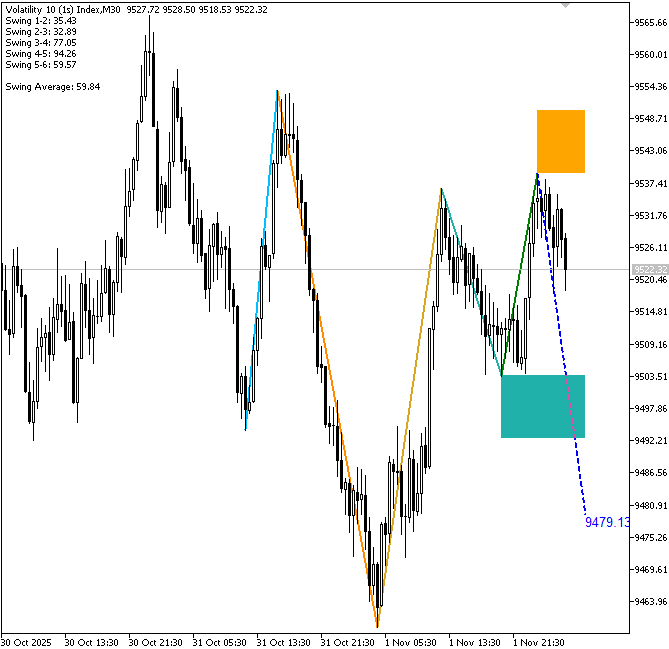
Note: To avoid repetition, the swing identification process will be explained using a potential bullish market structure, where the logic searches for alternating swing lows and swing highs. A potential bearish market structure follows the same principles with inverted conditions. However, the projection logic changes according to the detected direction: in a bullish structure, the calculated swing movement is projected upward from the latest confirmed swing low, while in a bearish structure, the same movement is projected downward from the latest confirmed swing high. The detected market direction therefore determines both the projection anchor point and the direction of the future movement displayed on the chart.
Implementation Plan
In this section, we will first describe the detailed development plan that will be used in MQL5 before going on to the actual implementation phase. This method offers a structured roadmap for effectively constructing the indicator and aids in establishing a clear understanding of each project stage.
1. Defining Swing High/Low Rules and Calculation Conditions
Before analyzing the swing structure for future projection, the indicator first determines the current market direction. This step identifies whether the market is showing potential upward or downward market structure movement by examining recent price behavior. Establishing the current direction provides the foundation for selecting the appropriate swing sequence during the later stages of the projection process.
In this step, the indicator:
- Checks whether enough historical candles are available before performing swing analysis;
- Uses the selected swing detection length to ensure sufficient data exists for evaluating market movement;
- Monitors the opening time of the current bar to control the calculation process and avoid repeating the same analysis on every tick;
- Processes historical price data starting from the most recent completed candle;
- Evaluates potential swing highs and swing lows based on previous price levels;
- Determines an upward market structure when a valid swing low condition indicates a potential upward market movement;
- Determines a downward market structure when a valid swing high condition indicates a potential downward market movement;
- Stores the detected market direction for use in the subsequent swing identification and projection process.
The detected direction determines whether the indicator searches for a bullish sequence beginning with a swing low or a bearish sequence beginning with a swing high, and later controls whether the projected movement is drawn upward or downward from the latest confirmed swing point.
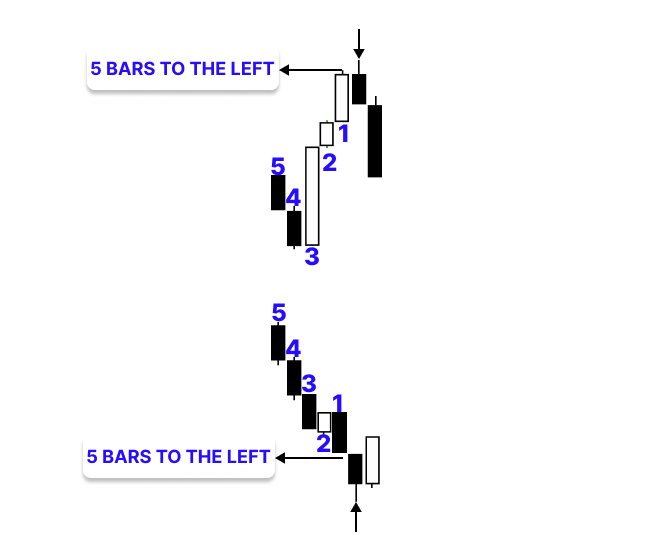
The indicator determines potential swing highs and swing lows by comparing each candle with recent price movement within the selected lookback range and confirming its relationship with the next candle. A potential swing high, for instance, is detected when the high of the current candle is both higher than the high of the subsequent candle and greater than or equal to the highs of the preceding five candles with a lookback value of 5. Similarly, a potential swing low is detected when the low of the current candle is both lower than the low of the subsequent candle and lower than or equal to the lows of the preceding five candles.
2. Identifying Six Alternating Swing Points Based on Market Direction
After determining the current market direction, the indicator searches historical price data to locate the swing sequence required for future movement projection. This step identifies six alternating swing points that represent the most recent completed market structure. These swing points are used as reference points for measuring previous price movements and calculating the potential size of the next swing.
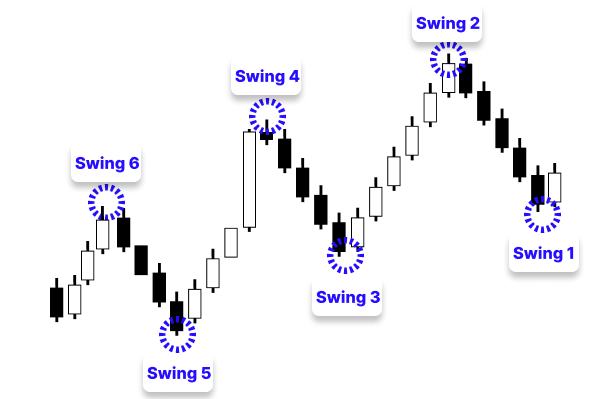
The order of the swing points depends on the detected market direction. In a potential upward market structure, the indicator begins with a swing low and identifies six alternating swing points in the sequence of Swing 1 (swing low), Swing 2 (swing high), Swing 3 (swing low), Swing 4 (swing high), Swing 5 (swing low), and Swing 6 (swing high). In a potential downward market structure, the same alternating principle is applied in reverse, beginning with a swing high and identifying Swing 1 (swing high), Swing 2 (swing low), Swing 3 (swing high), Swing 4 (swing low), Swing 5 (swing high), and Swing 6 (swing low). This approach allows the indicator to analyze both bullish and bearish market structures using the same swing detection rules while adjusting the sequence according to the current direction.
During this step, the indicator:
- Starts searching from the most recent completed candle and moves backward through historical price data;
- Identifies the first valid swing point according to the detected market direction;
- Searches for alternating swing points until six valid points are found;
- Stores the swing prices and corresponding times for later measurement and visualization.
The identified swing sequence represents five completed swing legs. These completed movements provide the historical data required to calculate the typical swing size used for the future projection.
3. Measuring Swing Legs and Calculating the Average Movement
After identifying the six alternating swing points, the indicator measures the price movement between each consecutive pair of points to determine the size of the completed market swings. Each movement between two neighboring swing points is treated as a swing leg, resulting in five completed legs that represent the historical price distance covered during previous market movements. These measurements provide the statistical basis for estimating the potential size of the next swing.
The indicator:
- Calculates the movement distance between each consecutive swing pair (Swing 1 to Swing 2, Swing 2 to Swing 3, Swing 3 to Swing 4, Swing 4 to Swing 5, and Swing 5 to Swing 6) to obtain the five completed swing legs;
- Calculates the percentage movement of each swing leg to normalize the measurement across different price levels and instruments;
- Combines the five completed swing measurements using the selected calculation method to determine the representative swing size;
- Uses the resulting value as the expected movement distance for projecting the potential next swing.
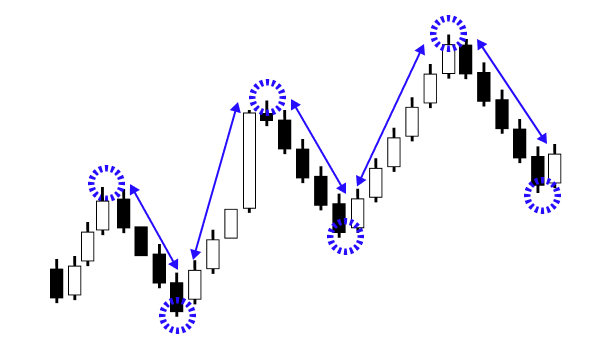
4. Visualizing the Swing Structure, Projection, and ATR-Based Zones
After identifying the six swing points and calculating the representative swing movement, the indicator converts the analysis into visual objects displayed directly on the chart. It connects the historical swing points to show the five completed swing legs and applies the calculated movement to the latest confirmed swing point to estimate the potential next move. In addition, ATR-based zones and information labels are added around important price levels to provide further context for interpreting the projection.
The indicator:
- Draws five structure lines connecting the six identified swing points;
- Calculates the future projection point using the representative swing movement and projection offset;
- Applies the projection according to the detected market direction, moving upward from the latest swing low in bullish structures and downward from the latest swing high in bearish structures;
- Displays a dotted projection line showing the potential future price movement.
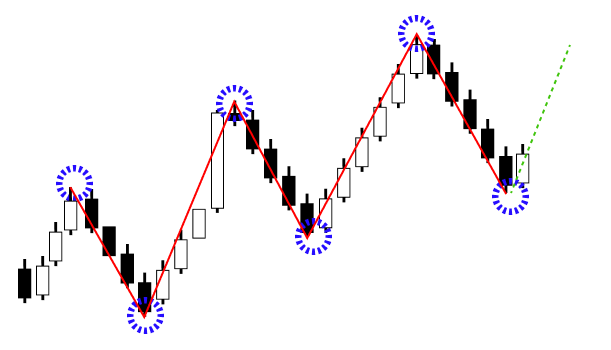
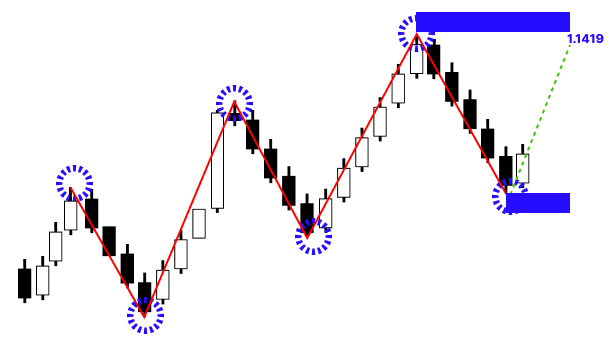
After displaying the projected movement, the indicator enhances the chart visualization by adding volatility-based zones and additional information. These elements help the trader evaluate the projected price level in relation to recent swing areas and current market conditions.
The indicator:
- Creates ATR-based support and resistance zones around important swing levels;
- Adjusts the zone size according to current market volatility;
- Displays labels containing the projected price level and swing measurement information;
- Updates and manages chart objects to maintain a clear representation of the projected market scenario.
Note: The project discussed in this article is entirely project-based and intended to teach readers MQL5 through real-world, hands-on application. It is not a guaranteed method for making profits in live trading.
Implementation in MQL5
We can begin the implementation in MQL5 now that the project requirements and implementation strategy have been discussed. The indicator will be developed step-by-step in this section, with each design stage translated into functional code and each component's purpose and reasoning explained.
Defining Swing High/Low Rules and Calculation Conditions
As planned, step one is:
Example:
#property indicator_chart_window
#property indicator_buffers 0
#property indicator_plots   0

input int    InpLen         = 30;    // Swing Detection Length

datetime last_bar_time; // Stores the last processed candle time
//+------------------------------------------------------------------+
//| Custom indicator initialization function                         |
//+------------------------------------------------------------------+
int OnInit()
  {
//---

//---
   return(INIT_SUCCEEDED);
  }
//+------------------------------------------------------------------+
//| Custom indicator deinitialization function                       |
//+------------------------------------------------------------------+
void OnDeinit(const int reason)
  {

  }
//+------------------------------------------------------------------+
//| Custom indicator iteration function                              |
//+------------------------------------------------------------------+
int OnCalculate(const int32_t rates_total,
                const int32_t prev_calculated,
                const datetime &time[],
                const double &open[],
                const double &high[],
                const double &low[],
                const double &close[],
                const long &tick_volume[],
                const long &volume[],
                const int32_t &spread[])
  {
//--- Ensure enough historical candles are available for swing detection
   if(rates_total <= InpLen)
      return(0);

//--- Get the opening time of the current bar
   datetime currentBarTime = iTime(_Symbol, PERIOD_CURRENT, 0);

//--- Execute the analysis only once per newly formed bar
   if(currentBarTime != last_bar_time)
     {
      bool isGup = false; // true = potential upward market movement, false = potential downward market movement

      //--- Scan historical candles to determine the current market direction
      for(int i = rates_total - 2; i > InpLen; i--)
        {
         double H = high[i];
         double L = low[i];

         //--- Check whether the latest confirmed swing is a swing high
         if(i + 1 <= rates_total - 2 && IsSwingHigh(high, i, InpLen) && H > high[i + 1])
           {
            isGup = false; // Latest swing is a high -> potential downward market movement
            break;
           }
         //--- Otherwise, check whether the latest confirmed swing is a swing low
         else
            if(i + 1 <= rates_total - 2 && IsSwingLow(low, i, InpLen) && L < low[i + 1])
              {
               isGup = true; // Latest swing is a low -> potential upward market movement
               break;
              }
        }

      //--- Store the current bar time to avoid recalculating on every tick
      last_bar_time = currentBarTime;
     }

//--- return value of prev_calculated for next call
   return(rates_total);
  }
//+------------------------------------------------------------------+
//| Check whether a candle is a swing high                           |
//+------------------------------------------------------------------+
bool IsSwingHigh(const double &high[], int index, int lookback)
  {
//--- Compare the current high with the previous highs
   for(int i = 1; i <= lookback; i++)
     {
      if(high[index] < high[index - i])
         return false;
     }

   return true;
  }

//+------------------------------------------------------------------+
//| Check whether a candle is a swing low                            |
//+------------------------------------------------------------------+
bool IsSwingLow(const double &low[], int index, int lookback)
  {
//--- Compare the current low with the previous lows
   for(int i = 1; i <= lookback; i++)
     {
      if(low[index] > low[index - i])
         return false;
     }

   return true;
  }
//+------------------------------------------------------------------+
Explanation:
Determining the indicator's fundamental configuration is the first step. Since the indicator does not use conventional indicator buffers or graphical plots, indicator_buffers and indicator_plots are set to zero. The indicator_chart_window attribute indicates that the indicator will be shown immediately on the primary price chart. Instead, all visual elements will be created using chart objects. The InpLen input parameter defines the swing detection lookback period, which determines how many previous candles are considered when validating swing highs and lows. The last_bar_time variable stores the time of the last processed candle, allowing the indicator to control when calculations should be performed.
The indicator initially confirms that there are sufficient historical candles available before beginning any swing identification computation. The computation cannot proceed if the total number of candles available is equal to or less than InpLen because swing identification necessitates comparing the current candle with past candles based on the chosen lookback period. This keeps the indicator from accessing candle data that isn't available and guarantees that swing analysis is only carried out when there is enough previous data.
The indicator identifies price turning points by validating swing highs and lows based on the selected lookback period. A swing high must have the highest price compared to the previous candles, while a swing low must have the lowest price. An additional comparison with the following candle confirms the swing point as a valid turning point rather than a temporary movement. Using iTime(), the indicator gets the current candle's open time and compares it with the last bar time. To avoid repeating the identical computations on each incoming tick, the current candle time is saved in last_bar_time after processing. This ensures swing analysis runs once per new candle and improves efficiency.
After confirming that a new candle has formed, the indicator begins determining the potential current market direction. It initializes the isGup variable, which stores the detected directional bias, where true represents potential upward movement and false represents potential downward movement. The indicator then scans historical candles from the most recent completed candle backward and checks each candle for a valid swing high or swing low. If the latest confirmed structure is a swing high that exceeds the following candle's high, the indicator considers the market to have potential downward movement. If the latest confirmed structure is a swing low that falls below the following candle's low, the indicator considers the market to have potential upward movement. This directional assessment is then used in later stages to determine which swing structure should be analyzed and projected.
Identifying Six Alternating Swing Points Based on Market Direction
The second step of the implementation is to identify six alternating swing points for projection.
Note: We will highlight the specific code sections related to each implementation stage as we progress, ensuring each part is clearly understood on its own without mixing it with previously explained sections.
//--- Execute the analysis only once per newly formed bar
if(currentBarTime != last_bar_time)
  {
   bool isGup = false; // true = potential upward market movement, false = potential downward market movement

//--- Scan historical candles to determine the current market direction
   for(int i = rates_total - 2; i > InpLen; i--)
     {
      double H = high[i];
      double L = low[i];

      //--- Check whether the latest confirmed swing is a swing high
      if(i + 1 <= rates_total - 2 && IsSwingHigh(high, i, InpLen) && H > high[i + 1])
        {
         isGup = false; // Latest swing is a high -> potential downward market movement
         break;
        }
      //--- Otherwise, check whether the latest confirmed swing is a swing low
      else
         if(i + 1 <= rates_total - 2 && IsSwingLow(low, i, InpLen) && L < low[i + 1])
           {
            isGup = true; // Latest swing is a low -> potential upward market movement
            break;
           }
     }

//--- Potential upward market structure
   if(isGup == true)
     {
      for(int i = rates_total - 2; i > InpLen; i--)
        {
         //--- Search for the first swing low as the starting point
         if(i + 1 <= rates_total - 2 && IsSwingLow(low,i,InpLen) && low[i] < low[i + 1])
           {
            //--- i = Swing 1 (Low)
            for(int j = i; j >= InpLen; j--)
              {
               //--- Search for the next swing high
               if(IsSwingHigh(high,j,InpLen) && high[j] > high[j + 1])
                 {
                  //--- j = Swing 2 (High)
                  for(int k = j; k >= InpLen; k--)
                    {
                     //--- Search for the next swing low
                     if(IsSwingLow(low,k,InpLen) && low[k] < low[k + 1])
                       {
                        //--- k = Swing 3 (Low)
                        for(int l = k; l >= InpLen; l--)
                          {
                           //--- Search for the next swing high
                           if(IsSwingHigh(high,l,InpLen) && high[l] > high[l + 1])
                             {
                              //--- l = Swing 4 (High)
                              for(int m = l; m >= InpLen; m--)
                                {
                                 //--- Search for the next swing low
                                 if(IsSwingLow(low,m,InpLen) && low[m] < low[m + 1])
                                   {
                                    //--- m = Swing 5 (Low)
                                    for(int n = m; n >= InpLen; n--)
                                      {

                                       //--- Search for the final swing high
                                       if(IsSwingHigh(high,n,InpLen) && high[n] > high[n + 1])
                                         {
                                          //--- n = Swing 6 (High) - six swing points identified, draw structure

                                          break;
                                         }
                                      }
                                    break;
                                   }
                                }
                              break;
                             }
                          }
                        break;
                       }
                    }
                  break;
                 }
              }
            break;
           }
        }
     }
//--- Store the current bar time to avoid recalculating on every tick
   last_bar_time = currentBarTime;
  }
//+------------------------------------------------------------------+
Explanation:
After identifying a potential upward market movement, the indicator begins searching for six alternating swing points that will define the structure used for projection. The process starts by scanning historical candles from the most recent completed candle backward. The first point it searches for is a valid swing low, which becomes Swing 1. This swing low represents the starting point of the potential upward structure and must satisfy the swing validation conditions before it is accepted. After Swing 1 is identified, the indicator continues backward through the chart to find the next valid swing high, which becomes Swing 2.
This creates the first upward leg of the structure, moving from the initial low point to a higher turning point. The same process continues by alternating between swing lows and swing highs, allowing the indicator to map the sequence of price movements. The third point found is Swing 3 (Low), representing a retracement after Swing 2. The indicator then searches for Swing 4 (High), which marks the next upward movement. After that, it identifies Swing 5 (Low) as the next pullback before searching for the final point, Swing 6 (High). Once all six swing points are located, the indicator has a complete potential upward structure.
Measuring Swing Legs and Calculating the Average Movement
This third step measures swing legs and calculates average movement.
Example:
double s1_s2_interval; // distance between Swing 1 and Swing 2
double s2_s3_interval; // distance between Swing 2 and Swing 3
double s3_s4_interval; // distance between Swing 3 and Swing 4
double s4_s5_interval; // distance between Swing 4 and Swing 5
double s5_s6_interval; // distance between Swing 5 and Swing 6
double avg_price;      // average distance of the five completed swing legs
//--- Potential upward market structure
if(isGup == true)
  {
   for(int i = rates_total - 2; i > InpLen; i--)
     {
      //--- Search for the first swing low as the starting point
      if(i + 1 <= rates_total - 2 && IsSwingLow(low,i,InpLen) && low[i] < low[i + 1])
        {
         //--- i = Swing 1 (Low)
         for(int j = i; j >= InpLen; j--)
           {
            //--- Search for the next swing high
            if(IsSwingHigh(high,j,InpLen) && high[j] > high[j + 1])
              {
               s1_s2_interval = high[j] - low[i]; // Leg size: Swing 1 (Low) to Swing 2 (High)

               //--- j = Swing 2 (High)
               for(int k = j; k >= InpLen; k--)
                 {
                  //--- Search for the next swing low
                  if(IsSwingLow(low,k,InpLen) && low[k] < low[k + 1])
                    {
                     s2_s3_interval = high[j] - low[k]; // Leg size: Swing 2 (High) to Swing 3 (Low)

                     //--- k = Swing 3 (Low)
                     for(int l = k; l >= InpLen; l--)
                       {
                        //--- Search for the next swing high
                        if(IsSwingHigh(high,l,InpLen) && high[l] > high[l + 1])
                          {
                           s3_s4_interval = high[l] - low[k]; // Leg size: Swing 3 (Low) to Swing 4 (High)

                           //--- l = Swing 4 (High)
                           for(int m = l; m >= InpLen; m--)
                             {
                              //--- Search for the next swing low
                              if(IsSwingLow(low,m,InpLen) && low[m] < low[m + 1])
                                {
                                 s4_s5_interval = high[l] - low[m]; // Leg size: Swing 4 (High) to Swing 5 (Low)

                                 //--- m = Swing 5 (Low)
                                 for(int n = m; n >= InpLen; n--)
                                   {
                                    //--- Search for the final swing high
                                    if(IsSwingHigh(high,n,InpLen) && high[n] > high[n + 1])
                                      {
                                       //--- n = Swing 6 (High) - six swing points identified, draw structure
                                       s5_s6_interval = high[n] - low[m]; // leg size: swing5 (low) to swing6 (high)
                                       avg_price = (s1_s2_interval + s2_s3_interval + s3_s4_interval + s4_s5_interval + s5_s6_interval) / 5; // average of the 5 measured legs

                                       break;
                                      }
                                   }
                                 break;
                                }
                             }
                           break;
                          }
                       }
                     break;
                    }
                 }
               break;
              }
           }
         break;
        }
     }
  }
//+------------------------------------------------------------------+
Explanation:
The indicator calculates the distance between each consecutive swing point to measure the size of the completed price movements within the potential upward market structure. Since the structure consists of six alternating swing points, there are five completed swing legs between them. One swing from a swing low to a swing high or from a swing high to a swing low is represented by each leg. The distance between Swing 1 (Low) and Swing 2 (High) is determined by the initial measurement. This is done by subtracting the price value of Swing 1 from the price value of Swing 2. The result represents the first upward movement in the structure and shows how far the price moved after forming the initial swing low. The second measurement calculates the distance between Swing 2 (High) and Swing 3 (Low).
After reaching Swing 2, the market retraces downward and forms Swing 3. This calculation measures the size of that pullback by determining the difference between the high point of Swing 2 and the low point of Swing 3. The distance between Swing 3 (Low) and Swing 4 (High) is determined by the third measurement. After the retracement, this is the subsequent upward movement. The indicator calculates the size of the second bullish leg within the structure by calculating the difference between these two swing points. The distance between Swing 4 (High) and Swing 5 (Low) is determined by the fourth measurement. This determines the extent of the second retracement phase and illustrates the amount of price decline following the formation of the second major high.
The final measurement calculates the distance between Swing 5 (Low) and Swing 6 (High). This represents the most recent upward movement and completes the five measured swing legs. After calculating all five swing leg distances, the indicator uses these values to determine the average movement of the identified market structure. This average represents the typical price movement size of the previous swings and is later used as a reference for projecting a potential future price movement. The avg_price calculation determines the average distance of the five completed swing legs identified by the indicator.
After measuring the movement between each consecutive swing point, the indicator adds all five leg distances together and divides the total by five. This produces a single average swing size that represents the typical price movement within the detected market structure. The calculated value is then used as the expected movement distance for the future projection, allowing the indicator to estimate a potential target level based on the historical swing behavior rather than using a fixed price distance.
Visualizing the Swing Structure, Projection, and ATR-Based Zones
As outlined in the implementation plan, this step displays the identified swing structure and projects potential future price movement.
Example:
#define PFX "FSO_"
//+------------------------------------------------------------------+
//| Create or update a horizontal line                               |
//+------------------------------------------------------------------+
void DrawTrend(const string name,
               datetime x1, double y,
               datetime x2, double y2,
               color col, int w,
               int style)
  {
//--- Create only if missing
   if(ObjectFind(0, name) < 0)
     {
      ObjectCreate(0, name, OBJ_TREND, 0, x1, y, x2, y2); // create trend line object at start/end coordinates
      ChartRedraw(0);
     }

//--- Update properties
   ObjectSetInteger(0, name, OBJPROP_COLOR, col);
   ObjectSetInteger(0, name, OBJPROP_WIDTH, w);
   ObjectSetInteger(0, name, OBJPROP_RAY_RIGHT, false);  // stop the line from projecting infinitely to the right
   ObjectSetInteger(0, name, OBJPROP_BACK, true);        // draw behind chart candles
   ObjectSetInteger(0, name, OBJPROP_STYLE, style);
   ObjectSetInteger(0, name, OBJPROP_SELECTABLE, false); // prevent user from accidentally dragging it
   ObjectSetInteger(0, name, OBJPROP_HIDDEN, true);      // hide from the object list

//--- Update position
   ObjectMove(0, name, 0, x1, y);                        // move anchor point 0 (start)
   ObjectMove(0, name, 1, x2, y2);                       // move anchor point 1 (end)

   ChartRedraw(0);
  }
//+------------------------------------------------------------------+
//--- m = Swing 5 (Low)
for(int n = m; n >= InpLen; n--)
  {
//--- Search for the final swing high
   if(IsSwingHigh(high,n,InpLen) && high[n] > high[n + 1])
     {
      //--- n = Swing 6 (High) - six swing points identified, draw structure
      s5_s6_interval = high[n] - low[m]; // leg size: swing5 (low) to swing6 (high)

      avg_price = (s1_s2_interval + s2_s3_interval + s3_s4_interval + s4_s5_interval + s5_s6_interval) / 5; // average of the 5 measured legs

      //--- Draw lines connecting the six identified swing points to visualize the market structure
      DrawTrend(PFX + "S12",time[i], low[i], time[j], high[j], clrGreen, 2, STYLE_SOLID);
      DrawTrend(PFX + "S23",time[j], high[j], time[k], low[k], clrLightSeaGreen, 2, STYLE_SOLID);
      DrawTrend(PFX + "S34",time[k], low[k], time[l], high[l], clrGoldenrod, 2, STYLE_SOLID);
      DrawTrend(PFX + "S45",time[l], high[l], time[m], low[m], clrDarkOrange, 2, STYLE_SOLID);
      DrawTrend(PFX + "S56",time[m], low[m], time[n], high[n], clrDeepSkyBlue, 2, STYLE_SOLID);

      datetime fs_time = iTime(_Symbol,PERIOD_CURRENT,0) + (PeriodSeconds(_Period) * 5); // projection point 5 bars into the future
      DrawTrend(PFX + "FS",time[i],low[i],fs_time, low[i] + avg_price,clrBlue,2,STYLE_DASH); // projected swing line from the average leg size

      break;
     }
  }
Output:
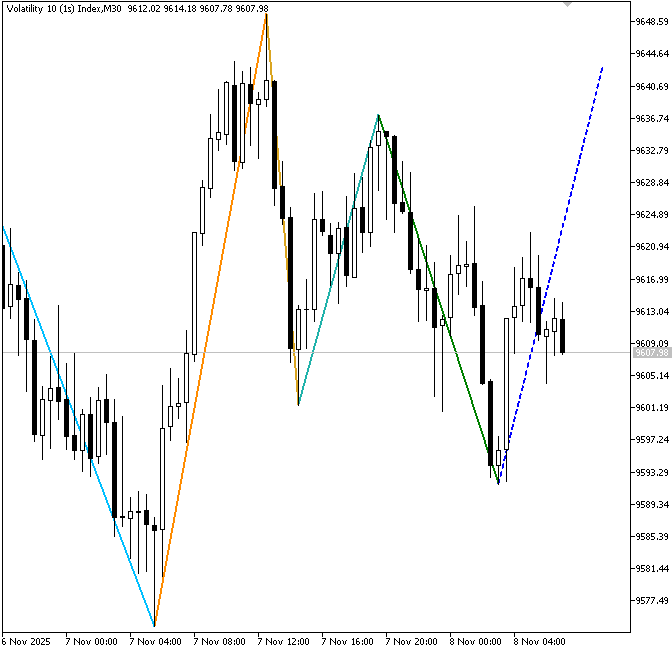
Explanation:
To visualize the detected swing structure and future projection, the indicator uses a dedicated function responsible for creating and updating trend line objects on the chart. PFX (FSO ) is added to each object name so the indicator can manage and delete only its own objects. The line name, beginning and ending coordinates, color, width, and style are passed as inputs to the DrawTrend() function. It first determines if the trend line object is already present on the chart. Using the given time and price coordinates, it generates a new trend line if the object is absent. Instead of generating a duplicate line, the function modifies the object's properties if it already exists.
The function sets the line color, thickness, style, and display behavior of the object after it has been created or located. To prevent unintentional alterations, the line is positioned behind the candles, locked from user manipulation, and does not extend indefinitely to the right. Lastly, the given coordinates are used to update the line's anchor points, guaranteeing that the structure that is shown constantly corresponds to the most recent swing points that have been identified.
After all six swing points are identified, the function is called five times to connect each consecutive swing point. These five lines represent the complete market structure, showing the movement from Swing 1 to Swing 6. The first five lines connect the historical swing points, while the final dashed line projects a potential future movement by extending from the first swing point using the previously calculated average swing distance. This projection represents a potential price path based on historical swing behavior and is not a guaranteed future movement. The final stage of the implementation focuses on converting the calculated swing analysis into chart-based visualization components. The indicator displays the historical swing structure, potential future projection, ATR-based support and resistance zones, and related information directly on the chart.
Example:
int atr_handle;
double atr_buffer[];

//+------------------------------------------------------------------+
//| Create or update a rectangle                                     |
//+------------------------------------------------------------------+
void DrawBox(const string name,
             datetime x1, double yTop,
             datetime x2, double yBot,
             color fillCol)
  {
//--- Create object only if it does not exist
   if(ObjectFind(0, name) < 0)
     {
      ObjectCreate(0, name, OBJ_RECTANGLE, 0, x1, yTop, x2, yBot); // create rectangle spanning the price zone
      ChartRedraw(0);
     }

//--- Update object properties
   ObjectSetInteger(0, name, OBJPROP_COLOR, fillCol);
   ObjectSetInteger(0, name, OBJPROP_BGCOLOR, fillCol);           // fill color of the rectangle body
   ObjectSetInteger(0, name, OBJPROP_FILL, true);                 // enable solid fill instead of outline only
   ObjectSetInteger(0, name, OBJPROP_BACK, true);
   ObjectSetInteger(0, name, OBJPROP_SELECTABLE, false);
   ObjectSetInteger(0, name, OBJPROP_HIDDEN, true);

//--- Update position
   ObjectMove(0, name, 0, x1, yTop);                             // top-left corner
   ObjectMove(0, name, 1, x2, yBot);                             // bottom-right corner

   ChartRedraw(0);
  }

//+------------------------------------------------------------------+
//| Create or update text                                            |
//+------------------------------------------------------------------+
void CreateTxt(const string name,
               datetime x, double y,
               string txt, color fillCol)
  {
//--- Create object only if it does not exist
   if(ObjectFind(0, name) < 0)
     {
      ObjectCreate(0, name, OBJ_TEXT, 0, x, y, 0, 0);  // create text label at given time/price
      ChartRedraw(0);
     }

//--- Update object properties
   ObjectSetInteger(0, name, OBJPROP_COLOR, fillCol);
   ObjectSetInteger(0, name, OBJPROP_HIDDEN, true);
   ObjectSetString(0,name,OBJPROP_TEXT,txt);          // set the displayed text string

//--- Update position
   ObjectMove(0, name, 0, x, y);
   ChartRedraw(0);
  }
//+------------------------------------------------------------------+
//| Custom indicator initialization function                         |
//+------------------------------------------------------------------+
int OnInit()
  {
//---
   atr_handle = iATR(_Symbol,PERIOD_CURRENT,200); // ATR(200) handle used to size the projection boxes
   ArraySetAsSeries(atr_buffer,true);
//---
   return(INIT_SUCCEEDED);
  }

//+------------------------------------------------------------------+
//| Custom indicator deinitialization function                       |
//+------------------------------------------------------------------+
void OnDeinit(const int reason)
  {
   ObjectsDeleteAll(0,PFX); // remove every object created by this indicator (matched by prefix)
   ChartRedraw(0);
  }
//--- m = Swing 5 (Low)
for(int n = m; n >= InpLen; n--)
  {
//--- Search for the final swing high
   if(IsSwingHigh(high,n,InpLen) && high[n] > high[n + 1])
     {
      //--- n = Swing 6 (High) - six swing points identified, draw structure
      s5_s6_interval = high[n] - low[m]; // leg size: swing5 (low) to swing6 (high)

      avg_price = (s1_s2_interval + s2_s3_interval + s3_s4_interval + s4_s5_interval + s5_s6_interval) / 5; // average of the 5 measured legs

      //--- Draw lines connecting the six identified swing points to visualize the market structure
      DrawTrend(PFX + "S12",time[i], low[i], time[j], high[j], clrGreen, 2, STYLE_SOLID);
      DrawTrend(PFX + "S23",time[j], high[j], time[k], low[k], clrLightSeaGreen, 2, STYLE_SOLID);
      DrawTrend(PFX + "S34",time[k], low[k], time[l], high[l], clrGoldenrod, 2, STYLE_SOLID);
      DrawTrend(PFX + "S45",time[l], high[l], time[m], low[m], clrDarkOrange, 2, STYLE_SOLID);
      DrawTrend(PFX + "S56",time[m], low[m], time[n], high[n], clrDeepSkyBlue, 2, STYLE_SOLID);

      datetime fs_time = iTime(_Symbol,PERIOD_CURRENT,0) + (PeriodSeconds(_Period) * 5);         // projection point 5 bars into the future
      DrawTrend(PFX + "FS",time[i],low[i],fs_time, low[i] + avg_price,clrBlue,2,STYLE_DASH);     // projected swing line from the average leg size

      CopyBuffer(atr_handle, 0,0,1,atr_buffer); // pull latest ATR value into atr_buffer[0]
      DrawBox(PFX + "S",time[i],low[i],fs_time,low[i] - atr_buffer[0],clrLightSeaGreen); // support zone sized by ATR
      DrawBox(PFX + "R",time[j],high[j],fs_time,high[j] + atr_buffer[0],clrOrange); // resistance zone sized by ATR
      CreateTxt(PFX + "TXT",fs_time,low[i] + avg_price,DoubleToString(low[i] + avg_price,_Digits),clrBlue); // label the projected price level

      break;
     }
  }
Output:
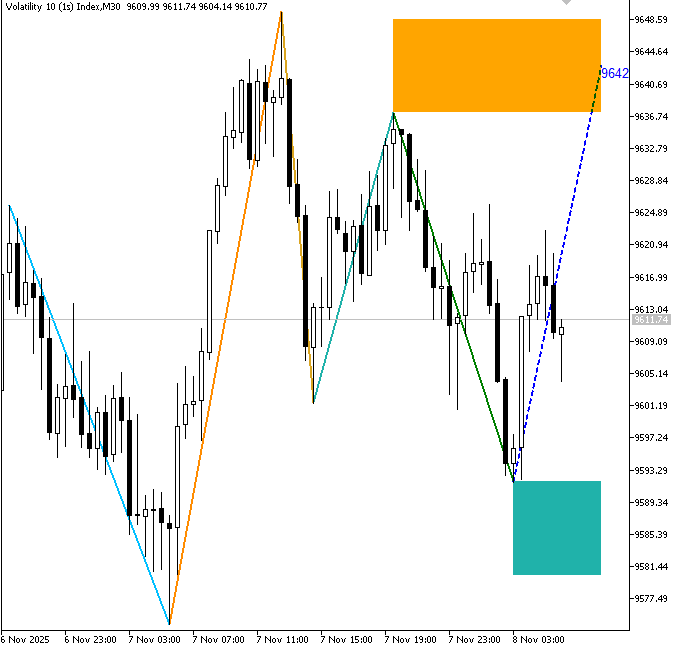
Explanation:
The DrawBox() function is responsible for creating and updating rectangular zones on the chart. Based on the identified swing structure, it is utilized to graphically depict possible locations of support and resistance. The function determines whether an object with the same name already exists before generating a new rectangle. If it doesn't already exist, the starting time, ending time, higher price boundary, and lower price boundary are used to construct a new rectangle object. After creation, the function updates the rectangle properties, including its color, fill style, background position, and visibility settings. The rectangle is configured to remain behind price candles, prevent accidental user modification, and stay hidden from the object list.
Next, the rectangle's position is updated using two anchor points, allowing the support or resistance zone to extend from the identified swing point toward the future projection area. The CreateTxt() function creates and updates text labels displayed on the chart. In this indicator, CreateTxt() is used to show the projected future price level calculated from the average swing movement. Like DrawBox(), the function creates a new text object only after determining whether it already exists. After creation, the function updates the object's text, color, and visibility. To guarantee that the anticipated price information is displayed at the appropriate location on the chart, the label position is then changed using the given time and price coordinates.
The ATR handle is created using the iATR() function with a period of 200 candles. This allows the indicator to access the current Average True Range value, which is later used to determine the size of the projected support and resistance zones. Instead of using a fixed number of points or pips, the ATR value allows the zones to automatically adjust according to current market volatility. Wider zones are produced by higher volatility, and narrower zones are produced by lower volatility. When the indicator is removed, the OnDeinit() function eliminates all chart objects created by the indicator using the specified prefix, eliminating any remaining lines, zones, and labels. After that, it applies the cleanup by refreshing the chart.
After identifying the six swing points and calculating the average movement, the indicator retrieves the latest ATR value to size the projected support and resistance zones. These zones extend into the future from key swing points and represent potential reaction areas based on the detected market structure. Finally, the CreateTxt() function places a label at the projected price level. The displayed value is calculated by adding the average swing movement to the starting swing low in an upward projection scenario, allowing traders to easily identify the potential future price target generated from historical swing behavior.
Conclusion
We've developed a reproducible indicator for predicting future price movements in MQL5, replacing subjective manual measurements with formal rules and clearly defined results. The indicator:
- Recalculates the value once for each new bar and provides a single configurable lookback parameter (swing detection length) to control sensitivity;
- Identifies swing highs/lows by comparing a candle to previous candles and confirming the result with the next candle;
- Detects six alternating swing points according to the current direction of movement, measures five completed movements and calculates the average distance between the legs;
- draws five structure lines, projects a dotted continuation a configurable number of bars into the future, places ATR-sized support/resistance blocks, and indicates the projected price; and
- Manages chart objects by prefix and removes them on deletion.
The new implementation also clarifies the acceptance criteria: on any bar with six valid alternating swings, the indicator must display five structure lines, a projection line, two ATR fields, and a projection label. The limitations remain clear: this is a statistical, rule-based projection (not a guaranteed forecast), results depend on the selected observation period and ATR settings, and bullish and bearish scenarios are handled symmetrically by inverting the detection/measurement logic. Users should consider the projection as an analytical guide, combine it with risk management, and test the configuration on their instruments and timeframes before executing trades.
Warning: All rights to these materials are reserved by MetaQuotes Ltd. Copying or reprinting of these materials in whole or in part is prohibited.
This article was written by a user of the site and reflects their personal views. MetaQuotes Ltd is not responsible for the accuracy of the information presented, nor for any consequences resulting from the use of the solutions, strategies or recommendations described.


 From Novice to Expert: Weekend Gap Size Effect Research Using MQL5 and Python
 Interactive Supply and Demand Zone Manager in MQL5 (Part IV): Trading Supply and Demand Zones
 Building a Position Sizing Engine in MQL5 with Multiple Risk Models
 Neural Networks in Trading: An Intelligent Forecast Pipeline (Sparse Mixture of Experts)

- Free trading apps
- Over 8,000 signals for copying
- Economic news for exploring financial markets
You agree to website policy and terms of use