

Larry Williams Market Secrets (Part 17) : Detecting Oops Signals Using a Custom Indicator
 1 312
1 312
 0
0

Introduction
Identifying Oops gap reversals manually is unreliable because the setup requires tracking several conditions simultaneously. The opening gap must meet a minimum size, the reversal must occur within a limited number of bars, and only the first valid fill should produce a signal. When these checks are performed visually across long chart histories, valid setups may be missed, expired gaps may be treated as active, and the same gap may be marked multiple times.
This article solves the problem by building a custom MQL5 indicator that detects bullish and bearish Oops signals on the price chart. The indicator evaluates completed bars, places arrows at confirmed signal locations, and applies the same rules consistently across historical and newly formed data.
The calculation model is divided into two parts. When the indicator is attached, it scans the available history and maps existing signals into two indicator buffers. After the initial calculation, it updates only the most recently completed bar when new chart data is added. This avoids repeatedly rebuilding the full signal history during normal operation.
By the end of the article, the completed indicator will provide:
- Two indicator buffers for bullish and bearish output
- Bullish and bearish arrow signals on the main chart
- Same-bar and later-bar confirmation
- Configurable minimum gap and validity thresholds
- Historical signal mapping
- Incremental new-bar updates
- First-fill-only signal generation to prevent duplicates
Signal Rules Used by the Indicator
The indicator begins by identifying a bar that opens outside the previous bar’s price range. In this article, that bar is called the gap bar.
A bullish gap bar opens below the previous bar’s low, while a bearish gap bar opens above the previous bar’s high. The distance between the gap bar’s open and the relevant previous-bar boundary must be at least minimumGapSizePoints.
The indicator confirms the first fill using the closing price of a newly completed bar. An intrabar touch or crossing of the gap level is ignored; the gap is considered filled only when a completed bar closes through the level.
The complete signal rules are:
| Direction | Gap bar condition | Confirmation |
|---|---|---|
| Bullish | The gap bar opens below the previous bar’s low by at least minimumGapSizePoints | The gap bar or a later valid bar closes at or above the previous low |
| Bearish | The gap bar opens above the previous bar’s high by at least minimumGapSizePoints | The gap bar or a later valid bar closes at or below the previous high |
The gap bar may confirm the setup immediately. For example, a bar may open below the previous low and recover enough to close at or above that level before the bar ends.
When the gap bar does not confirm the setup, a later bar may still produce the signal. The later close must cross the same previous-bar boundary within maxGapValidityBars.
Only the first qualifying fill is accepted. After a gap has already produced a valid signal, later bars cannot generate another signal from the same gap.
Creating the Indicator Project
Open MetaEditor and select File > New to launch the MQL5 Wizard. Choose Custom Indicator, then create the source file with the following name:
lwOopsPatternIndicator.mq5
The wizard creates the initial indicator template. Replace its contents with the following source code:
//+------------------------------------------------------------------+
//|                                       lwOopsPatternIndicator.mq5 |
//|          Copyright 2026, MetaQuotes Ltd. Developer is Chacha Ian |
//|                          https://www.mql5.com/en/users/chachaian |
//+------------------------------------------------------------------+
#property copyright "Copyright 2026, MetaQuotes Ltd. Developer is Chacha Ian"
#property link      "https://www.mql5.com/en/users/chachaian"
#property version   "1.00"

//--- Indicator configuration
#property indicator_chart_window
#property indicator_buffers 2
#property indicator_plots   2

//--- Bullish signal plot
#property indicator_label1  "Bullish Oops Signal"
#property indicator_type1   DRAW_ARROW
#property indicator_color1  clrSeaGreen
#property indicator_width1  2

//--- Bearish signal plot
#property indicator_label2  "Bearish Oops Signal"
#property indicator_type2   DRAW_ARROW
#property indicator_color2  clrBlack
#property indicator_width2  2

//+------------------------------------------------------------------+
//| Input parameters                                                 |
//+------------------------------------------------------------------+
input group "Oops Pattern Configurations"
input double minimumGapSizePoints = 500;
input int    maxGapValidityBars   = 3;

//+------------------------------------------------------------------+
//| Indicator buffers                                                |
//+------------------------------------------------------------------+
double bullishSignalBuffer[];
double bearishSignalBuffer[];

//+------------------------------------------------------------------+
//| Custom indicator initialization function                         |
//+------------------------------------------------------------------+
int OnInit()
  {
   return INIT_SUCCEEDED;
  }

//+------------------------------------------------------------------+
//| Custom indicator iteration function                              |
//+------------------------------------------------------------------+
int OnCalculate(const int       rates_total,
                const int       prev_calculated,
                const datetime &time[],
                const double   &open[],
                const double   &high[],
                const double   &low[],
                const double   &close[],
                const long     &tick_volume[],
                const long     &volume[],
                const int      &spread[])
  {
   return rates_total;
  }
//+------------------------------------------------------------------+
This first version defines the indicator metadata, main-chart placement, two plots, two buffers, configurable inputs, and the required event handlers. The buffers are only declared at this stage. Their registration and signal calculations will be added in the following sections.
Compile "lwOopsPatternIndicator.mq5" in MetaEditor. If the initial source has been entered correctly, the compiler should report zero errors and zero warnings. At this stage, the indicator has a valid structure, but it does not yet calculate or display Oops signals.
Defining Inputs and Validating Configuration
The indicator uses two inputs to control which gaps qualify and how long an unconfirmed setup remains valid:
input double minimumGapSizePoints = 500;
input int    maxGapValidityBars   = 3;
minimumGapSizePoints defines the smallest opening gap that the indicator will accept. maxGapValidityBars defines how many later bars may confirm a gap that was not filled on the gap bar itself.
Before the indicator binds buffers or changes the chart, these values should be validated. Replace the current OnInit() function with the following code:
//+------------------------------------------------------------------+
//| Custom indicator initialization function                         |
//+------------------------------------------------------------------+
int OnInit()
  {
   if(minimumGapSizePoints < 0.0)
     {
      PrintFormat("Invalid minimum gap size: %.2f. The value cannot be negative.",
                  minimumGapSizePoints);
      return INIT_PARAMETERS_INCORRECT;
     }

   if(maxGapValidityBars < 0)
     {
      PrintFormat("Invalid maximum gap validity: %d. The value cannot be negative.",
                  maxGapValidityBars);
      return INIT_PARAMETERS_INCORRECT;
     }

   return INIT_SUCCEEDED;
  }
The validation runs before any other initialization work. A negative value stops the indicator immediately and reports which input is invalid.
Compile "lwOopsPatternIndicator.mq5" in MetaEditor. If the code has been entered correctly, the compiler should report zero errors and zero warnings. Attach the indicator using the default inputs and confirm that initialization succeeds. Then set either input to a negative value and attach it again. The indicator should stop during initialization and write a precise validation message to the Experts log.
Declaring and Binding the Signal Buffers
The indicator uses two global arrays to store its chart output:
double bullishSignalBuffer[];
double bearishSignalBuffer[];
bullishSignalBuffer will store arrow prices below bullish signal bars, while bearishSignalBuffer will store arrow prices above bearish signal bars. When no signal exists at a bar, the corresponding buffer position will contain EMPTY_VALUE, which prevents MetaTrader 5 from drawing an arrow there.
The arrays must be registered as indicator buffers before they can provide data to the two plots. Replace the current OnInit() function with the following version:
//+------------------------------------------------------------------+
//| Custom indicator initialization function                         |
//+------------------------------------------------------------------+
int OnInit()
  {
   if(minimumGapSizePoints < 0.0)
     {
      PrintFormat("Invalid minimum gap size: %.2f. The value cannot be negative.",
                  minimumGapSizePoints);
      return INIT_PARAMETERS_INCORRECT;
     }

   if(maxGapValidityBars < 0)
     {
      PrintFormat("Invalid maximum gap validity: %d. The value cannot be negative.",
                  maxGapValidityBars);
      return INIT_PARAMETERS_INCORRECT;
     }

   ResetLastError();

   if(!SetIndexBuffer(0, bullishSignalBuffer, INDICATOR_DATA))
     {
      PrintFormat("Failed to bind the bullish signal buffer. Error: %d",
                  GetLastError());
      return INIT_FAILED;
     }

   ResetLastError();

   if(!SetIndexBuffer(1, bearishSignalBuffer, INDICATOR_DATA))
     {
      PrintFormat("Failed to bind the bearish signal buffer. Error: %d",
                  GetLastError());
      return INIT_FAILED;
     }

   return INIT_SUCCEEDED;
  }
Each SetIndexBuffer() call connects one array to its corresponding plot index. If either registration fails, initialization stops instead of allowing the indicator to continue with an invalid output configuration.
Compile "lwOopsPatternIndicator.mq5" in MetaEditor. If the function has been replaced correctly, the compiler should report zero errors and zero warnings. The buffers are now registered, but they remain empty because signal detection and buffer calculation have not yet been added.
Applying Direct Buffer Indexing
The indicator buffers should use direct indexing so that their positions follow the chart from oldest to newest. Under this model, index 0 represents the oldest available bar, while the final index represents the newest bar.
Add the following function below OnCalculate():
//+------------------------------------------------------------------+
//| Sets indicator buffers to direct indexing                        |
//+------------------------------------------------------------------+
bool InitializeArraysAsNonTimeSeries()
  {
   ResetLastError();

   if(!ArraySetAsSeries(bullishSignalBuffer, false))
     {
      PrintFormat("Failed to set direct indexing for the bullish buffer. Error: %d",
                  GetLastError());
      return false;
     }

   ResetLastError();

   if(!ArraySetAsSeries(bearishSignalBuffer, false))
     {
      PrintFormat("Failed to set direct indexing for the bearish buffer. Error: %d",
                  GetLastError());
      return false;
     }

   return true;
  }
The function applies the same indexing direction to both output buffers. Returning a Boolean result allows initialization to stop when either array cannot be configured.
Now replace OnInit() with the following version so that the indexing function runs after the buffers have been registered:
//+------------------------------------------------------------------+
//| Custom indicator initialization function                         |
//+------------------------------------------------------------------+
int OnInit()
  {
   if(minimumGapSizePoints < 0.0)
     {
      PrintFormat("Invalid minimum gap size: %.2f. The value cannot be negative.",
                  minimumGapSizePoints);
      return INIT_PARAMETERS_INCORRECT;
     }

   if(maxGapValidityBars < 0)
     {
      PrintFormat("Invalid maximum gap validity: %d. The value cannot be negative.",
                  maxGapValidityBars);
      return INIT_PARAMETERS_INCORRECT;
     }

   ResetLastError();

   if(!SetIndexBuffer(0, bullishSignalBuffer, INDICATOR_DATA))
     {
      PrintFormat("Failed to bind the bullish signal buffer. Error: %d",
                  GetLastError());
      return INIT_FAILED;
     }

   ResetLastError();

   if(!SetIndexBuffer(1, bearishSignalBuffer, INDICATOR_DATA))
     {
      PrintFormat("Failed to bind the bearish signal buffer. Error: %d",
                  GetLastError());
      return INIT_FAILED;
     }

   if(!InitializeArraysAsNonTimeSeries())
      return INIT_FAILED;

   return INIT_SUCCEEDED;
  }
Compile "lwOopsPatternIndicator.mq5" in MetaEditor and attach it to a chart. If the changes have been applied correctly, the compiler should report zero errors and zero warnings, initialization should complete successfully, and no array-indexing errors should appear in the Experts log.
Configuring the Arrow Plots
The indicator buffers can store signal prices, but MetaTrader 5 still needs to know how those values should be drawn. The plot properties define the visual style of each signal, while the runtime settings assign the Wingdings symbols, vertical shifts, and empty-buffer value.
Keep the following plot directives near the top of the source file:
//--- Bullish signal plot
#property indicator_label1  "Bullish Oops Signal"
#property indicator_type1   DRAW_ARROW
#property indicator_color1  clrSeaGreen
#property indicator_width1  2

//--- Bearish signal plot
#property indicator_label2  "Bearish Oops Signal"
#property indicator_type2   DRAW_ARROW
#property indicator_color2  clrBlack
#property indicator_width2  2
Now replace OnInit() with the following version:
//+------------------------------------------------------------------+
//| Custom indicator initialization function                         |
//+------------------------------------------------------------------+
int OnInit()
  {
   if(minimumGapSizePoints < 0.0)
     {
      PrintFormat("Invalid minimum gap size: %.2f. The value cannot be negative.",
                  minimumGapSizePoints);
      return INIT_PARAMETERS_INCORRECT;
     }

   if(maxGapValidityBars < 0)
     {
      PrintFormat("Invalid maximum gap validity: %d. The value cannot be negative.",
                  maxGapValidityBars);
      return INIT_PARAMETERS_INCORRECT;
     }

   ResetLastError();

   if(!SetIndexBuffer(0, bullishSignalBuffer, INDICATOR_DATA))
     {
      PrintFormat("Failed to bind the bullish signal buffer. Error: %d",
                  GetLastError());
      return INIT_FAILED;
     }

   ResetLastError();

   if(!SetIndexBuffer(1, bearishSignalBuffer, INDICATOR_DATA))
     {
      PrintFormat("Failed to bind the bearish signal buffer. Error: %d",
                  GetLastError());
      return INIT_FAILED;
     }

   if(!InitializeArraysAsNonTimeSeries())
      return INIT_FAILED;

   ResetLastError();

   if(!PlotIndexSetInteger(0, PLOT_ARROW, 233))
     {
      PrintFormat("Failed to set the bullish arrow symbol. Error: %d",
                  GetLastError());
      return INIT_FAILED;
     }

   ResetLastError();

   if(!PlotIndexSetInteger(0, PLOT_ARROW_SHIFT, 20))
     {
      PrintFormat("Failed to set the bullish arrow shift. Error: %d",
                  GetLastError());
      return INIT_FAILED;
     }

   ResetLastError();

   if(!PlotIndexSetDouble(0, PLOT_EMPTY_VALUE, EMPTY_VALUE))
     {
      PrintFormat("Failed to set the bullish plot empty value. Error: %d",
                  GetLastError());
      return INIT_FAILED;
     }

   ResetLastError();

   if(!PlotIndexSetInteger(1, PLOT_ARROW, 234))
     {
      PrintFormat("Failed to set the bearish arrow symbol. Error: %d",
                  GetLastError());
      return INIT_FAILED;
     }

   ResetLastError();

   if(!PlotIndexSetInteger(1, PLOT_ARROW_SHIFT, -20))
     {
      PrintFormat("Failed to set the bearish arrow shift. Error: %d",
                  GetLastError());
      return INIT_FAILED;
     }

   ResetLastError();

   if(!PlotIndexSetDouble(1, PLOT_EMPTY_VALUE, EMPTY_VALUE))
     {
      PrintFormat("Failed to set the bearish plot empty value. Error: %d",
                  GetLastError());
      return INIT_FAILED;
     }

   ResetLastError();

   if(!IndicatorSetString(INDICATOR_SHORTNAME, "Oops Pattern Indicator"))
     {
      PrintFormat("Failed to set the indicator short name. Error: %d",
                  GetLastError());
      return INIT_FAILED;
     }

   return INIT_SUCCEEDED;
  }
The bullish plot uses Wingdings code 233, while the bearish plot uses code 234. The vertical shifts keep the arrows clear of the candles, and EMPTY_VALUE ensures that no graphical mark is drawn where a signal is absent.
Compile "lwOopsPatternIndicator.mq5" in MetaEditor and attach it to a chart. If the changes are correct, the compiler should report zero errors and zero warnings. The indicator should appear in the chart indicator list, but no arrows will be visible yet because the signal-calculation logic has not been added.
Configuring the Chart Appearance
The indicator will use a consistent chart layout so that bullish and bearish arrows remain easy to inspect. The chart configuration is applied during initialization after the inputs, buffers, indexing, and plots have been prepared.
Add the following function below InitializeArraysAsNonTimeSeries():
//+------------------------------------------------------------------+
//| Configures the chart appearance                                  |
//+------------------------------------------------------------------+
bool ConfigureChartAppearance()
  {
   ResetLastError();

   if(!ChartSetInteger(0, CHART_COLOR_BACKGROUND, clrWhite))
     {
      PrintFormat("Failed to set the chart background color. Error: %d",
                  GetLastError());
      return false;
     }

   ResetLastError();

   if(!ChartSetInteger(0, CHART_SHOW_GRID, false))
     {
      PrintFormat("Failed to hide the chart grid. Error: %d",
                  GetLastError());
      return false;
     }

   ResetLastError();

   if(!ChartSetInteger(0, CHART_MODE, CHART_CANDLES))
     {
      PrintFormat("Failed to set the chart to candlestick mode. Error: %d",
                  GetLastError());
      return false;
     }

   ResetLastError();

   if(!ChartSetInteger(0, CHART_COLOR_FOREGROUND, clrBlack))
     {
      PrintFormat("Failed to set the chart foreground color. Error: %d",
                  GetLastError());
      return false;
     }

   ResetLastError();

   if(!ChartSetInteger(0, CHART_COLOR_CANDLE_BULL, clrSeaGreen))
     {
      PrintFormat("Failed to set the bullish candle color. Error: %d",
                  GetLastError());
      return false;
     }

   ResetLastError();

   if(!ChartSetInteger(0, CHART_COLOR_CANDLE_BEAR, clrBlack))
     {
      PrintFormat("Failed to set the bearish candle color. Error: %d",
                  GetLastError());
      return false;
     }

   ResetLastError();

   if(!ChartSetInteger(0, CHART_COLOR_CHART_UP, clrSeaGreen))
     {
      PrintFormat("Failed to set the chart-up color. Error: %d",
                  GetLastError());
      return false;
     }

   ResetLastError();

   if(!ChartSetInteger(0, CHART_COLOR_CHART_DOWN, clrBlack))
     {
      PrintFormat("Failed to set the chart-down color. Error: %d",
                  GetLastError());
      return false;
     }

   ResetLastError();
   ChartRedraw(0);

   int errorCode = GetLastError();

   if(errorCode != ERR_SUCCESS)
     {
      PrintFormat("Chart redraw reported an error. Error: %d", errorCode);
      return false;
     }

   return true;
  }
Each chart operation is checked separately so the Experts log can identify the exact property that failed to apply. ChartRedraw() is called directly because it does not return a Boolean value. The terminal error is inspected after the call to confirm that the redraw completed without reporting a problem.
Now replace OnInit() with the following complete version:
//+------------------------------------------------------------------+
//| Custom indicator initialization function                         |
//+------------------------------------------------------------------+
int OnInit()
  {
   if(minimumGapSizePoints < 0.0)
     {
      PrintFormat("Invalid minimum gap size: %.2f. The value cannot be negative.",
                  minimumGapSizePoints);
      return INIT_PARAMETERS_INCORRECT;
     }

   if(maxGapValidityBars < 0)
     {
      PrintFormat("Invalid maximum gap validity: %d. The value cannot be negative.",
                  maxGapValidityBars);
      return INIT_PARAMETERS_INCORRECT;
     }

   ResetLastError();

   if(!SetIndexBuffer(0, bullishSignalBuffer, INDICATOR_DATA))
     {
      PrintFormat("Failed to bind the bullish signal buffer. Error: %d",
                  GetLastError());
      return INIT_FAILED;
     }

   ResetLastError();

   if(!SetIndexBuffer(1, bearishSignalBuffer, INDICATOR_DATA))
     {
      PrintFormat("Failed to bind the bearish signal buffer. Error: %d",
                  GetLastError());
      return INIT_FAILED;
     }

   if(!InitializeArraysAsNonTimeSeries())
      return INIT_FAILED;

   ResetLastError();

   if(!PlotIndexSetInteger(0, PLOT_ARROW, 233))
     {
      PrintFormat("Failed to set the bullish arrow symbol. Error: %d",
                  GetLastError());
      return INIT_FAILED;
     }

   ResetLastError();

   if(!PlotIndexSetInteger(0, PLOT_ARROW_SHIFT, 20))
     {
      PrintFormat("Failed to set the bullish arrow shift. Error: %d",
                  GetLastError());
      return INIT_FAILED;
     }

   ResetLastError();

   if(!PlotIndexSetDouble(0, PLOT_EMPTY_VALUE, EMPTY_VALUE))
     {
      PrintFormat("Failed to set the bullish plot empty value. Error: %d",
                  GetLastError());
      return INIT_FAILED;
     }

   ResetLastError();

   if(!PlotIndexSetInteger(1, PLOT_ARROW, 234))
     {
      PrintFormat("Failed to set the bearish arrow symbol. Error: %d",
                  GetLastError());
      return INIT_FAILED;
     }

   ResetLastError();

   if(!PlotIndexSetInteger(1, PLOT_ARROW_SHIFT, -20))
     {
      PrintFormat("Failed to set the bearish arrow shift. Error: %d",
                  GetLastError());
      return INIT_FAILED;
     }

   ResetLastError();

   if(!PlotIndexSetDouble(1, PLOT_EMPTY_VALUE, EMPTY_VALUE))
     {
      PrintFormat("Failed to set the bearish plot empty value. Error: %d",
                  GetLastError());
      return INIT_FAILED;
     }

   ResetLastError();

   if(!IndicatorSetString(INDICATOR_SHORTNAME, "Oops Pattern Indicator"))
     {
      PrintFormat("Failed to set the indicator short name. Error: %d",
                  GetLastError());
      return INIT_FAILED;
     }

   if(!ConfigureChartAppearance())
      return INIT_FAILED;

   return INIT_SUCCEEDED;
  }
The initialization sequence now validates the inputs, binds and configures the buffers, prepares the arrow plots, assigns the indicator name, and applies the chart appearance before returning success.
Compile "lwOopsPatternIndicator.mq5" in MetaEditor and attach it to a chart. If the implementation is correct, the compiler should report zero errors and zero warnings. The chart should immediately change to the configured appearance, the indicator should initialize without log errors, and no arrows should appear yet because signal calculation has not been implemented.
Preparing Price Arrays in OnCalculate()
The price arrays supplied to OnCalculate() should use the same direct-indexing model as the indicator buffers. This keeps all bar references consistent: index 0 represents the oldest bar, while the final index represents the newest bar.
Add the following function below InitializeArraysAsNonTimeSeries():
//+------------------------------------------------------------------+
//| Sets the price arrays to direct indexing                         |
//+------------------------------------------------------------------+
bool InitializePriceArraysAsNonTimeSeries(const double &open[],
                                          const double &high[],
                                          const double &low[],
                                          const double &close[])
  {
   ResetLastError();

   if(!ArraySetAsSeries(open, false))
     {
      PrintFormat("Failed to set direct indexing for the Open array. Error: %d",
                  GetLastError());
      return false;
     }

   ResetLastError();

   if(!ArraySetAsSeries(high, false))
     {
      PrintFormat("Failed to set direct indexing for the High array. Error: %d",
                  GetLastError());
      return false;
     }

   ResetLastError();

   if(!ArraySetAsSeries(low, false))
     {
      PrintFormat("Failed to set direct indexing for the Low array. Error: %d",
                  GetLastError());
      return false;
     }

   ResetLastError();

   if(!ArraySetAsSeries(close, false))
     {
      PrintFormat("Failed to set direct indexing for the Close array. Error: %d",
                  GetLastError());
      return false;
     }

   return true;
  }
Now replace the current OnCalculate() function with the following version:
//+------------------------------------------------------------------+
//| Custom indicator iteration function                              |
//+------------------------------------------------------------------+
int OnCalculate(const int       rates_total,
                const int       prev_calculated,
                const datetime &time[],
                const double   &open[],
                const double   &high[],
                const double   &low[],
                const double   &close[],
                const long     &tick_volume[],
                const long     &volume[],
                const int      &spread[])
  {
   if(rates_total < 3)
      return 0;

   if(!InitializePriceArraysAsNonTimeSeries(open, high, low, close))
      return prev_calculated;

   return rates_total;
  }
The three-bar requirement provides enough data for a previous bar, an evaluable bar, and the current bar. At this stage, OnCalculate() only prepares the incoming price arrays and returns the number of available bars. No signal-detection functions are called yet.
Compile "lwOopsPatternIndicator.mq5" in MetaEditor and attach it to a chart. If the implementation is correct, the compiler should report zero errors and zero warnings. The indicator should run without array-direction errors, while the chart remains free of Oops signals.
Detecting Gap-Down and Gap-Up Bars
The first stage of the signal logic is to determine whether a bar opened far enough outside the previous bar’s range to qualify as a gap.
For a gap down, the current open must be below the previous low. For a gap up, the current open must be above the previous high. The price difference is compared with minimumGapSizePoints after converting that input into the symbol’s price scale with _Point.
Add the following functions below InitializePriceArraysAsNonTimeSeries():
//+------------------------------------------------------------------+
//| Returns true if the bar opens with a valid gap down              |
//+------------------------------------------------------------------+
bool IsGapDownAtIndex(const int i,
                      const double &open[],
                      const double &low[])
  {
//--- Index 0 has no previous bar for comparison
   if(i < 1)
      return false;

//--- Measure the distance from the current open to the previous low
   double currentOpen = open[i];
   double previousLow = low[i - 1];
   double gapSize     = previousLow - currentOpen;

//--- Accept only gaps that meet the configured minimum size
   return gapSize >= minimumGapSizePoints * _Point;
  }

//+------------------------------------------------------------------+
//| Returns true if the bar opens with a valid gap up                |
//+------------------------------------------------------------------+
bool IsGapUpAtIndex(const int i,
                    const double &open[],
                    const double &high[])
  {
//--- Index 0 has no previous bar for comparison
   if(i < 1)
      return false;

//--- Measure the distance from the previous high to the current open
   double currentOpen  = open[i];
   double previousHigh = high[i - 1];
   double gapSize      = currentOpen - previousHigh;

//--- Accept only gaps that meet the configured minimum size
   return gapSize >= minimumGapSizePoints * _Point;
  }
Both functions return only a Boolean result. They do not modify the buffers or decide whether a complete Oops signal exists. Their responsibility is limited to verifying the opening-gap condition established earlier.
The index check prevents access to i - 1 when the current bar is the oldest available bar. After that, each function measures the distance between the current open and the relevant previous-bar extreme. A result of true means that the opening difference is in the required direction and is at least as large as the configured threshold.
For a temporary test, replace OnCalculate() with the following version:
//+------------------------------------------------------------------+
//| Custom indicator iteration function                              |
//+------------------------------------------------------------------+
int OnCalculate(const int       rates_total,
                const int       prev_calculated,
                const datetime &time[],
                const double   &open[],
                const double   &high[],
                const double   &low[],
                const double   &close[],
                const long     &tick_volume[],
                const long     &volume[],
                const int      &spread[])
  {
   if(rates_total < 3)
      return 0;

   if(!InitializePriceArraysAsNonTimeSeries(open, high, low, close))
      return prev_calculated;

//--- Run the diagnostic only during the first calculation
   if(prev_calculated == 0)
     {
      for(int i = 1; i < rates_total; i++)
        {
         if(IsGapDownAtIndex(i, open, low))
           {
            PrintFormat("Gap down detected at index %d. Open: %.*f, previous low: %.*f",
                        i,
                        _Digits,
                        open[i],
                        _Digits,
                        low[i - 1]);
           }

         if(IsGapUpAtIndex(i, open, high))
           {
            PrintFormat("Gap up detected at index %d. Open: %.*f, previous high: %.*f",
                        i,
                        _Digits,
                        open[i],
                        _Digits,
                        high[i - 1]);
           }
        }
     }

   return rates_total;
  }
Compile the indicator and attach it to a chart. If the implementation is correct, MetaEditor should report zero errors and zero warnings. The Experts log should list only the bars whose opening differences meet minimumGapSizePoints; smaller differences should produce no diagnostic message.
After verifying the results, restore the previous minimal OnCalculate() function before continuing. The temporary diagnostic loop is only used to confirm that the two gap-detection functions behave correctly.
Detecting Bullish Oops Signals
The bullish signal function builds on the gap-down check from the previous section. Its task is to decide whether the bar at index i is the first valid fill of a bullish Oops setup.
There are two valid paths. The gap-down bar may close back at or above the previous low immediately, or a later bar may produce the first qualifying close within maxGapValidityBars. In the second case, the function must also confirm that no earlier bar has already filled the same gap.
Add the following function below IsGapUpAtIndex():
//+------------------------------------------------------------------+
//| Returns true if a bullish Oops signal exists at the index        |
//+------------------------------------------------------------------+
bool IsBullishOopsSignalAtIndex(const int i,
                                const double &open[],
                                const double &high[],
                                const double &low[],
                                const double &close[])
  {
//--- Index 0 has no previous bar for gap comparison
   if(i < 1)
      return false;

//--- Path 1: the gap-down bar fills the gap by its own close
   if(IsGapDownAtIndex(i, open, low))
     {
      double previousLow = low[i - 1];

      if(close[i] >= previousLow)
         return true;
     }

//--- Path 2: search recent bars for an earlier valid gap down
   int startGapIndex = MathMax(1, i - maxGapValidityBars);

   for(int j = startGapIndex; j < i; j++)
     {
      if(!IsGapDownAtIndex(j, open, low))
         continue;

      double previousLow = low[j - 1];

//--- The current bar must close back at or above the gap boundary
      if(close[i] < previousLow)
         continue;

//--- Reject the signal if the gap was already filled earlier
      bool alreadyFilledEarlier = false;

      for(int k = j; k < i; k++)
        {
         if(close[k] >= previousLow)
           {
            alreadyFilledEarlier = true;
            break;
           }
        }

      if(!alreadyFilledEarlier)
         return true;
     }

   return false;
  }
The first branch handles immediate confirmation on the gap bar itself. The second branch searches backward through the permitted validity window for an earlier gap-down bar.
When an earlier gap is found, the current bar must close at or above the original previous low. The inner loop then inspects every bar between the gap and the current bar. If one of those bars had already closed through the same boundary, the setup has already produced its first fill and the current bar is rejected. This check is what prevents repeated bullish arrows from being generated by the same gap.
For a temporary test, replace OnCalculate() with the following version:
//+------------------------------------------------------------------+
//| Custom indicator iteration function                              |
//+------------------------------------------------------------------+
int OnCalculate(const int       rates_total,
                const int       prev_calculated,
                const datetime &time[],
                const double   &open[],
                const double   &high[],
                const double   &low[],
                const double   &close[],
                const long     &tick_volume[],
                const long     &volume[],
                const int      &spread[])
  {
   if(rates_total < 3)
      return 0;

   if(!InitializePriceArraysAsNonTimeSeries(open, high, low, close))
      return prev_calculated;

//--- Run the bullish diagnostic only during the first calculation
   if(prev_calculated == 0)
     {
      for(int i = 1; i < rates_total; i++)
        {
         if(IsBullishOopsSignalAtIndex(i, open, high, low, close))
           {
            PrintFormat("Bullish Oops signal detected at index %d. Close: %.*f",
                        i,
                        _Digits,
                        close[i]);
           }
        }
     }

   return rates_total;
  }
Compile the indicator and attach it to a chart containing suitable bullish examples. The Experts log should report same-bar confirmations and later first fills within the validity window. A later bar should not produce another message when an earlier bar has already filled the same gap.
After confirming the behaviour, restore the previous minimal OnCalculate() function before continuing.
Detecting Bearish Oops Signals
The bearish signal function mirrors the bullish implementation by reversing the price relationships. It searches for a valid gap above the previous high, then accepts either an immediate close back below that level or the first later close within the configured validity window.
Add the following function below IsBullishOopsSignalAtIndex():
//+------------------------------------------------------------------+
//| Returns true if a bearish Oops signal exists at the index        |
//+------------------------------------------------------------------+
bool IsBearishOopsSignalAtIndex(const int i,
                                const double &open[],
                                const double &high[],
                                const double &low[],
                                const double &close[])
  {
//--- Index 0 has no previous bar for gap comparison
   if(i < 1)
      return false;

//--- Path 1: the gap-up bar fills the gap by its own close
   if(IsGapUpAtIndex(i, open, high))
     {
      double previousHigh = high[i - 1];

      if(close[i] <= previousHigh)
         return true;
     }

//--- Path 2: search recent bars for an earlier valid gap up
   int startGapIndex = MathMax(1, i - maxGapValidityBars);

   for(int j = startGapIndex; j < i; j++)
     {
      if(!IsGapUpAtIndex(j, open, high))
         continue;

      double previousHigh = high[j - 1];

//--- The current bar must close back at or below the gap boundary
      if(close[i] > previousHigh)
         continue;

//--- Reject the signal if the gap was already filled earlier
      bool alreadyFilledEarlier = false;

      for(int k = j; k < i; k++)
        {
         if(close[k] <= previousHigh)
           {
            alreadyFilledEarlier = true;
            break;
           }
        }

      if(!alreadyFilledEarlier)
         return true;
     }

   return false;
  }
The function preserves the same first-fill-only rule used for bullish signals. A bearish signal is accepted only when the current bar is the first bar to close at or below the previous high associated with the original gap-up bar.
For a temporary test, replace OnCalculate() with the following version:
//+------------------------------------------------------------------+
//| Custom indicator iteration function                              |
//+------------------------------------------------------------------+
int OnCalculate(const int       rates_total,
                const int       prev_calculated,
                const datetime &time[],
                const double   &open[],
                const double   &high[],
                const double   &low[],
                const double   &close[],
                const long     &tick_volume[],
                const long     &volume[],
                const int      &spread[])
  {
   if(rates_total < 3)
      return 0;

   if(!InitializePriceArraysAsNonTimeSeries(open, high, low, close))
      return prev_calculated;

//--- Run the bearish diagnostic only during the first calculation
   if(prev_calculated == 0)
     {
      for(int i = 1; i < rates_total; i++)
        {
         if(IsBearishOopsSignalAtIndex(i, open, high, low, close))
           {
            PrintFormat("Bearish Oops signal detected at index %d. Close: %.*f",
                        i,
                        _Digits,
                        close[i]);
           }
        }
     }

   return rates_total;
  }
Compile the indicator and attach it to a chart containing bearish examples. The Experts log should report same-bar confirmations and later first fills, while bars that attempt to reuse an already filled gap should produce no message. After the test, restore the previous minimal OnCalculate() function before continuing.
Mapping Historical Signals
Once the indicator can recognise bullish and bearish Oops signals at a specific bar index, the next step is to project those results across the available chart history.
MapHistoricalOopsSignals() performs the initial historical scan. It clears the oldest position, evaluates each completed historical bar, calls the bullish and bearish signal functions, and writes the arrow prices into the corresponding buffers. The current forming bar is excluded so that only completed data is displayed.
Add the following function below IsBearishOopsSignalAtIndex():
//+------------------------------------------------------------------+
//| Maps all completed historical Oops signals                       |
//+------------------------------------------------------------------+
void MapHistoricalOopsSignals(const int rates_total,
                              const double &open[],
                              const double &high[],
                              const double &low[],
                              const double &close[])
  {
   if(rates_total < 3)
      return;

//--- Index 0 has no previous bar and cannot produce a signal
   bullishSignalBuffer[0] = EMPTY_VALUE;
   bearishSignalBuffer[0] = EMPTY_VALUE;

//--- Evaluate completed historical bars only
   for(int i = 1; i < rates_total - 1; i++)
     {
      bullishSignalBuffer[i] = EMPTY_VALUE;
      bearishSignalBuffer[i] = EMPTY_VALUE;

      if(IsBullishOopsSignalAtIndex(i, open, high, low, close))
         bullishSignalBuffer[i] = low[i] - (10 * _Point);

      if(IsBearishOopsSignalAtIndex(i, open, high, low, close))
         bearishSignalBuffer[i] = high[i] + (10 * _Point);
     }

//--- Keep the current forming bar empty
   int currentIndex = rates_total - 1;

   bullishSignalBuffer[currentIndex] = EMPTY_VALUE;
   bearishSignalBuffer[currentIndex] = EMPTY_VALUE;
  }
The bullish arrow is placed slightly below the signal bar using:
low[i] - (10 * _Point)
The bearish arrow is placed slightly above the signal bar using:
high[i] + (10 * _Point)
The offset keeps the arrows clear of the candle without changing the underlying signal logic. To test the historical mapping, replace OnCalculate() temporarily with the following version:
//+------------------------------------------------------------------+
//| Custom indicator iteration function                              |
//+------------------------------------------------------------------+
int OnCalculate(const int       rates_total,
                const int       prev_calculated,
                const datetime &time[],
                const double   &open[],
                const double   &high[],
                const double   &low[],
                const double   &close[],
                const long     &tick_volume[],
                const long     &volume[],
                const int      &spread[])
  {
   if(rates_total < 3)
      return 0;

   if(!InitializePriceArraysAsNonTimeSeries(open, high, low, close))
      return prev_calculated;

//--- Map the complete signal history during the first calculation
   if(prev_calculated == 0)
     {
      ArrayInitialize(bullishSignalBuffer, EMPTY_VALUE);
      ArrayInitialize(bearishSignalBuffer, EMPTY_VALUE);

      MapHistoricalOopsSignals(rates_total, open, high, low, close);
     }

   return rates_total;
  }
Compile the indicator and attach it to a chart. If the implementation is correct, MetaEditor should report zero errors and zero warnings. Historical bullish and bearish arrows should appear on completed bars, the current forming bar should remain empty, and the first-fill checks should prevent repeated arrows from the same gap.
Updating the Latest Completed Bar
After the historical signals have been mapped, the indicator should avoid scanning the entire chart whenever a new bar appears. Only the latest completed bar needs to be checked because the earlier buffer values are already established.
Under direct indexing, the two relevant positions are:
signalIndex  = rates_total - 2;
currentIndex = rates_total - 1;
signalIndex identifies the bar that has just closed, while currentIndex identifies the active bar that is still forming. Add the following function below MapHistoricalOopsSignals():
//+------------------------------------------------------------------+
//| Updates the signal on the latest completed bar                   |
//+------------------------------------------------------------------+
void UpdateLatestOopsSignalOnNewBar(const int rates_total,
                                    const double &open[],
                                    const double &high[],
                                    const double &low[],
                                    const double &close[])
  {
   if(rates_total < 3)
      return;

   int signalIndex  = rates_total - 2;
   int currentIndex = rates_total - 1;

//--- Clear the latest completed and current bars before recalculation
   bullishSignalBuffer[signalIndex]  = EMPTY_VALUE;
   bearishSignalBuffer[signalIndex]  = EMPTY_VALUE;
   bullishSignalBuffer[currentIndex] = EMPTY_VALUE;
   bearishSignalBuffer[currentIndex] = EMPTY_VALUE;

//--- Evaluate the latest completed bar using the established rules
   if(IsBullishOopsSignalAtIndex(signalIndex, open, high, low, close))
      bullishSignalBuffer[signalIndex] = low[signalIndex] - (10 * _Point);

   if(IsBearishOopsSignalAtIndex(signalIndex, open, high, low, close))
      bearishSignalBuffer[signalIndex] = high[signalIndex] + (10 * _Point);
  }
The function clears both output buffers at the latest completed and current bar positions before applying the signal checks. This removes stale values and ensures that the active bar remains empty. A new arrow is written only when the completed bar satisfies one of the established Oops rules.
For testing, replace OnCalculate() temporarily with the following version:
//+------------------------------------------------------------------+
//| Custom indicator iteration function                              |
//+------------------------------------------------------------------+
int OnCalculate(const int       rates_total,
                const int       prev_calculated,
                const datetime &time[],
                const double   &open[],
                const double   &high[],
                const double   &low[],
                const double   &close[],
                const long     &tick_volume[],
                const long     &volume[],
                const int      &spread[])
  {
   if(rates_total < 3)
      return 0;

   if(!InitializePriceArraysAsNonTimeSeries(open, high, low, close))
      return prev_calculated;

//--- Map all historical signals when the indicator is first loaded
   if(prev_calculated == 0)
     {
      ArrayInitialize(bullishSignalBuffer, EMPTY_VALUE);
      ArrayInitialize(bearishSignalBuffer, EMPTY_VALUE);

      MapHistoricalOopsSignals(rates_total, open, high, low, close);
     }

//--- Update only the latest completed bar when new data is added
   if(prev_calculated > 0 && prev_calculated < rates_total)
      UpdateLatestOopsSignalOnNewBar(rates_total, open, high, low, close);

   return rates_total;
  }
Compile the indicator and run it while a new bar forms, or test it in the Strategy Tester visual mode. If the implementation is correct, the latest completed bar should be evaluated without rebuilding the earlier signal history, while the active bar remains free of arrows.
Completing the Calculation Workflow
The final OnCalculate() function connects the complete indicator workflow. It prepares the price arrays, rebuilds the historical buffers when necessary, and limits normal updates to the latest completed bar.
Replace the current OnCalculate() function with the following version:
//+------------------------------------------------------------------+
//| Custom indicator iteration function                              |
//+------------------------------------------------------------------+
int OnCalculate(const int       rates_total,
                const int       prev_calculated,
                const datetime &time[],
                const double   &open[],
                const double   &high[],
                const double   &low[],
                const double   &close[],
                const long     &tick_volume[],
                const long     &volume[],
                const int      &spread[])
  {
//--- Ensure enough bars are available for comparison and updating
   if(rates_total < 3)
      return 0;

//--- Apply direct indexing to the incoming price arrays
   if(!InitializePriceArraysAsNonTimeSeries(open, high, low, close))
      return prev_calculated;

//--- Rebuild all signals on first launch or after a history reset;
//--- or when multiple new bars become available at once
   if(prev_calculated == 0 || prev_calculated > rates_total || rates_total - prev_calculated > 1)
     {
      ArrayInitialize(bullishSignalBuffer, EMPTY_VALUE);
      ArrayInitialize(bearishSignalBuffer, EMPTY_VALUE);

      MapHistoricalOopsSignals(rates_total, open, high, low, close);

      return rates_total;
     }

//--- Update only the latest completed bar when new data is added
   if(prev_calculated < rates_total)
      UpdateLatestOopsSignalOnNewBar(rates_total, open, high, low, close);

   return rates_total;
  }
The first calculation initializes both buffers and maps the available historical signals. The indicator also performs a full recalculation when prev_calculated exceeds rates_total, indicating that the available chart history was reset or reduced, or when rates_total - prev_calculated is greater than one, indicating that multiple new bars became available between calculations.
During normal operation, the historical buffers remain unchanged. When the number of available bars increases, only the latest completed bar is passed to UpdateLatestOopsSignalOnNewBar().
Compile the completed indicator in MetaEditor. If all sections have been implemented correctly, the compiler should report zero errors and zero warnings. After attaching the indicator to a chart, confirm that the historical arrows and newly generated arrows follow the same bullish, bearish, validity-window, and first-fill rules.
Visual Verification
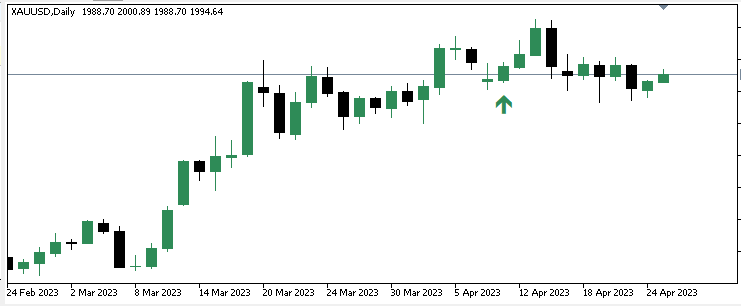
The completed indicator can be verified with two clear chart examples: one bullish signal and one bearish signal. The purpose is to confirm that the indicator places each arrow in the correct direction and position.
Bullish signal
Locate a bullish Oops setup where price fills a valid gap down. The indicator should place a sea-green arrow below the confirmation bar.
Bearish signal
Locate a bearish Oops setup where price fills a valid gap up. The indicator should place a black arrow above the confirmation bar.
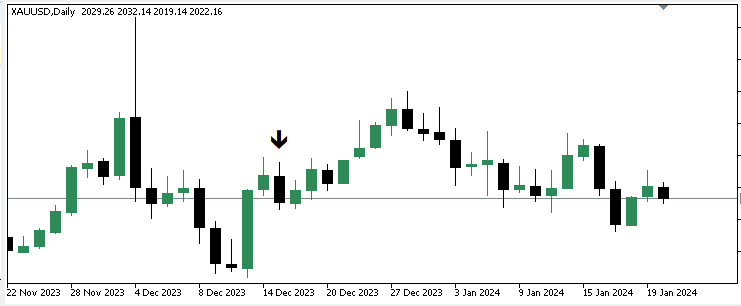
These two examples confirm that the indicator displays bullish and bearish signals in the expected chart positions.
Indicator Behavior and Limitations
The indicator confirms signals using bar-closing prices. It does not issue a final signal from the current forming bar, so arrows are written only after the relevant bar has closed.
Each qualifying gap can produce only one arrow. Once the first valid fill has been detected, later bars crossing the same boundary are ignored.
The main configuration values use different units:
- minimumGapSizePoints is measured in symbol points.
- maxGapValidityBars is measured in completed bars.
The displayed results may vary between brokers because historical prices, daily session boundaries, and available chart data are not always identical.
The indicator is limited to visual signal detection. It does not execute trades or apply trend, spread, session, or news filters.
Conclusion
Following the formalized rules — minimum gap size in points, confirmation by close, a limited validity window, and the first-fill-only condition — the article delivers a ready-to-compile MQL5 custom indicator, "lwOopsPatternIndicator.mq5", that provides a reproducible implementation of the stated Oops Gap Reversal rules for analysis and testing.
Key outcomes:
- Visual signals are drawn only on confirmed, already closed bars, with sea-green arrows for bullish signals and black arrows for bearish signals.
- Two indicator buffers store the bullish and bearish outputs.
- On the first calculation, the indicator maps the available historical signals; during normal operation, it updates only the most recently completed bar to avoid unnecessary full recalculations.
- The implementation enforces the first-fill-only rule so that each qualifying gap can generate at most one signal within the configured validity window.
- The minimumGapSizePoints and maxGapValidityBars inputs are validated and can be configured through the indicator settings.
The implementation also has clear limits. Signals are confirmed by bar close only, the indicator does not place trades or apply trend, spread, session, or news filters, and the displayed results may vary between brokers because historical prices, session boundaries, and available chart data can differ. The indicator is therefore intended as a consistent, research-oriented tool for studying Oops gap reversals rather than a turnkey trading system.
Attached File
Only the indicator source file is attached to this article because no additional resources are required.
| File Name | Description |
|---|---|
| lwOopsPatternIndicator.mq5 | Complete custom indicator developed in the article |
The project is also available in the Algo Forge repository:
Warning: All rights to these materials are reserved by MetaQuotes Ltd. Copying or reprinting of these materials in whole or in part is prohibited.
This article was written by a user of the site and reflects their personal views. MetaQuotes Ltd is not responsible for the accuracy of the information presented, nor for any consequences resulting from the use of the solutions, strategies or recommendations described.

 Implementing a Trade Throttle and Rate Limiter in MQL5
 Building a Gold Volatility Regime Monitor from Options Data in MQL5
 Price Action Analysis Toolkit Development (Part 79): Extending the Indicator Search Panel with Dynamic Input Parameter Configuration
 Building a Compile-Time Unit Testing Framework in MQL5 Using Preprocessor Assertions

- Free trading apps
- Over 8,000 signals for copying
- Economic news for exploring financial markets
You agree to website policy and terms of use