

Building a Volume-Based Liquidity Heatmap Indicator in MQL5
 3 534
3 534
 2
2

Introduction
MetaTrader 5 provides price and volume data but does not offer a built-in chart visualization layer for highlighting where clustered leveraged positions are likely to be concentrated. Since retail indicators cannot access exchange-level liquidation or open-interest data, this task becomes an engineering reconstruction that uses only OHLC and volume data to detect volume spikes, convert those spikes into estimated liquidation prices under an assumed leverage, rank the resulting zones by relative signal strength, and manage their lifecycle on the chart (create → extend forward → freeze once swept).
The Liquidity Heatmap indicator:
- identifies above-average volume candles (volume > SMA);
- converts each qualified candle into a long or short estimated liquidation level based on candle direction and user-defined leverage;
- visualizes and ranks these levels using lines and multi-tier bubbles;
- manages object limits and prevents duplication using bar timestamps.
The indicator is designed as a probabilistic, analysis-oriented tool for highlighting potential liquidity clusters for manual or automated analysis. It can help identify possible stop-hunt zones and provide additional confluence with structural price analysis, but it does not represent actual exchange liquidation events.
Project Overview and Implementation Plan
A good implementation starts with a clear understanding of what has to be constructed and the order in which it must be constructed. This section describes the Liquidity Heatmap indicator's implementation plan, offering a methodical roadmap that directs the development process from setup to visualization.
Project Overview and Implementation Plan
A good implementation starts with a clear understanding of what has to be constructed and the order in which it must be constructed. This section describes the Liquidity Heatmap indicator's implementation plan, offering a methodical roadmap that directs the development process from setup to visualization.
What We Are Building
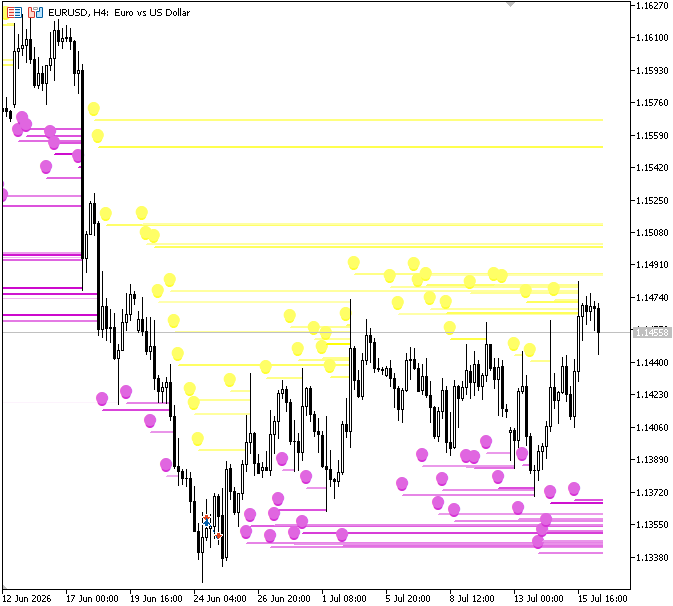
MetaTrader 5 provides OHLC price data and volume information, but it does not provide direct access to exchange-level liquidation data, open interest, or the distribution of leveraged positions. Therefore, an indicator running on MetaTrader 5 cannot identify actual liquidation events or confirm where forced position closures occur. To overcome this limitation, the Liquidity Heatmap indicator is designed as an estimation tool that uses available market data to identify areas where liquidity may be concentrated. Since direct liquidation information is unavailable, the indicator uses high-volume activity as a proxy for potential liquidity concentration.
A candle is considered a qualified signal when its volume exceeds the average volume of the previous 14 candles:

This approach assumes that unusually high trading activity may indicate areas where significant market participation occurred.
After a candle qualifies, its direction determines which side of the market is evaluated:
- Bullish candles are used to estimate potential long liquidation zones.
- Bearish candles are used to estimate potential short liquidation zones.
The user-defined leverage value controls the distance used to calculate the estimated liquidation level. Because not all high-volume events represent the same level of market activity, qualified signals are compared with previous signals stored in a rolling buffer. The indicator evaluates minimum signal strength, maximum signal strength, and average signal strength. These measurements allow the indicator to identify stronger volume events and assign them greater visual importance.
The final output is a chart-based heatmap showing estimated liquidity zones using lines and bubble markers. However, these zones should not be interpreted as actual liquidation locations because the calculation relies on indirect measurements. High volume may occur because of other market events, and the simplified leverage model does not account for exchange-specific margin rules or trader position details. Therefore, the indicator is intended to highlight potential liquidity areas for analysis rather than provide confirmed liquidation data.
The indicator provides two methods for evaluating the strength of qualified volume signals. In HD mode, signals are ranked using the candle's total volume, allowing the indicator to highlight periods with the highest trading activity. In Normal mode, signals are evaluated using the change in volume compared with the previous candle, allowing sudden increases in market participation to receive greater importance. Therefore, HD mode emphasizes absolute trading activity, while Normal mode focuses on unusual changes in participation.
Implementation Plan
A clear development roadmap should be established before starting the implementation process. This section will outline the steps required to create the Liquidity Heatmap indicator in MQL5.
1. Data Constraints and Signal Formalization
Before creating chart objects or calculating liquidation levels, the indicator must define how available market data will be converted into meaningful signals. Since MetaTrader 5 does not provide direct liquidation information, the indicator uses volume activity, candle direction, and leverage assumptions to estimate potential liquidity zones.
This stage includes:
1.1 Defining Indicator Properties, Modes, and Input Parameters
The first step establishes the configuration required for the estimation model.
The indicator defines:
- calculation mode used to evaluate qualified volume signals;
- market side to display (long, short, or both);
- leverage value used to estimate liquidation levels;
- volume source selection;
- volume averaging period;
- lookback range;
- visualization settings;
- object limits.
1.2 Identifying High-Volume Trigger Candles
Since direct liquidation data is unavailable, the indicator uses unusually high volume as a proxy for significant market activity.
During this step, it:
- processes candles within the selected lookback range;
- selects real volume or tick volume;
- calculates the 14-period SMA of volume;
- compares current volume against the SMA;
- classifies candles with above-average volume as qualified signals.
2. Ranking Buffer and Signal Strength Metrics
Not every qualified volume candle represents the same level of market activity. Therefore, the indicator stores detected signals and compares them with previous events to determine their relative strength.
This stage includes:
2.1 Creating the Rolling Volume Signal Buffer
The indicator stores qualified volume events for later comparison.
The indicator:
- stores raw volume values in HD mode;
- stores volume change in Normal mode;
- updates signals from the current candle;
- removes older entries when the buffer limit is reached.
2.2 Calculating Signal Strength Metrics
The indicator evaluates stored signals using statistical measurements.
It calculates:
- minimum signal value;
- maximum signal value;
- average signal value.
These metrics are used to determine whether a signal represents weak, average, or strong market activity.
3. Object Construction and Maintenance
After signals have been identified and ranked, the indicator converts them into chart-based liquidity zones and manages their lifecycle.
This stage includes:
3.1 Drawing Estimated Liquidation Levels
The indicator transforms ranked volume signals into estimated liquidation prices.
The indicator:
- determines candle direction;
- checks the selected market side;
- calculates long or short liquidation levels using leverage;
- assigns visual properties based on signal strength;
- creates the chart level.
3.2 Maintaining Active Liquidation Levels
Created zones remain active until price interacts with them.
The indicator:
- extends untouched levels forward;
- checks whether price sweeps the zone;
- stops extending completed levels.
3.3 Visualizing Signal Strength with Bubble Markers
Bubble markers provide an additional visual representation of signal strength
The indicator:
- creates markers for qualified signals;
- increases marker size for stronger events;
- highlights peak-volume signals.
Implementation in MQL5
This chapter converts the planned logic into a fully functional MQL5 indicator.
Defining Indicator Properties, Modes, and Input Parameters
The first step is:
#property indicator_chart_window
#property indicator_buffers 0
#property indicator_plots   0

//--- Display mode: how the "signal volume" buffer is fed
enum ENUM_HEATMAP_MODE
  {
   MODE_HD     = 0,  // HD     - use raw volume for gradient weighting
   MODE_NORMAL = 1   // Normal - use volume delta (change vs previous bar)
  };

//--- Which side of the book to display
enum ENUM_HEATMAP_SIDE
  {
   SIDE_BOTH  = 0,
   SIDE_LONG  = 1,
   SIDE_SHORT = 2
  };

//--- Inputs
input ENUM_HEATMAP_MODE   InpMode          = MODE_HD;        // Mode
input ENUM_HEATMAP_SIDE   InpSide          = SIDE_BOTH;      // Display side
input int                 InpLeverage      = 300;            // Leverage (25-300)
input color               InpLongColor     = C'204,0,204';   // Long liquidation color
input color               InpShortColor    = C'255,255,0';   // Short liquidation color
input color               InpPeakColor     = C'255,255,255'; // Peak (max-volume) color
input bool                InpShowBubbles  = true;            // Display liquidation bubbles
input bool                InpShowLevels   = true;            // Display liquidation levels
input bool                InpUseRealVolume= true;            // Prefer real volume over tick volume
input int                 InpSmaPeriod    = 14;              // Volume SMA period (trigger filter)
input int                 InpLookbackBars = 500;             // Lookback bars to calculate on
input int                 InpMaxLines     = 500;             // Max stored liquidation lines
input int                 InpMaxBubbles   = 1500;            // Max stored bubble markers
Explanation:
At the beginning of the indicator, we define the basic properties, calculation modes, and user-controlled settings that determine how the Liquidity Heatmap operates. The indicator properties specify that the program will be displayed directly on the main chart window rather than in a separate indicator subwindow. Since all visual elements are created using chart objects such as lines and bubbles, the indicator does not require traditional indicator buffers or plots. Next, two enumeration types are created to control the indicator's behavior. The first enumeration defines the volume calculation mode. In HD mode, the indicator uses the raw volume value of qualified candles when ranking signal strength, while Normal mode uses the change in volume compared with the previous candle, allowing sudden increases in activity to receive higher importance.
The second enumeration controls which type of liquidation zones are displayed on the chart. The SIDE_LONG option represents liquidation levels generated from bullish candles, where the indicator estimates the price area below the candle where leveraged long positions could potentially be liquidated. Next, the SIDE_SHORT option represents liquidation levels generated from bearish candles, where the estimated liquidation area is placed above the candle for potential short-position liquidations. The SIDE_BOTH option enables both conditions, allowing the indicator to display liquidation zones from both bullish and bearish candles. This gives users control over whether they want to analyze only long-side liquidity, only short-side liquidity, or all estimated liquidation zones together.
Finally, the input parameters provide customization options for the user. These settings control the selected calculation mode, displayed liquidation side, assumed leverage level, colors used for different liquidation zones, whether bubble markers and levels are visible, the preferred volume source, the number of candles used for the volume comparison, and the maximum number of stored chart objects. By keeping these values as inputs, the same indicator can be adapted to different markets and trading styles without modifying the source code.
Identifying High-Volume Trigger Candles
The indicator now identifies high-volume candles.
Note: We will highlight the specific code sections related to each implementation stage as we progress, ensuring each part is clearly understood on its own without mixing it with previously explained sections.
Example:
datetime last_bar_time;

//+------------------------------------------------------------------+
//| Custom indicator initialization function                         |
//+------------------------------------------------------------------+
int OnInit()
  {
//--- indicator buffers mapping

//---
   return(INIT_SUCCEEDED);
  }
//+------------------------------------------------------------------+
//| Custom indicator deinitialization function                       |
//+------------------------------------------------------------------+
void OnDeinit(const int reason)
  {

  }
//+------------------------------------------------------------------+
//| Custom indicator iteration function                              |
//+------------------------------------------------------------------+
int OnCalculate(const int32_t rates_total,
                const int32_t prev_calculated,
                const datetime &time[],
                const double &open[],
                const double &high[],
                const double &low[],
                const double &close[],
                const long &tick_volume[],
                const long &volume[],
                const int32_t &spread[])
  {
//---
   if(rates_total < InpSmaPeriod + 2)
      return(0);

   int limit;
   if(prev_calculated <= 1)
     {
      int startFromLookback = (InpLookbackBars > 0)
                              ? rates_total - InpLookbackBars
                              : InpSmaPeriod;

      limit = MathMax(InpSmaPeriod, startFromLookback);
     }
   else
     {
      limit = prev_calculated - 1;
      if(limit < InpSmaPeriod)
         limit = InpSmaPeriod;
     }
//--- Get the opening time of the current daily bar
   datetime currentBarTime = iTime(_Symbol, PERIOD_CURRENT, 0);

   if(currentBarTime != last_bar_time)
     {
//--- main bar-by-bar pass (mirrors: sV() -> switch draw -> uL(), called every bar)
   for(int i = limit; i < rates_total; i++)
     {
      long rawVol = (InpUseRealVolume && volume[i] > 0) ? volume[i] : tick_volume[i];
      double vol  = (double)rawVol;

      //--- SMA(volume, InpSmaPeriod) trailing window ending at i
      double smaSum = 0.0;
      for(int k = i - InpSmaPeriod + 1; k <= i; k++)
        {
         long v = (InpUseRealVolume && volume[k] > 0) ? volume[k] : tick_volume[k];
         smaSum += (double)v;
        }
      double sma = smaSum / InpSmaPeriod;

      bool fT = vol > sma; // "above-average volume" trigger

      if(fT)
        {
         //QUALIFIED BAR
        }
     }
last_bar_time = currentBarTime;
}

//--- return value of prev_calculated for next call
   return(rates_total);
  }
Explanation:
The first step in the process is to check whether enough historical candles are available before starting the calculation. Since the indicator uses a volume SMA as a filter, it needs at least the number of candles defined by the SMA period plus additional candles to perform a reliable analysis. If the chart does not contain enough data, the calculation is stopped to prevent inaccurate volume comparisons.
The indicator decides where the computation should start after verifying that there is sufficient data. It determines whether to examine all the available history or just a certain number of recent candles by checking the lookback option during the initial run. This prevents unnecessary calculations on huge datasets. On later updates, instead of recalculating all candles again, the indicator continues from the last processed position and rechecks the latest candle to account for new price updates.
After that, the program detects the opening time of the current chart bar and compares it with the opening time stored from the previous calculation. If the two values differ, it indicates that a new bar has formed. The indicator then updates the stored timestamp to the current bar's opening time, allowing subsequent calculations or chart updates to be performed only once per newly completed bar rather than on every incoming tick. This improves efficiency by preventing unnecessary repeated processing while the current bar is still forming. The program then processes each candle individually and retrieves its volume value. It first checks whether real volume is available and enabled by the user. If real volume data exists, it is used for the calculation. However, if real volume is unavailable, the indicator automatically switches to tick volume, ensuring that the indicator remains compatible with different brokers and markets.
For every processed candle, the indicator calculates the volume Simple Moving Average (SMA) using the selected period, which is 14 candles by default. The SMA represents the average trading activity of the recent candles and acts as a dynamic reference point. By using a moving average instead of a fixed value, the indicator can adapt to different market conditions where volume levels naturally change over time. Finally, the current candle's volume is compared with the calculated SMA value. If the candle volume is greater than the average volume, it is classified as a valid high-volume trigger candle and moves to the next stage of the calculation. Candles that do not exceed the average volume are ignored because they do not represent significant enough market activity to generate a potential liquidation zone.
Creating the Rolling Volume Signal Buffer
As planned, step three is:
//--- rolling "signal volume" buffer (mirrors Pine's bin.v)
double   g_volBuf[];
datetime g_volBufTime[];

//+------------------------------------------------------------------+
//| Push a value into the rolling volume buffer (mirrors sV()).      |
//| Same-bar re-entry (still-forming bar on a new tick) updates in   |
//| place instead of duplicating.                                    |
//+------------------------------------------------------------------+
void PushVolume(const datetime barTime,const double vol,const bool havePrev,const double prevVol)
  {
   double value = (InpMode == MODE_HD) ? vol : (havePrev ? vol - prevVol : vol);

   int size = ArraySize(g_volBuf);
   if(size > 0 && g_volBufTime[size-1] == barTime)
     {
      g_volBuf[size-1] = value;
      return;
     }

   if(size >= InpMaxLines)
     {
      ArrayRemove(g_volBuf,     0, 1);
      ArrayRemove(g_volBufTime, 0, 1);
      size--;
     }

   ArrayResize(g_volBuf,     size + 1);
   ArrayResize(g_volBufTime, size + 1);
   g_volBuf[size]     = value;
   g_volBufTime[size] = barTime;
  }

//+------------------------------------------------------------------+
//| Custom indicator initialization function                         |
//+------------------------------------------------------------------+
int OnInit()
  {
//--- indicator buffers mapping
   ArrayResize(g_volBuf,      0);
   ArrayResize(g_volBufTime,  0);

//---
   return(INIT_SUCCEEDED);
  }
//--- main bar-by-bar pass (mirrors: sV() -> switch draw -> uL(), called every bar)
for(int i = limit; i < rates_total; i++)
  {
   long rawVol = (InpUseRealVolume && volume[i] > 0) ? volume[i] : tick_volume[i];
   double vol  = (double)rawVol;

//--- SMA(volume, InpSmaPeriod) trailing window ending at i
   double smaSum = 0.0;
   for(int k = i - InpSmaPeriod + 1; k <= i; k++)
     {
      long v = (InpUseRealVolume && volume[k] > 0) ? volume[k] : tick_volume[k];
      smaSum += (double)v;
     }
   double sma = smaSum / InpSmaPeriod;

   bool fT = vol > sma; // "above-average volume" trigger

   if(fT)
     {
      bool   havePrev = (i > 0);
      long   prevRaw  = havePrev ? ((InpUseRealVolume && volume[i-1] > 0) ? volume[i-1] : tick_volume[i-1]) : rawVol;
      double prevVol  = (double)prevRaw;

      PushVolume(time[i], vol, havePrev, prevVol);
     }
  }
Explanation:
PushVolume() maintains a rolling buffer of volume values from qualified candles. The indicator uses this buffer to rank each signal's relative strength. It relies on two parallel dynamic arrays, one storing the calculated volume value and the other storing the matching candle timestamp, both cleared in OnInit() so each run starts clean. The chosen mode influences the value stored: Normal mode keeps the volume delta from the previous candle, allowing a quick spike to rank well even without the highest overall volume, whereas HD mode stores the candle's raw volume; thus, total trading activity determines ranking.
To manage candles that are still forming in real time, the function first determines whether the timestamp of the current candle matches the most recent one that was stored. If it does, the current value is changed in place rather than making a copy. The oldest item is eliminated before the new one is entered once the buffer hits the InpMaxLines limit, maintaining the buffer as a fixed-size rolling window of only the most recent qualified signals. Without this buffer, the indicator would have no consistent way to compare a candle's strength against its recent peers, which is precisely what later determines each zone's tier, color, and line or bubble size.
Calculating Signal Strength Metrics
As planned, step four is:
//+------------------------------------------------------------------+
//| Return the latest stored volume signal value from the buffer.    |
//| This represents the volume value of the most recent qualified    |
//| high-volume candle used for liquidation level ranking.           |
//+------------------------------------------------------------------+
double VolFirst()
  {
   int n = ArraySize(g_volBuf);
   return(n > 0 ? g_volBuf[n-1] : 0.0);
  }

//+------------------------------------------------------------------+
//| Calculate the minimum volume value stored in the rolling buffer. |
//| This value is used as the lower boundary when comparing the      |
//| relative strength of qualified volume signals.                  |
//+------------------------------------------------------------------+
double VolMin()
  {
   int n = ArraySize(g_volBuf);

   if(n == 0)
      return(0.0);

   double m = g_volBuf[0];

   for(int i = 1; i < n; i++)
      if(g_volBuf[i] < m)
         m = g_volBuf[i];

   return(m);
  }

//+------------------------------------------------------------------+
//| Calculate the maximum volume value stored in the rolling buffer. |
//| The highest value is used to identify peak volume signals and    |
//| assign stronger visual properties to important liquidation zones.|
//+------------------------------------------------------------------+
double VolMax()
  {
   int n = ArraySize(g_volBuf);

   if(n == 0)
      return(0.0);

   double m = g_volBuf[0];

   for(int i = 1; i < n; i++)
      if(g_volBuf[i] > m)
         m = g_volBuf[i];

   return(m);
  }

//+------------------------------------------------------------------+
//| Calculate the average volume value stored in the rolling buffer. |
//| The average is used as a benchmark to determine whether the      |
//| current volume signal has above-average strength.                |
//+------------------------------------------------------------------+
double VolAvg()
  {
   int n = ArraySize(g_volBuf);

   if(n == 0)
      return(0.0);

   double s = 0.0;

   for(int i = 0; i < n; i++)
      s += g_volBuf[i];

   return(s / n);
  }
Explanation:
The VolFirst() function returns the most recently stored qualified volume signal. Since new signals are constantly added to the end of the rolling buffer, this value represents the candle currently being processed and serves as the reference for all subsequent comparisons. The VolMin() function scans the entire rolling buffer and returns the smallest stored volume value. This establishes the lower boundary of the current range of qualified volume signals.
Similarly, the VolMax() function scans the buffer and returns the highest stored volume value. This identifies the strongest qualified volume event currently available and is later used to determine whether the current candle represents a peak volume signal. The VolAvg() function calculates the arithmetic mean of every stored value in the rolling buffer. Rather than comparing the current signal only against the strongest or weakest event, this average provides a benchmark that allows the indicator to determine whether the latest qualified signal is above or below the overall average strength of recent volume events.
Drawing Estimated Liquidation Levels
This is the next step of the implementation plan.
Example:
//--- rolling liquidation-line registry (mirrors Pine's bin.l)
string   g_lineNames[];
datetime g_lineTimes[];

//--- object naming prefix (used for cleanup on deinit)
#define LQH_PREFIX "LQH_"

//+------------------------------------------------------------------+
//| Create a liquidation-level line (mirrors dL()). Object name is   |
//| keyed to the bar's timestamp so repeated ticks on the still-     |
//| forming bar never create duplicates.                             |
//+------------------------------------------------------------------+
void CreateLine(const datetime barTime,const double pos,const color css,const int width)
  {
   string name = LQH_PREFIX + "LN_" + (string)(long)barTime;
   if(ObjectFind(0, name) >= 0)
      return;

   int size = ArraySize(g_lineNames);
   if(size >= InpMaxLines)
     {
      ObjectDelete(0, g_lineNames[0]);
      ArrayRemove(g_lineNames, 0, 1);
      ArrayRemove(g_lineTimes, 0, 1);
      size--;
     }

   ObjectCreate(0, name, OBJ_TREND, 0, barTime, pos, barTime, pos);
   ObjectSetInteger(0, name, OBJPROP_COLOR,      css);
   ObjectSetInteger(0, name, OBJPROP_STYLE,      STYLE_SOLID);
   ObjectSetInteger(0, name, OBJPROP_WIDTH,      width);
   ObjectSetInteger(0, name, OBJPROP_RAY_RIGHT,  false);
   ObjectSetInteger(0, name, OBJPROP_RAY_LEFT,   false);
   ObjectSetInteger(0, name, OBJPROP_BACK,       true);
   ObjectSetInteger(0, name, OBJPROP_SELECTABLE, false);
   ObjectSetInteger(0, name, OBJPROP_HIDDEN,     true);

   ArrayResize(g_lineNames, size + 1);
   ArrayResize(g_lineTimes, size + 1);
   g_lineNames[size] = name;
   g_lineTimes[size] = barTime;
  }

//+------------------------------------------------------------------+
//| Custom indicator initialization function                         |
//+------------------------------------------------------------------+
int OnInit()
  {
//--- indicator buffers mapping
   ArrayResize(g_volBuf,      0);
   ArrayResize(g_volBufTime,  0);
   ArrayResize(g_lineNames,   0);
   ArrayResize(g_lineTimes,   0);

//---
   return(INIT_SUCCEEDED);
  }
Explanation:
The actual creation of every estimated liquidation level is handled by the CreateLine() function. The first operation generates a unique object name by combining the common indicator prefix with the candle's opening timestamp. Since every candle has a unique opening time, each liquidation level automatically receives its own unique identifier. Additionally, the program keeps duplicate liquidation levels from showing up while the current candle is still getting ticks. It accomplishes this by determining whether the chart already has a line with the same unique identifier. The function ensures that only one liquidation level is formed for each eligible candle by simply returning if the line is discovered.
Next, it checks whether the number of stored liquidation levels has reached the maximum value defined by InpMaxLines. If the storage limit has been reached, the oldest liquidation line is removed from both the chart and the internal tracking arrays before a new one is created. This creates a rolling collection of active liquidation levels while preventing unlimited object growth. Once sufficient storage space is available, the function creates a horizontal trend line positioned at the calculated liquidation price. Initially, both the starting point and ending point are placed at the same candle and price level, producing a zero-length line. As new candles arrive, another function later extends the endpoint forward in time while keeping the price unchanged, allowing the liquidation level to grow horizontally until it is eventually swept by price. After creating the object, several visual properties are configured. The function applies the calculated color and width, uses a solid line style, disables left and right ray extensions so the line can be controlled manually, draws the object in the background, prevents users from accidentally selecting it with the mouse, and hides it from the platform's object list.
Finally, the function stores both the object name and its corresponding candle timestamp inside the rolling tracking arrays. These arrays allow the indicator to locate every active liquidation level later, making it possible to extend the line on subsequent candles or stop extending it once the level has been swept by price. Before the indicator can assign a visual appearance to each liquidation level, it first needs to determine how strong the current volume signal is relative to the other qualified signals stored in the rolling buffer. This comparison is handled by four helper functions that retrieve statistical information from the buffer.
The next step is to create functions that analyze the rolling volume buffer and use the results to calculate and draw estimated liquidation levels.
Example:
//+------------------------------------------------------------------+
//| Blend from opaque white toward target color, based on value's    |
//| position between vmin/vmax. Stands in for Pine's                 |
//| color.from_gradient(value, min, max, #ffffff00, target) --       |
//| MQL5 objects have no alpha channel, so we fade to white instead  |
//| of to transparent.                                               |
//+------------------------------------------------------------------+
color GradientColor(const double value,const double vmin,const double vmax,const color target)
  {
   double ratio = 1.0;
   if(vmax > vmin)
      ratio = (value - vmin) / (vmax - vmin);
   ratio = MathMax(0.0, MathMin(1.0, ratio));

   uchar r2 = (uchar)(target & 0xFF);
   uchar g2 = (uchar)((target >> 8) & 0xFF);
   uchar b2 = (uchar)((target >> 16) & 0xFF);

   uchar r = (uchar)(255 + (r2 - 255) * ratio);
   uchar g = (uchar)(255 + (g2 - 255) * ratio);
   uchar b = (uchar)(255 + (b2 - 255) * ratio);

   return((color)(r | (g << 8) | (b << 16)));
  }

//+------------------------------------------------------------------+
//| Draw the liquidation-level line for this bar (mirrors the        |
//| lL-gated branch of draw()'s switch statement).                   |
//+------------------------------------------------------------------+
void DrawLevel(const int i,const double &open[],const double &high[],const double &low[],
               const double &close[],const datetime &time[])
  {
   if(!InpShowLevels)
      return;

   bool bullish    = close[i] > open[i];
   bool bearish    = close[i] < open[i];
   bool allowLong  = (InpSide == SIDE_BOTH || InpSide == SIDE_LONG);
   bool allowShort = (InpSide == SIDE_BOTH || InpSide == SIDE_SHORT);

   double vFirst = VolFirst();
   double vMax   = VolMax();
   double vMin   = VolMin();
   double vAvg   = VolAvg();
   bool   isPeak = (vFirst == vMax);
   int    width  = isPeak ? 3 : (vFirst > vAvg ? 2 : 1);

   if(bullish && allowLong)
     {
      double pos = low[i] * (1.0 - 1.0 / InpLeverage);
      color  css = GradientColor(vFirst, vMin, vMax, isPeak ? InpPeakColor : InpLongColor);
      CreateLine(time[i], pos, css, width);
     }
   else
      if(bearish && allowShort)
        {
         double pos = high[i] * (1.0 + 1.0 / InpLeverage);
         color  css = GradientColor(vFirst, vMin, vMax, isPeak ? InpPeakColor : InpShortColor);
         CreateLine(time[i], pos, css, width);
        }
//--- Force the chart to refresh immediately
   ChartRedraw(0);
  }
Explanation:
Once these statistics have been calculated, the indicator uses the GradientColor() function to convert the relative strength of the current signal into a display color. The function receives the current volume value together with the minimum and maximum values found in the rolling buffer, then calculates the signal's position within that range. A signal close to the minimum receives a color that is blended heavily toward white, making it appear less prominent, while a signal closer to the maximum receives a color much closer to the selected target color. As a result, weaker liquidation levels appear lighter, whereas stronger volume events stand out with more saturated colors, making the relative importance of each estimated liquidation zone immediately visible on the chart.
The actual liquidation level calculation is performed inside the DrawLevel() function, which checks whether liquidation levels are enabled, determines if the candle is bullish or bearish, and confirms the corresponding side should be displayed. It retrieves statistics from the rolling volume buffer to rank the signal's strength, assigning line width and color intensity accordingly through GradientColor(), then calculates the estimated liquidation price using the leverage value, placing it below bullish candles and above bearish candles before drawing it on the chart.
Next, we will use the DrawLevel() function to create liquidation levels only for candles that satisfy the high-volume trigger:
if(fT)
  {
   bool   havePrev = (i > 0);
   long   prevRaw  = havePrev ? ((InpUseRealVolume && volume[i-1] > 0) ? volume[i-1] : tick_volume[i-1]) : rawVol;
   double prevVol  = (double)prevRaw;

   PushVolume(time[i], vol, havePrev, prevVol);
   DrawLevel(i, open, high, low, close, time);
  }
Maintaining Active Liquidation Levels
In this step, we implement the logic for updating active liquidation levels so they continue extending until price sweeps through them.
Example:
//+------------------------------------------------------------------+
//| Extend active liquidation levels until they are swept by price.  |
//+------------------------------------------------------------------+
void UpdateLines(const int i,const datetime &time[],const double &high[],const double &low[],
                 const int rates_total)
  {
   int n = ArraySize(g_lineNames);
   for(int k = 0; k < n; k++)
     {
      string name = g_lineNames[k];
      datetime x2 = (datetime)ObjectGetInteger(0, name, OBJPROP_TIME, 1);
      double   y  = ObjectGetDouble(0, name, OBJPROP_PRICE, 0);

      if(x2 != time[i])
         continue; // not this line's turn (already frozen, or not yet reached)

      bool swept = (high[i] > y && low[i] < y);
      if(swept)
         continue;

      datetime nextTime = (i + 1 < rates_total) ? time[i+1] : time[i] + PeriodSeconds();
      ObjectSetInteger(0, name, OBJPROP_TIME, 1, nextTime);
     }
     //--- Force the chart to refresh immediately
   ChartRedraw(0);
  }
//--- main bar-by-bar pass (mirrors: sV() -> switch draw -> uL(), called every bar)
for(int i = limit; i < rates_total; i++)
  {
   long rawVol = (InpUseRealVolume && volume[i] > 0) ? volume[i] : tick_volume[i];
   double vol  = (double)rawVol;

//--- SMA(volume, InpSmaPeriod) trailing window ending at i
   double smaSum = 0.0;
   for(int k = i - InpSmaPeriod + 1; k <= i; k++)
     {
      long v = (InpUseRealVolume && volume[k] > 0) ? volume[k] : tick_volume[k];
      smaSum += (double)v;
     }
   double sma = smaSum / InpSmaPeriod;

   bool fT = vol > sma; // "above-average volume" trigger

   if(fT)
     {
      bool   havePrev = (i > 0);
      long   prevRaw  = havePrev ? ((InpUseRealVolume && volume[i-1] > 0) ? volume[i-1] : tick_volume[i-1]) : rawVol;
      double prevVol  = (double)prevRaw;

      PushVolume(time[i], vol, havePrev, prevVol);
      DrawLevel(i, open, high, low, close, time);
     }
   UpdateLines(i, time, high, low, rates_total); // runs every bar, trigger or not
  }
Output:
Explanation:
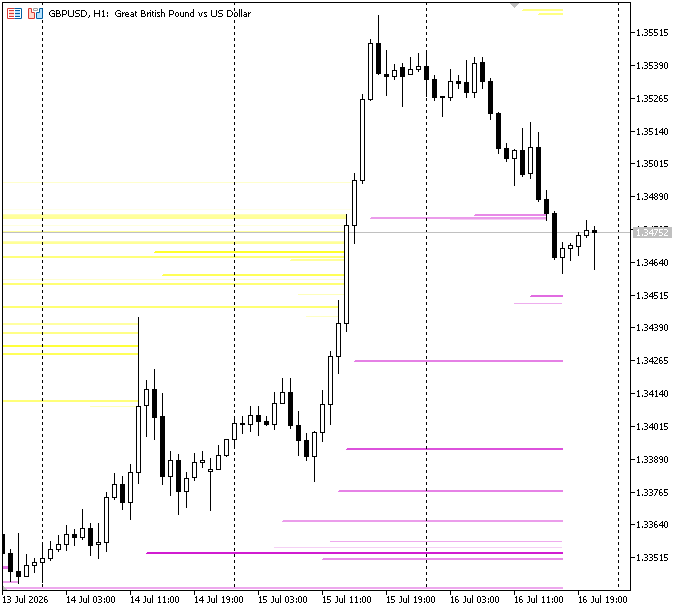
After a liquidation level is created, the UpdateLines() function manages its lifecycle by monitoring whether the level remains active or has already been reached by price. The function loops through all stored liquidation lines, retrieves their current price level and endpoint, and checks whether the line belongs to the candle currently being processed. Lines that are already frozen or not ready for updating are ignored.
For active lines, the indicator checks whether the current candle has swept through the liquidation level by comparing the candle's high and low prices with the line's price. If the price crosses the level, the line stops extending because the estimated liquidation zone has been reached. If the level remains untouched, the function extends the line to the next candle. UpdateLines() runs on every candle inside OnCalculate(), regardless of trigger status, so existing zones keep updating until they are swept or reach the latest market data.
Visualizing Signal Strength with Bubble Markers
This is the last step of the implementation plan, where we add bubble markers to visually represent the strength of each estimated liquidation zone based on the relative volume signal.
Example:
//--- rolling bubble registry (kept only for capped cleanup)
string   g_bubbleNames[];
datetime g_bubbleTimes[];

//+------------------------------------------------------------------+
//| Create a single bubble marker (Wingdings filled circle).         |
//+------------------------------------------------------------------+
void CreateBubble(const datetime barTime,const string suffix,const double price,
                  const color css,const int size)
  {
   string name = LQH_PREFIX + "BB" + suffix + "_" + (string)(long)barTime;
   if(ObjectFind(0, name) >= 0)
     {
      ObjectSetDouble(0, name, OBJPROP_PRICE, price);
      ObjectSetInteger(0, name, OBJPROP_COLOR, css);
      return;
     }

   int total = ArraySize(g_bubbleNames);
   if(total >= InpMaxBubbles)
     {
      ObjectDelete(0, g_bubbleNames[0]);
      ArrayRemove(g_bubbleNames, 0, 1);
      ArrayRemove(g_bubbleTimes, 0, 1);
      total--;
     }

   ObjectCreate(0, name, OBJ_ARROW, 0, barTime, price);
   ObjectSetInteger(0, name, OBJPROP_ARROWCODE,  108); // Wingdings filled circle
   ObjectSetInteger(0, name, OBJPROP_COLOR,      css);
   ObjectSetInteger(0, name, OBJPROP_WIDTH,      size);
   ObjectSetInteger(0, name, OBJPROP_ANCHOR,     ANCHOR_CENTER);
   ObjectSetInteger(0, name, OBJPROP_BACK,       true);
   ObjectSetInteger(0, name, OBJPROP_SELECTABLE, false);
   ObjectSetInteger(0, name, OBJPROP_HIDDEN,     true);

   ArrayResize(g_bubbleNames, total + 1);
   ArrayResize(g_bubbleTimes, total + 1);
   g_bubbleNames[total] = name;
   g_bubbleTimes[total] = barTime;
  }

//+------------------------------------------------------------------+
//| Blend a color toward white by pct (0..1). Stands in for Pine's  |
//| color.new(css, transparency) used on the bubble plots.          |
//+------------------------------------------------------------------+
color BlendWhite(const color base,const double pct)
  {
   uchar r = (uchar)(base & 0xFF);
   uchar g = (uchar)((base >> 8) & 0xFF);
   uchar b = (uchar)((base >> 16) & 0xFF);

   uchar nr = (uchar)(r + (255 - r) * pct);
   uchar ng = (uchar)(g + (255 - g) * pct);
   uchar nb = (uchar)(b + (255 - b) * pct);

   return((color)(nr | (ng << 8) | (nb << 16)));
  }

//+------------------------------------------------------------------+
//| Draw the three-tier "bubble" markers for this bar (mirrors the  |
//| six plot() calls).                                                |
//+------------------------------------------------------------------+
void DrawBubbles(const int i,const double &open[],const double &high[],const double &low[],
                 const double &close[],const datetime &time[])
  {
   if(!InpShowBubbles)
      return;

   bool bullish = close[i] > open[i];
   bool bearish = close[i] < open[i];
   bool dLong   = (InpSide == SIDE_BOTH || InpSide == SIDE_LONG);
   bool dShort  = (InpSide == SIDE_BOTH || InpSide == SIDE_SHORT);

   double vFirst   = VolFirst();
   double vMax     = VolMax();
   double vAvg     = VolAvg();
   bool   isPeak   = (vFirst == vMax);
   bool   aboveAvg = (vFirst > vAvg);

   if(bullish && dLong)
     {
      double pos  = low[i] * (1.0 - 1.0 / InpLeverage);
      color  base = isPeak ? InpPeakColor : InpLongColor;

      CreateBubble(time[i], "1L", pos, BlendWhite(base, 0.20), 1);
      if(aboveAvg)
         CreateBubble(time[i], "2L", pos, BlendWhite(isPeak ? InpPeakColor : base, 0.40), 2);
      if(isPeak)
         CreateBubble(time[i], "3L", pos, BlendWhite(InpPeakColor, 0.60), 3);
     }
   else
      if(bearish && dShort)
        {
         double pos  = high[i] * (1.0 + 1.0 / InpLeverage);
         color  base = isPeak ? InpPeakColor : InpShortColor;

         CreateBubble(time[i], "1S", pos, BlendWhite(base, 0.20), 1);
         if(aboveAvg)
            CreateBubble(time[i], "2S", pos, BlendWhite(isPeak ? InpPeakColor : base, 0.40), 2);
         if(isPeak)
            CreateBubble(time[i], "3S", pos, BlendWhite(InpPeakColor, 0.60), 3);
        }
//--- Force the chart to refresh immediately
   ChartRedraw(0);
  }

//+------------------------------------------------------------------+
//| Custom indicator initialization function                         |
//+------------------------------------------------------------------+
int OnInit()
  {
//--- indicator buffers mapping
   ArrayResize(g_volBuf,      0);
   ArrayResize(g_volBufTime,  0);
   ArrayResize(g_lineNames,   0);
   ArrayResize(g_lineTimes,   0);
   ArrayResize(g_bubbleNames, 0);
   ArrayResize(g_bubbleTimes, 0);

//---
   return(INIT_SUCCEEDED);
  }
if(fT)
  {
   bool   havePrev = (i > 0);
   long   prevRaw  = havePrev ? ((InpUseRealVolume && volume[i-1] > 0) ? volume[i-1] : tick_volume[i-1]) : rawVol;
   double prevVol  = (double)prevRaw;

   PushVolume(time[i], vol, havePrev, prevVol);
   DrawLevel(i, open, high, low, close, time);
   DrawBubbles(i, open, high, low, close, time);
  }
Output:
Explanation:
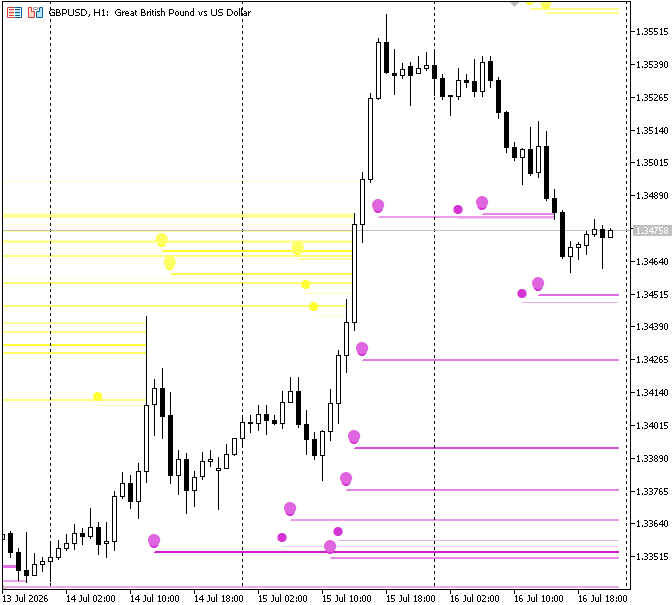
The bubble visualization system is controlled by three functions: CreateBubble(), BlendWhite(), and DrawBubbles(). Together, they create and manage the circular markers that represent the strength of estimated liquidation zones on the chart.
CreateBubble() generates a unique object name from the indicator prefix, bubble type, and candle timestamp, so repeated calculation updates on the same candle modify the existing bubble's position and color instead of creating duplicates. It also enforces a storage limit through InpMaxBubbles, removing the oldest bubble before adding a new one once that limit is reached, and builds each marker using an arrow object with a Wingdings filled circle symbol. BlendWhite() brightens a bubble's color toward white by a set percentage, creating lighter shades for weaker signals while keeping stronger signals visually prominent.
Finally, the DrawBubbles() checks whether bubble display is enabled, determines whether the candle is bullish or bearish, and compares the latest qualified signal against the rolling buffer's statistics to decide whether it's a peak or above-average event. For bullish candles, it calculates the long liquidation position below the low. For bearish candles, the short position is above the high, and then it draws up to three bubble layers: one for all qualified signals, one for above-average signals, and one for peak signals only. This ensures bubble markers appear only for notable volume events rather than every candle on the chart and visually communicates each zone's relative strength through size and color.
Conclusion
The Liquidity Heatmap presented in this article provides a reproducible MQL5 implementation that:
- detects high-volume candles using a volume SMA filter;
- estimates liquidation prices below bullish candles or above bearish candles using a user-defined leverage value;
- ranks signals through a rolling buffer using minimum, average, and maximum signal values, then maps relative strength to color and line width;
- visually represents zones using up to three tiers of bubble markers;
- extends each liquidation level forward until price sweeps it, after which the level remains fixed on the chart;
- manages chart clutter through configurable object limits and timestamp-based naming to prevent duplicates.
Important caveats: the displayed levels are probabilistic estimates derived from price and volume data only, not actual liquidation or open interest data. Therefore, they should be treated as one additional analytical layer to combine with market structure analysis, backtesting, and risk management. In practice, the indicator provides a lightweight and configurable approach for highlighting potential liquidity concentration areas and possible liquidity sweep zones that can support manual analysis or automated trading systems.
Warning: All rights to these materials are reserved by MetaQuotes Ltd. Copying or reprinting of these materials in whole or in part is prohibited.
This article was written by a user of the site and reflects their personal views. MetaQuotes Ltd is not responsible for the accuracy of the information presented, nor for any consequences resulting from the use of the solutions, strategies or recommendations described.

 Exporting Custom Indicator Buffers to CSV for Python Backtesting Pipelines
 Implementing and Benchmarking Bag-of-SFA-Symbols (BOSS) Against Dynamic Time Warping (DTW)
 Neural Networks in Trading: A Cross-Domain Time Series Forecasting Framework (TimeFound)
 Crystal Structure Algorithm (CryStAl)

- Free trading apps
- Over 8,000 signals for copying
- Economic news for exploring financial markets
You agree to website policy and terms of use
Automatic translation was applied by a moderator. Please post in the language of the forum section you selected.
Excellent idea. Good article.
Excellent idea. Good article.