

Building a Dynamic ATR-Based Trend Channel Indicator in MQL5
 9 223
9 223
 0
0

Introduction
Identifying market trends is a common challenge in technical analysis because many indicators use fixed levels that do not adjust effectively to changing volatility conditions. During high-volatility periods, price movements can become wider, while low-volatility periods often produce smaller price fluctuations. This is why dynamic approaches help adjust trend levels to current market behavior. In this article, we will build a dynamic ATR-based trend channel indicator in MQL5 using a two-stage ATR smoothing process.
The goal is to create an adaptive trend indicator that uses volatility measurements to calculate channel boundaries, detect potential trend reversals, and visualize the current market direction. We will achieve this by calculating True Range, applying ATR smoothing, creating dynamic upper and lower channels, and monitoring price crossings. The indicator will also include a trailing trend line, trend-colored candles, and arrow signals to highlight potential bullish and bearish trend changes.
Project Overview and Implementation Plan
Before implementing the indicator, we should first examine its overall design and implementation workflow. Understanding how the different components interact provides a clear roadmap for development and makes the calculation process easier to follow. In this section, we will review the architecture of the dynamic ATR-based trend channel indicator and the sequence of steps used to implement its calculations, trend detection, and graphical output.
What We Are Building
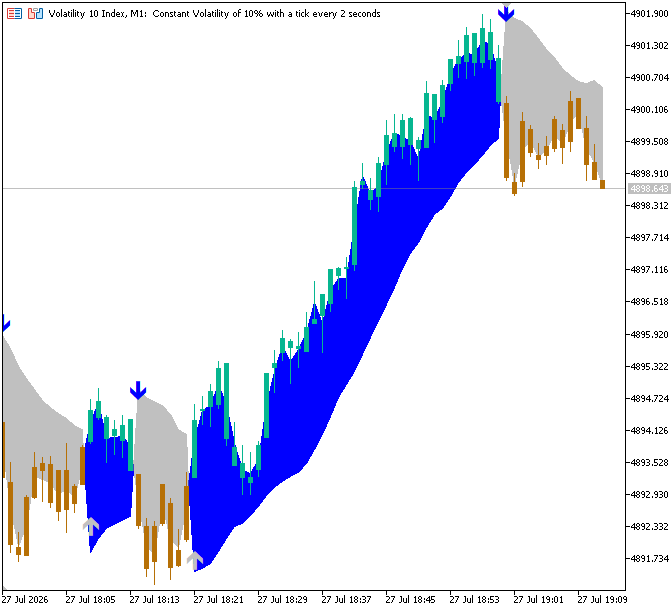
In this project, we will develop a custom trend-following indicator that dynamically adjusts its channel boundaries according to market volatility. Rather than relying on fixed price levels, the indicator uses a smoothed Average True Range (ATR) calculation to create adaptive upper and lower channels that expand and contract as market conditions change. By monitoring price movements relative to these channels, the indicator identifies potential trend reversals and determines the prevailing market direction.
To improve chart interpretation, the indicator also displays an adaptive trailing trend line, colors price candles according to the detected trend, and plots arrow signals whenever a bullish or bearish trend transition occurs. Together, these components provide a clear visual representation of the current trend and its potential changes, making the indicator suitable for trend analysis and further strategy development.
Implementation Plan
Before we begin the implementation, let's explore the sequence of steps involved in building the dynamic ATR-based trend channel indicator in MQL5.
1. Setting up the Indicator Properties and Buffers
First, we configure the basic structure of the dynamic ATR-based trend channel indicator.
This includes:
- indicator properties that specify how the indicator is displayed in the MetaTrader 5 chart window;
- plot configurations for the trend channel fill, colored candles, and bullish and bearish arrow signals;
- indicator buffers used to store intermediate calculations and plotting data;
- buffer mappings that associate each indicator buffer with its corresponding plot or calculation;
- empty-value settings to prevent invalid values from being drawn on the chart;
- the arrow configurations that define the symbols used to display bullish and bearish trend reversal signals.
2. Calculating True Range Values
We must first determine each candle's True Range (TR) before determining the Average True Range (ATR). By considering both the candle's trading range and any further movement between the current candle and the prior closing price, True Range calculates the actual price movement. This allows the calculation to capture price gaps and sudden market movements that are not visible when only using the candle's high and low range.
The True Range value is calculated by comparing three possible price movements:
TR = max(High − Low, |High − PreviousClose|, |Low − PreviousClose|)
The True Range calculation compares three different price movements to determine the largest amount of volatility for each candle. The high–low difference represents the candle's normal range. The distances from the current high/low to the previous close capture gaps and sudden price moves. The largest value among these three measurements is selected as the True Range value, while the absolute value ensures that the calculated distance remains positive regardless of whether the movement is upward or downward.
3. Calculating the Smoothed ATR Value
After calculating the True Range values, the indicator applies a two-stage smoothing process to transform the raw volatility measurements into a stable ATR value used for building the dynamic trend channel. The first stage uses Wilder's RMA (Wilder's Moving Average) smoothing, while the second stage applies a Simple Moving Average (SMA) to further smooth the ATR output.
During this step, it:
- calculates the initial ATR value by taking the average of the first 200 True Range values using the formula:

- applies Wilder's RMA smoothing to update the ATR value for each new candle using the formula:

- applies a second smoothing stage by calculating a Simple Moving Average of the RMA values using the formula:

- multiplies the SMA value by 0.8, which will later be used to determine the width of the dynamic trend channel using the formula:

4. Calculating the Upper and Lower Channel Boundaries
In this step, we will calculate the dynamic upper and lower channel boundaries for every candle using the average high price, average low price, and the final ATR value calculated in the previous step. Before calculating these boundaries, we will first check whether enough historical candles are available based on the selected channel length and whether a valid ATR value has been generated. This ensures that the channel calculations are only performed when the required data is available.
The channel boundaries will be calculated using the following formulas:
Upper Channel Boundary=Average High Price+Final ATR Value
Lower Channel Boundary=Average Low Price−Final ATR Value
We will calculate the average high and average low prices over the selected lookback period, then combine these values with the final ATR value to create volatility-adjusted channel levels. By adding the ATR value to the average high price, we will obtain the upper channel boundary, while subtracting the ATR value from the average low price will provide the lower channel boundary. These calculations will allow the channel width to expand during periods of higher volatility and contract when market volatility decreases.
Store the channel boundaries for use in trend detection. We will also calculate the midpoint of each candle by averaging its high and low prices. Store the midpoint (HL2) separately. Use it as one edge of the fill; use the trailing trend line as the other. The combination of these two values will allow us to visually represent the relationship between the current price range and the dynamic trend line on the chart.
5. Displaying Trend Candles and Generating Trend Signals
In this step, we will prepare the visual components of the indicator by displaying candles according to the detected trend direction and generating arrow signals when a potential trend transition occurs. We will first store the original candle open, high, low, and close values required for the custom candle plot, then assign different colors depending on whether the current trend is bullish or bearish. After that, we will identify the exact candles where the trend state changes and place arrow markers above or below those candles using the final ATR value to determine the signal distance.
Implementation in MQL5
In this section, we will implement the dynamic ATR-based trend channel indicator in MQL5 by following the implementation plan and developing each component step by step.
Setting up the Indicator Properties and Buffers
First, set up the indicator properties.
Example:
#property indicator_chart_window
#property indicator_buffers 15
#property indicator_plots   4

//--- Plot 0: trailing-stop line filled to hl2
#property indicator_label1  "TrendValue;HL2"
#property indicator_type1   DRAW_FILLING
#property indicator_color1  clrSilver,clrBlue

//--- Plot 1: colored candles (up/down trend color)
#property indicator_label2  "Open;High;Low;Close"
#property indicator_type2   DRAW_COLOR_CANDLES
#property indicator_color2  C'6,182,144', C'182,112,6'
#property indicator_width2  1

//--- Plot 2: bullish flip signal (triangle up)
#property indicator_label3  "Signal Up"
#property indicator_type3   DRAW_ARROW
#property indicator_color3  clrSilver
#property indicator_width3  2

//--- Plot 3: bearish flip signal (triangle down)
#property indicator_label4  "Signal Down"
#property indicator_type4   DRAW_ARROW
#property indicator_color4  clrBlue
#property indicator_width4  2
Explanation:
The indicator uses four different plots to display its visual components on the chart. Each plot is assigned a specific drawing style and is responsible for displaying a different part of the indicator. The first plot creates the filled area between the trailing trend line and the midpoint of each candle. This plot creates a filled region between the trailing trend line and the candle midpoint instead of displaying only a single line. By dynamically changing the fill color based on the plotted values, it provides a clearer indication of the prevailing market direction.
The second plot is responsible for displaying custom candlesticks. Unlike standard price candles, these candles are colored according to the detected market trend rather than their bullish or bearish price movement. This allows the chart to provide an immediate visual indication of whether the indicator currently considers the market to be in an upward or downward trend. The third plot displays bullish trend transition signals. This plot is responsible for displaying bullish trend reversal signals. When the indicator confirms a transition from a bearish trend to a bullish trend, an upward-pointing arrow is drawn below the corresponding candle, with its color and display width determined by the plot configuration.
The fourth plot performs the opposite task by displaying bearish trend transition signals. Whenever a bearish trend transition is confirmed, the indicator plots a downward-pointing arrow above the candle where the change occurs. Similar to the bullish signal, the arrow's visual properties are configured through the plot settings to provide a clear representation of bearish market changes.
To perform its calculations and display its graphical components, the indicator requires several buffers. These buffers act as storage locations that hold both intermediate calculation results and the values that are ultimately drawn on the chart.
Example:
//--- indicator buffers
double BufTR[];              // True Range, per bar
double BufAtrRma[];          // Pass 1: Wilder-smoothed ATR, per bar
double BufAtrVal[];          // Pass 2 + x0.8: final ATR value, per bar
double BufSmaHigh[];         // upper boundary: sma(high,length) + final ATR value
double BufSmaLow[];          // lower boundary: sma(low,length) - final ATR value
double BufTrendState[];      // -1 = undefined, 0 = down, 1 = up
double BufTrendVal[];        // trailing-stop line (whichever boundary matches the trend)
double BufHL2[];             // candle midpoint, the other edge of the fill plot
double BufOpen[];            // candle open (feeds the colored-candles plot)
double BufHigh[];            // candle high
double BufLow[];             // candle low
double BufClose[];           // candle close
double BufCandleColor[];     // 0 = up color, 1 = down color, per bar
double BufSigUp[];           // price coordinate for the up-flip arrow (EMPTY_VALUE otherwise)
double BufSigDn[];           // price coordinate for the down-flip arrow (EMPTY_VALUE otherwise)
//+------------------------------------------------------------------+
//| Custom indicator initialization function                         |
//+------------------------------------------------------------------+
int OnInit()
  {
//--- indicator buffers mapping
//--- map each buffer index to its array
   SetIndexBuffer(0,  BufTrendVal,    INDICATOR_DATA);
   SetIndexBuffer(1,  BufHL2,         INDICATOR_DATA);
   SetIndexBuffer(2,  BufOpen,        INDICATOR_DATA);
   SetIndexBuffer(3,  BufHigh,        INDICATOR_DATA);
   SetIndexBuffer(4,  BufLow,         INDICATOR_DATA);
   SetIndexBuffer(5,  BufClose,       INDICATOR_DATA);
   SetIndexBuffer(6,  BufCandleColor, INDICATOR_COLOR_INDEX);
   SetIndexBuffer(7,  BufSigUp,       INDICATOR_DATA);
   SetIndexBuffer(8,  BufSigDn,       INDICATOR_DATA);
   SetIndexBuffer(9,  BufTR,          INDICATOR_CALCULATIONS);
   SetIndexBuffer(10, BufAtrRma,      INDICATOR_CALCULATIONS);
   SetIndexBuffer(11, BufAtrVal,      INDICATOR_CALCULATIONS);
   SetIndexBuffer(12, BufSmaHigh,     INDICATOR_CALCULATIONS);
   SetIndexBuffer(13, BufSmaLow,      INDICATOR_CALCULATIONS);
   SetIndexBuffer(14, BufTrendState,  INDICATOR_CALCULATIONS);

//--- tell MT5 which value means "draw nothing here" for each plot
   PlotIndexSetDouble(0, PLOT_EMPTY_VALUE, EMPTY_VALUE);  // trailing-stop / hl2 fill
   PlotIndexSetDouble(2, PLOT_EMPTY_VALUE, EMPTY_VALUE);  // up arrow
   PlotIndexSetDouble(3, PLOT_EMPTY_VALUE, EMPTY_VALUE);  // down arrow

//--- set the arrow shapes (wingding codes) for the two signal plots
   PlotIndexSetInteger(2, PLOT_ARROW, 233); // solid triangle up
   PlotIndexSetInteger(3, PLOT_ARROW, 234); // solid triangle down

//---
   return(INIT_SUCCEEDED);
  }
Explanation:
The first group of buffers stores the values required to calculate the dynamic trend channel. These include the True Range values, the first-stage ATR values produced by Wilder's smoothing method, the final smoothed ATR values, and the upper and lower channel boundaries calculated from the moving averages of the high and low prices. Another buffer is used to store the detected trend state for every candle. This allows the indicator to keep track of whether the market is currently in an upward trend, a downward trend, or whether no trend has yet been established. A separate buffer stores the trailing trend line, which alternates between the upper and lower channel boundaries depending on the current market direction.
To create the filled region on the chart, the indicator also stores the midpoint of every candle. This midpoint forms one side of the filled area, while the trailing trend line forms the other, producing a clear visual representation of the relationship between price and the active trend level. Additional buffers store the open, high, low, and close prices required to draw the custom candlesticks.
A dedicated color buffer determines which color is assigned to each candle according to the detected trend direction, allowing the chart to distinguish bullish and bearish market conditions visually. Finally, two signal buffers store the positions of the bullish and bearish arrow signals. Rather than drawing arrows on every candle, these buffers only contain values when a valid trend transition occurs. Otherwise, they remain empty, ensuring that only meaningful trend change signals are displayed on the chart.
Calculating True Range Values
Next, calculate each candle's True Range value to measure price movement and prepare the data used in the ATR calculation.
Example:
#define ATR_PERIOD      200  // lookback for the first (Wilder) smoothing pass
#define ATR_SMA_PERIOD  200  // lookback for the second (plain average) smoothing pass

input int InpLength = 10;    // number of candles used to average highs/lows for the channel
//+------------------------------------------------------------------+
//| Custom indicator iteration function                              |
//+------------------------------------------------------------------+
int OnCalculate(const int32_t rates_total,
                const int32_t prev_calculated,
                const datetime &time[],
                const double &open[],
                const double &high[],
                const double &low[],
                const double &close[],
                const long &tick_volume[],
                const long &volume[],
                const int32_t &spread[])
  {
//--- refuse to run until enough history exists for both ATR smoothing passes
   int minBars = ATR_PERIOD + ATR_SMA_PERIOD + InpLength + 2;
   if(rates_total < minBars)
      return(0);

//--- work out which bar to resume calculating from
   int start = (prev_calculated>1) ? prev_calculated-1 : 1; // back up 1 bar in case it wasn't closed yet
   if(start<1)
      start=1; // never touch bar 0, every calculation below needs a bar i-1 to compare against

   for(int i=start;i<rates_total;i++)
     {
      //--- True Range: largest of high-low, |high-prevClose|, |low-prevClose|
      double tr;
      if(i==0)
         tr = high[i]-low[i]; // no previous close available on the very first bar
      else
        {
         double hl = high[i]-low[i];
         double hc = MathAbs(high[i]-close[i-1]);
         double lc = MathAbs(low[i]-close[i-1]);
         tr = MathMax(hl, MathMax(hc,lc));
        }
      BufTR[i]=tr;
     }


//--- return value of prev_calculated for next call
   return(rates_total);
  }
//+------------------------------------------------------------------+
Explanation:
We first define the input parameters that control the volatility measurement and channel construction process. The ATR smoothing periods determine the lookback length used for both the initial Wilder's RMA smoothing and the additional SMA smoothing stage, while the channel length specifies the number of candles used to calculate the average high and low prices for the dynamic boundaries. In this implementation, both ATR smoothing periods are set to 200, allowing the indicator to generate a more stable ATR value before using it to adjust the channel levels.
Before performing any calculations, we need to ensure that enough historical candles are available for all required calculations. Since the indicator uses two ATR smoothing stages and a separate channel calculation period, it requires a minimum number of candles before valid values can be generated. To determine this requirement, we combine the periods needed for both ATR smoothing stages with the channel length and an additional number of candles required for comparison operations. If the available historical data is not sufficient, the calculation process is stopped until more candles become available.
After verifying that enough candles are available, we establish the calculation range. The indicator performs a full calculation during initialization, then continues from the last processed candle during later updates to reduce unnecessary processing. A one-candle backward adjustment is applied so that calculations involving previous candle values can be performed correctly. The first candle is skipped because several parts of the calculation, such as trend detection, require access to the previous candle's values. After preparing the calculation range, we will calculate the True Range value for every candle to measure the actual price movement. To obtain the True Range, we will compare the current candle's high and low range with the price movement between the current candle and the previous closing price.
By checking these different price distances and selecting the largest value, we will capture the most significant movement that occurred during that candle, including any additional movement caused by gaps or sudden price changes. For the first candle, where a previous closing price is not available, we will use only the difference between the candle's high and low prices. The calculated True Range values will then be stored in the True Range buffer, where they will be accessed in the next stage to calculate the smoothed ATR values used for building the dynamic trend channel.
Calculating the Smoothed ATR Value
Next, calculate the smoothed ATR value from True Range data.
Example:
for(int i=start;i<rates_total;i++)
  {
//--- True Range: largest of high-low, |high-prevClose|, |low-prevClose|
   double tr;
   if(i==0)
      tr = high[i]-low[i]; // no previous close available on the very first bar
   else
     {
      double hl = high[i]-low[i];
      double hc = MathAbs(high[i]-close[i-1]);
      double lc = MathAbs(low[i]-close[i-1]);
      tr = MathMax(hl, MathMax(hc,lc));
     }
   BufTR[i]=tr;

//--- ATR(200) via Wilder RMA (Pass 1)
   if(i < ATR_PERIOD-1)
      BufAtrRma[i]=0; // not enough bars yet, placeholder
   else
      if(i == ATR_PERIOD-1)
        {
         //--- first valid value: plain average of the first 200 True Range values
         double sum=0;
         for(int k=i-ATR_PERIOD+1;k<=i;k++)
            sum+=BufTR[k];
         BufAtrRma[i]=sum/ATR_PERIOD;
        }
      else
         // every bar after that: yesterday's smoothed value, nudged by today's True Range
         BufAtrRma[i] = (BufAtrRma[i-1]*(ATR_PERIOD-1) + BufTR[i]) / ATR_PERIOD;

//--- Pass 2: Calculate the simple average of the output from Pass 1
   if(i < ATR_PERIOD-1 + ATR_SMA_PERIOD-1)
      BufAtrVal[i]=0; // not enough bars yet, placeholder
   else
     {
      double sum=0;
      for(int k=i-ATR_SMA_PERIOD+1;k<=i;k++)
         sum+=BufAtrRma[k];
      BufAtrVal[i] = (sum/ATR_SMA_PERIOD)*0.8; // final ATR value for this bar
     }
   double atrVal = BufAtrVal[i]; // shorthand for the rest of this bar's calculations
  }
Explanation:
After calculating the True Range values, we will apply the first smoothing stage using Wilder's RMA method to reduce short-term fluctuations and create a more stable volatility measurement. Before calculating a valid ATR value, we will first check whether enough True Range values are available. During the initial calculation, we will take the average of the first 200 True Range values to initialize the ATR calculation. After this first value is established, each new candle will update the ATR by combining the previous smoothed ATR value with the current candle's True Range value. The resulting values will be stored in the ATR RMA buffer and used as the input for the second smoothing stage.
In the second stage, we will apply an additional Simple Moving Average smoothing process to the previously calculated RMA values. Similar to the first stage, we will wait until enough smoothed ATR values are available before generating a valid result. For each candle, we will calculate the average of the latest 200 RMA values and then multiply the result by 0.8 to obtain the final ATR value. This final ATR value will be stored in the ATR value buffer and later used to adjust the distance of the upper and lower channel boundaries according to current market volatility. The calculated value will also be stored temporarily for use during the remaining calculations for the current candle.
Calculating the Upper and Lower Channel Boundaries
Next, calculate the upper and lower channel boundaries using the average high and low prices adjusted by the final ATR value.
Example:
//--- persistent state
bool   g_trend      = false; // current trend: true = up, false = down
bool   g_trendInit  = false; // whether a trend has ever actually been established yet
int    g_countUp    = 0;     // consecutive bars the current uptrend has run
int    g_countDown  = 0;     // consecutive bars the current downtrend has run
//--- fresh full recalculation: reset the persistent trend state
if(prev_calculated==0)
  {
   g_trend=false;
   g_trendInit=false;
   g_countUp=0;
   g_countDown=0;
  }

for(int i=start;i<rates_total;i++)
  {
//--- True Range: largest of high-low, |high-prevClose|, |low-prevClose|
   double tr;
   if(i==0)
      tr = high[i]-low[i]; // no previous close available on the very first bar
   else
     {
      double hl = high[i]-low[i];
      double hc = MathAbs(high[i]-close[i-1]);
      double lc = MathAbs(low[i]-close[i-1]);
      tr = MathMax(hl, MathMax(hc,lc));
     }
   BufTR[i]=tr;

//--- ATR(200) via Wilder RMA (Pass 1)
   if(i < ATR_PERIOD-1)
      BufAtrRma[i]=0; // not enough bars yet, placeholder
   else
      if(i == ATR_PERIOD-1)
        {
         //--- first valid value: plain average of the first 200 True Range values
         double sum=0;
         for(int k=i-ATR_PERIOD+1;k<=i;k++)
            sum+=BufTR[k];
         BufAtrRma[i]=sum/ATR_PERIOD;
        }
      else
         // every bar after that: yesterday's smoothed value, nudged by today's True Range
         BufAtrRma[i] = (BufAtrRma[i-1]*(ATR_PERIOD-1) + BufTR[i]) / ATR_PERIOD;

//--- Pass 2: Calculate the simple average of the output from Pass 1
   if(i < ATR_PERIOD-1 + ATR_SMA_PERIOD-1)
      BufAtrVal[i]=0; // not enough bars yet, placeholder
   else
     {
      double sum=0;
      for(int k=i-ATR_SMA_PERIOD+1;k<=i;k++)
         sum+=BufAtrRma[k];
      BufAtrVal[i] = (sum/ATR_SMA_PERIOD)*0.8; // final ATR value for this bar
     }
   double atrVal = BufAtrVal[i]; // shorthand for the rest of this bar's calculations

//--- upper/lower boundary: SMA(high,length)+atr and SMA(low,length)-atr
   if(i>=InpLength-1 && atrVal>0)
     {
      double sh=0, sl=0;
      for(int k=i-InpLength+1;k<=i;k++)
        {
         sh+=high[k];
         sl+=low[k];
        }
      BufSmaHigh[i] = sh/InpLength + atrVal; // upper boundary
      BufSmaLow[i]  = sl/InpLength - atrVal; // lower boundary
     }
   else
     {
      // not enough bars, or ATR not ready yet: placeholders
      BufSmaHigh[i]=0;
      BufSmaLow[i]=0;
     }

//--- trend detection: only flips on a confirmed close crossing a boundary
   if(i>0 && BufSmaHigh[i]>0 && BufSmaHigh[i-1]>0)
     {
      bool crossOver  = (close[i-1] <= BufSmaHigh[i-1] && close[i] > BufSmaHigh[i]); // close broke above upper boundary
      bool crossUnder = (close[i-1] >= BufSmaLow[i-1]  && close[i] < BufSmaLow[i]);  // close broke below lower boundary

      if(crossOver)
        {
         g_trend=true;
         g_trendInit=true;
        }
      if(crossUnder)
        {
         g_trend=false;
         g_trendInit=true;
        }
     }

// record this bar's trend state: -1 undefined, 1 up, 0 down
   BufTrendState[i] = g_trendInit ? (g_trend?1.0:0.0) : -1.0;

//--- consecutive-bar counters
   if(BufTrendState[i]==1.0)
     {
      g_countUp++;
      g_countDown=0;
     }
   else
      if(BufTrendState[i]==0.0)
        {
         g_countDown++;
         g_countUp=0;
        }

//--- trailing stop line + hl2 (together they form the fill plot)
   if(g_trendInit)
      BufTrendVal[i] = g_trend ? BufSmaLow[i] : BufSmaHigh[i]; // low boundary in uptrend, high boundary in downtrend
   else
      BufTrendVal[i] = EMPTY_VALUE; // no trend yet: leave a gap on the chart

   BufHL2[i] = (high[i]+low[i])/2.0; // candle midpoint, the other edge of the fill
  }
Output:
Explanation:
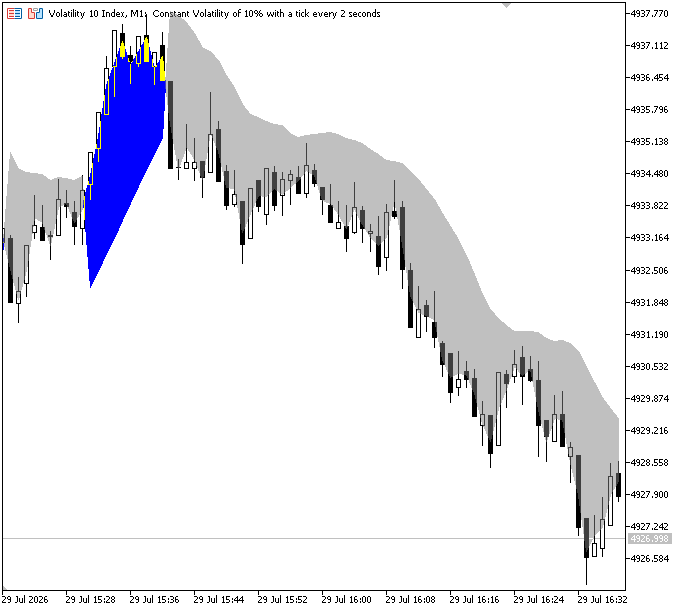
We first declare global variables to preserve the indicator's trend state, initialization status, and consecutive trend counts between calculations. When the indicator performs a full recalculation, we reset the persistent trend variables to their initial values. This ensures that the calculation starts from a clean state without carrying over previous trend information, leaving the trend undefined until a valid transition is detected.
After the required data is available, we calculate the dynamic upper and lower channel boundaries for each candle. We first calculate the average high and average low prices over the selected channel length, then adjust these values using the final ATR value. The adjusted average high price forms the upper channel boundary, while the adjusted average low price forms the lower channel boundary. These values are stored in their respective buffers so they can be accessed later during the trend detection process.
Once the channel boundaries are available, we compare the current candle's closing price with the previous candle's channel values to identify possible trend changes. A bullish transition occurs when the closing price moves from below the upper channel boundary to above it, while a bearish transition occurs when the closing price moves from above the lower channel boundary to below it. When either condition is detected, we update the global trend state and mark that a valid trend has been established. After determining the trend direction, we will store the trend state in a buffer and update the trend counters to track the duration of the current market direction.
Finally, we will prepare the values required for the visual components of the indicator by storing the active trailing trend line in the BufTrendVal buffer. During an uptrend, the lower channel boundary will be stored because it acts as a dynamic support level, while during a downtrend, the upper channel boundary will be stored because it acts as a dynamic resistance level. We will also calculate the candle midpoint (HL2) and store it in the BufHL2 buffer. These two buffers will work together to create the filled area on the chart, visually showing the relationship between the price movement and the active trend line.
Displaying Trend Candles and Generating Trend Signals
Finally, display trend-colored candles and generate signals when potential trend changes occur.
Example:
//--- trailing stop line + hl2 (together they form the fill plot)
if(g_trendInit)
   BufTrendVal[i] = g_trend ? BufSmaLow[i] : BufSmaHigh[i]; // low boundary in uptrend, high boundary in downtrend
else
   BufTrendVal[i] = EMPTY_VALUE; // no trend yet: leave a gap on the chart

BufHL2[i] = (high[i]+low[i])/2.0; // candle midpoint, the other edge of the fill

//--- pass through OHLC and pick the candle color for this bar
BufOpen[i]=open[i];
BufHigh[i]=high[i];
BufLow[i]=low[i];
BufClose[i]=close[i];
BufCandleColor[i] = g_trend ? 0 : 1; // 0 = up color, 1 = down color

//--- flip signals: true only on the exact bar the trend just changed
bool signalUp=false, signalDown=false;
if(i>0 && BufTrendState[i]!=-1.0 && BufTrendState[i-1]!=-1.0 && BufTrendState[i]!=BufTrendState[i-1])
  {
   if(BufTrendState[i]==1.0)
      signalUp=true;
   else
      signalDown=true;
  }

// place the arrow 2x ATR away from the candle's own high/low, only on the flip bar
BufSigUp[i] = signalUp   ? low[i]  - atrVal*2 : EMPTY_VALUE;
BufSigDn[i] = signalDown ? high[i] + atrVal*2 : EMPTY_VALUE;
Output:
Explanation:
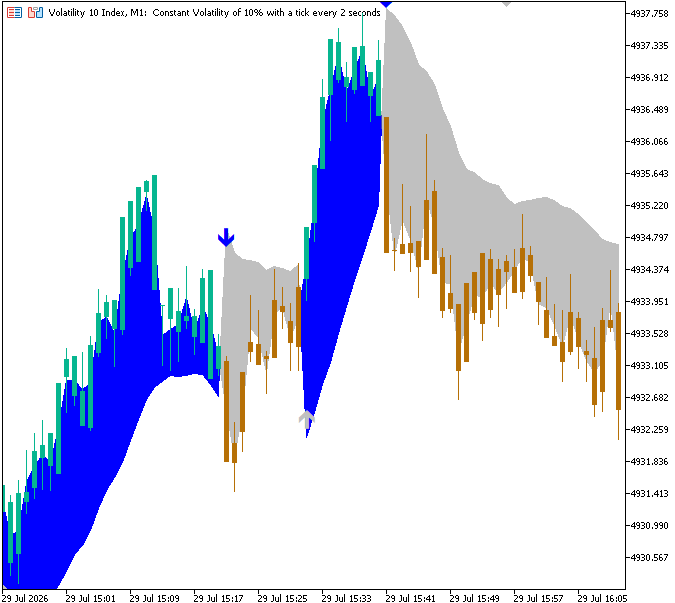
After determining the current trend direction, we will prepare the candle data required to display custom trend-colored candles on the chart. The indicator does not modify the original price values, so we will copy the open, high, low, and close prices of each candle into their corresponding buffers. These buffers provide the price information required by the DRAW_COLOR_CANDLES plot to recreate the candles on the chart. In addition to storing the candle prices, we will assign a color index to each candle using the current trend state. When the market is in an uptrend, the candle color buffer will receive the value associated with the bullish candle color, while during a downtrend, it will receive the value associated with the bearish candle color.
This allows the indicator to visually represent the detected market direction by changing candle colors according to the active trend. For signal generation, we will monitor changes between consecutive trend states. Arrows mark actual reversals because the indicator signals only when the trend state changes. Before conducting this comparison, we will make sure that both the previous and current candles have a valid trend state, which means that neither of the candles is still in the undefined state and a trend has already been established.
We will identify the direction of the trend transition by comparing the current and previous trend states. A move into an uptrend will trigger the bullish signal flag, while a move into a downtrend will trigger the bearish signal flag, ensuring signals are generated only when the trend direction changes. After identifying a valid trend transition, we will determine the position where the signal arrows should appear on the chart.
For bullish signals, the arrow position will be calculated below the candle's low price by moving it a distance of two ATR values downward. This prevents the arrow from overlapping with the candle and keeps it clearly visible during different volatility conditions. For bearish signals, the arrow position will be calculated above the candle's high price by moving it two ATR values upward. If no trend change occurs on a particular candle, the corresponding signal buffer will be assigned an empty value, preventing unnecessary arrows from being drawn. The calculated positions are stored in the bullish and bearish signal buffers, which are then used by the arrow plots to display the trend transition markers on the chart.
Conclusion
By completing this article, we have developed a dynamic ATR-based trend channel indicator in MQL5 that adapts its trend analysis according to changing market volatility. The focus was on understanding how volatility measurements can be transformed into dynamic price levels for identifying potential trend movements and presenting market conditions through clear visual elements. Throughout this implementation, we have learned how to:
- measure market volatility using True Range and multi-stage ATR smoothing techniques;
- create adaptive trend channels that expand and contract according to changing market conditions;
- identify potential trend transitions by monitoring price movement relative to dynamic channel boundaries;
- visualize trend direction using trailing trend levels, trend-colored candles, and reversal signals;
- structure indicator calculations using buffers and persistent variables for efficient state management.
This project demonstrates how adaptive trend analysis can be implemented in MQL5 using dynamic volatility measurements. The knowledge gained from this article can be used as a foundation for designing advanced indicators, enhancing trading logic, and building automated systems that adapt to evolving market conditions.
Warning: All rights to these materials are reserved by MetaQuotes Ltd. Copying or reprinting of these materials in whole or in part is prohibited.
This article was written by a user of the site and reflects their personal views. MetaQuotes Ltd is not responsible for the accuracy of the information presented, nor for any consequences resulting from the use of the solutions, strategies or recommendations described.

 Building a Crosshair Volume Profile Indicator in MQL5
 Enhancing the MQL5 Portfolio Analyzer Dashboard: Active Mitigation, Data Exports, and AI Integration
 Low-Frequency Quantitative Strategies in MetaTrader 5 (Part 5): Pre-Backtest Evaluation of Machine-Learning-Generated Signals Through Formulaic Alphas
 CSV Data Analysis (Part 8): Building an SQLite Strategy Registry from Accumulated CSV Exports

- Free trading apps
- Over 8,000 signals for copying
- Economic news for exploring financial markets
You agree to website policy and terms of use