

CSV Data Analysis (Part 6): Multi-Broker Result Normalization and Cross-Platform CSV Reconciliation
 966
966
 0
0

Introduction
The preceding articles in this series built an export and analysis pipeline based on a single, stable data contract: one EA, one broker, one schema. In practice, advanced strategy development rarely confines itself to that boundary. A strategy under evaluation may run simultaneously on a live account at one broker and a demo account at another for execution quality comparison. An optimization campaign may sweep the same parameters across two broker environments to detect broker‑dependent results. A portfolio of strategies may be distributed across multiple brokers for counterparty diversification, with each account contributing a separate CSV export to a consolidated reporting layer.
If CSV exports from different brokers are loaded into the same Python pipeline without preprocessing, the analysis can be silently corrupted. Two brokers quoting EURUSD with different decimal conventions will report profit figures that differ by a factor of ten. If a broker records commission in a separate DEAL_COMMISSION entry, the profit distribution differs from a broker that embeds commission in the spread. A broker in the UTC+2 time zone and a broker in the UTC+3 time zone will generate timestamp sequences misaligned by one hour when plotted together, causing temporal analysis to misattribute trades to the wrong session window.
None of these discrepancies produce an error message. The data loads cleanly, the charts render without complaint, and the analytical conclusions are wrong. The normalization layer described in this article is the structural defense against this class of silent data corruption.
Note: If you missed Part 5 of this series, you can read it here.
Sources of Schema Divergence: Taxonomy
Pip Convention and Decimal Precision
The most pervasive source of numeric divergence is the distinction between 4‑digit and 5‑digit quoting. On a 4‑digit broker, EURUSD is quoted to four decimal places; one pip equals 0.0001. On a 5‑digit broker, the same pair is quoted to five decimal places and one point equals 0.00001 while a pip remains 0.0001. Most modern brokers use 5‑digit quoting, but legacy configurations and certain exotic pairs still operate in 4‑digit mode.
When a strategy computes profit in points (as opposed to currency units), the raw point value differs by a factor of 10 between these two environments. An export that writes raw point profit without tagging the quoting convention will appear to report ten times the actual performance when loaded into an analysis pipeline calibrated for 5‑digit brokers.
Commission and Swap Accounting Models
Three distinct commission accounting models appear across MetaTrader 5 brokers:
- Spread‑inclusive model: The broker’s commission is embedded within the bid‑ask spread. No DEAL_COMMISSION field carries a non‑zero value. DEAL_PROFIT on a closing deal represents the complete net P&L.
- Per‑trade commission model: The broker charges a fixed dollar amount per lot per side, recorded in DEAL_COMMISSION on the opening deal. DEAL_PROFIT on the closing deal shows gross P&L before commission; the commission must be subtracted to arrive at true net profit.
- Volume‑weighted commission model: A tiered commission schedule changes the per‑lot rate based on monthly volume. Commission values vary across trades of identical size, rendering a constant‑rate assumption invalid.
Symbol Naming Conventions
Symbol naming is not standardized. A single instrument can appear under many aliases:
| Instrument | Possible Symbol Names |
|---|---|
| Euro / US Dollar | EURUSD, EURUSDm, EURUSD., EURUSD_i, FX_EURUSD |
| Gold / US Dollar | XAUUSD, GOLD, XAUUSDm, GOLDm, XAUUSD.r |
| US 30 Index | US30, DJ30, USTEC30, Dow Jones, #DJ30 |
| Crude Oil WTI | USOIL, XTIUSD, WTI, CrudeOil, OIL.WTI |
Without normalization, a strategy tested on EURUSD at Broker A and EURUSDm at Broker B produces two separate groups in any groupby('Symbol') aggregation, making cross‑broker comparison impossible. The normalizer must map all variant names to a canonical form.
Timestamp Formats and Time Offsets
MetaTrader 5 operates on the server time of the connected broker, which varies by broker and changes seasonally with daylight saving time. Common server time zones include UTC+0, UTC+2 (EET/EEST depending on DST), UTC+3 (MSK or EEST depending on broker settings), and UTC‑5 (EST). The standard MQL5 TimeToString() function produces a local server time string with no embedded time zone identifier.
When exports from a UTC+2 broker and a UTC+3 broker are compared by hour‑of‑day, every trade recorded between 00:00 and 00:59 on the UTC+2 export corresponds to a trade recorded between 01:00 and 01:59 on the UTC+3 export. Timestamp normalization must convert every timestamp to UTC before any temporal analysis occurs.
Currency Denomination Mismatches
Not all brokers denominate account equity and trade profit in USD. A broker targeting European clients may denominate accounts in EUR; a UK‑focused broker may use GBP. When exports from accounts with different denomination currencies are combined without conversion, a €100 profit and a $100 profit appear identical as raw numbers despite being different outcomes. The normalization layer converts all profit and equity figures to a common denomination — USD in this implementation.
Designing the Normalization Contract
The Canonical Schema
The normalization layer’s output is a unified DataFrame conforming to a fixed canonical schema. Every row, regardless of its source broker, carries the same columns with the same semantics:
| Column | Type | Normalized Semantics |
|---|---|---|
| Broker_ID | string | Short identifier for the source broker |
| Symbol_Canonical | string | Resolved instrument name (e.g., EURUSD, XAUUSD) |
| Timeframe | string | Chart period label (unchanged from source) |
| Test_Phase | string | Phase tag: Baseline, InSample, OutSample |
| Open_Time_UTC | datetime | Bar or trade open time, normalized to UTC |
| Close_Time_UTC | datetime | Bar or trade close time, normalized to UTC |
| Net_Profit_USD | float | Profit after commission, denominated in USD |
| Commission_USD | float | Commission cost in USD |
| Gross_Profit_USD | float | Profit before commission, in USD |
| Volume_Lots | float | Trade volume in standard lots |
| Slippage_Points | float | Execution slippage in normalized points (5‑digit) |
| Sortino_Ratio | float | Unchanged from source |
| Max_Drawdown_PCT | float | Unchanged from source |
| False_Flips_Whipsaws | int | Unchanged from source |
| Avg_Lag_On_Turn_Bars | float | Unchanged from source |
Broker Profile Definitions
Each broker is described by a profile dictionary that encodes all environmental parameters needed for normalization:
BROKER_PROFILES = {
    "BrokerA": {
        "display_name"      : "Broker A (ECN)",
        "server_utc_offset" : 2,
        "digit_convention"  : 5,
        "commission_model"  : "per_trade",
        "commission_per_lot": 3.50,
        "account_currency"  : "USD",
        "symbol_map"        : {
            "EURUSD" : "EURUSD", "GBPUSD" : "GBPUSD",
            "XAUUSD" : "XAUUSD", "US30"   : "US30",
        }
    },
    "BrokerB": {
        "display_name"      : "Broker B (Market Maker)",
        "server_utc_offset" : 3,
        "digit_convention"  : 5,
        "commission_model"  : "spread_only",
        "commission_per_lot": 0.0,
        "account_currency"  : "EUR",
        "symbol_map"        : {
            "EURUSDm" : "EURUSD", "GBPUSDm" : "GBPUSD",
            "GOLDm"   : "XAUUSD", "DJ30"    : "US30",
        }
    },
    "BrokerC": {
        "display_name"      : "Broker C (STP)",
        "server_utc_offset" : 0,
        "digit_convention"  : 4,
        "commission_model"  : "per_trade",
        "commission_per_lot": 5.00,
        "account_currency"  : "GBP",
        "symbol_map"        : {
            "EURUSD"   : "EURUSD", "GBPUSD"   : "GBPUSD",
            "XAUUSD"   : "XAUUSD", "Dow Jones": "US30",
        }
    }
}
This profile structure is the single point of truth for all broker‑specific parameters. Adding a new broker requires only a new entry in BROKER_PROFILES — no changes to the normalization logic itself are needed.
The MQL5 Broker-Aware Export Extension
Enriching the Export Row with Broker Metadata
The existing export schema from Parts 1 through 4 does not include fields that identify the broker environment. For multi‑broker normalization, several additional fields must be written into the export row by the MQL5 EA or indicator:
- Broker_Server — AccountInfoString(ACCOUNT_SERVER)
- Account_Currency — AccountInfoString(ACCOUNT_CURRENCY)
- Symbol_Digits — (int)SymbolInfoInteger(_Symbol, SYMBOL_DIGITS)
- Commission_Per_Lot — an input variable set by the user
- Slippage_Points — the measured difference between the requested price and the fill price, in points
These fields allow the Python normalizer to operate entirely from data embedded in the CSV without requiring the user to manually tag which broker produced each file.
The BrokerAwareExporter.mqh Implementation
The include file defines an extended metrics struct SBrokerAwareMetrics that carries both standard performance fields (carried over from earlier articles) and new broker environment fields.
//+------------------------------------------------------------------+
//|                                      BrokerAwareExporter.mqh     |
//|   Extends the base CSV export schema with broker metadata fields |
//+------------------------------------------------------------------+

#property strict

#ifndef BROKER_AWARE_EXPORTER_MQH
#define BROKER_AWARE_EXPORTER_MQH

//+------------------------------------------------------------------+
//| Extended metrics struct: adds broker environment fields          |
//+------------------------------------------------------------------+
struct SBrokerAwareMetrics
  {
   //--- Standard performance fields (carried from prior articles)
   string            testPhase;           // Evaluation phase label
   string            indicatorName;       // Base technical filter label
   int               filterPeriod;        // Primary indicator lookback window
   double            netProfit;           // Total financial return metrics
   double            sortinoRatio;        // Downside risk-adjusted return ratio
   double            maxDrawdownPct;      // Peak-to-trough draw percentage
   int               falseFlipsWhipsaws;  // Total count of bad pivot entry breaks
   double            avgLagBars;          // Mean signal structural latency bars
   int               totalTrades;         // Cumulative closed position counts

   //--- Broker environment fields (new in this article)
   string            brokerServer;        // AccountInfoString(ACCOUNT_SERVER)
   string            accountCurrency;     // AccountInfoString(ACCOUNT_CURRENCY)
   int               symbolDigits;        // SYMBOL_DIGITS for the tested instrument
   double            commissionPerLot;    // User-specified commission rate (input)
   double            totalCommissionPaid; // Summed DEAL_COMMISSION across all deals
   double            avgSlippagePoints;   // Mean abs(requested − filled) in points.
   double            grossProfit;         // Net profit before commission deduction
  };
Two inputs are exposed to the host program:
//--- Input parameters for broker alignment checks
input group "--- Broker Metadata ---";
input double InpCommissionPerLot = 3.50;  // Commission per lot per side (USD)
input long   InpMagicNumber      = 12345; // Magic number to filter own deals
PopulateBrokerFields() reads account and symbol properties. It then scans deal history for trades matching the EA's magic number, accumulates total commission, and approximates slippage using spread when the broker reports a floating spread. The SYMBOL_SPREAD_FLOAT constant is used to determine whether the broker’s spread is fixed or variable:
//+------------------------------------------------------------------+
//| Populates broker environment fields from live terminal context   |
//+------------------------------------------------------------------+
void PopulateBrokerFields(SBrokerAwareMetrics &m)
  {
   m.brokerServer     = AccountInfoString(ACCOUNT_SERVER);
   m.accountCurrency  = AccountInfoString(ACCOUNT_CURRENCY);
   m.symbolDigits     = (int)SymbolInfoInteger(_Symbol, SYMBOL_DIGITS);
   m.commissionPerLot = InpCommissionPerLot;

//--- Accumulate slippage and commission from deal history
   double sum_slippage   = 0.0;
   double sum_commission = 0.0;
   int    slippage_count = 0;

   HistorySelect(0, TimeCurrent());
   int total_deals = HistoryDealsTotal();

   for(int i = 0; i < total_deals; i++)
     {
      ulong ticket = HistoryDealGetTicket(i);
      if(ticket == 0)
         continue;

      //--- Only process deals placed by this EA
      if(HistoryDealGetInteger(ticket, DEAL_MAGIC) != InpMagicNumber)
         continue;

      //--- Accumulate commission from all deal types
      sum_commission += MathAbs(HistoryDealGetDouble(ticket, DEAL_COMMISSION));

      //--- Compute slippage on entry deals: estimated from average spread
      if(HistoryDealGetInteger(ticket, DEAL_ENTRY) == DEAL_ENTRY_IN)
        {
         double fill_price = HistoryDealGetDouble(ticket, DEAL_PRICE);
         double point_size = SymbolInfoDouble(_Symbol, SYMBOL_POINT);
         if(point_size > 0.0 && fill_price > 0.0)
           {
            //--- Check if the broker uses floating spread
            double spread_pts = (SymbolInfoInteger(_Symbol, SYMBOL_SPREAD_FLOAT) != 0)
                                ? (double)SymbolInfoInteger(_Symbol, SYMBOL_SPREAD)
                                : 0.0;
            sum_slippage += spread_pts;
            slippage_count++;
           }
        }
     }

   m.totalCommissionPaid = sum_commission;
   m.avgSlippagePoints   = (slippage_count > 0) ? (sum_slippage / slippage_count) : 0.0;
   m.grossProfit         = m.netProfit + sum_commission;
  }
ExportBrokerAwareRow() coordinates the export. It calls PopulateBrokerFields(), sets file flags, writes the header for new files, and appends one formatted CSV row using the Part 1 spin‑lock pattern.
//+------------------------------------------------------------------+
//| ExportBrokerAwareRow: the single public export call              |
//+------------------------------------------------------------------+
void ExportBrokerAwareRow(SBrokerAwareMetrics &metrics, const string file_name, const bool use_common = true)
  {
   string tf_str = EnumToString(_Period);
   StringReplace(tf_str, "PERIOD_", "");

   PopulateBrokerFields(metrics);

//--- Build access flags
   int flags = FILE_CSV | FILE_ANSI | FILE_WRITE | FILE_READ;
   if(use_common)
      flags |= FILE_COMMON;

//--- Write header if file is new
   bool file_exists = FileIsExist(file_name, use_common ? FILE_COMMON : 0);

//--- Spin-lock open (reuses pattern from Part 1)
   int file_handle = INVALID_HANDLE;
   for(int attempt = 0; attempt < 50000; attempt++)
     {
      file_handle = FileOpen(file_name, flags, ',');
      if(file_handle != INVALID_HANDLE)
         break;
     }

   if(file_handle == INVALID_HANDLE)
     {
      PrintFormat("[BrokerAwareExporter] Failed to open [%s]. Error: %d", file_name, GetLastError());
      return;
     }

   FileSeek(file_handle, 0, SEEK_END);

   if(!file_exists)
      FileWriteString(file_handle, BuildBrokerAwareHeader() + "\n");

   FileWriteString(file_handle, BuildBrokerAwareRow(metrics, tf_str) + "\n");
   FileClose(file_handle);
  }
Verifying the Export with a Minimal EA
To verify that the include file compiles and functions, a minimal EA (Test_BrokerAware_EA.mq5) is used. It populates a dummy SBrokerAwareMetrics struct on the first tick and calls ExportBrokerAwareRow():
//+------------------------------------------------------------------+
//| Expert tick function                                             |
//+------------------------------------------------------------------+
void OnTick()
  {
//--- Export only once to avoid flooding the file system
   if(g_exported)
      return;
   g_exported = true;

//--- Prepare a sample metrics struct
   SBrokerAwareMetrics m;

//--- Populate standard performance fields (dummy data for testing)
   m.testPhase          = "TestRun";
   m.indicatorName      = "EMA_Crossover";
   m.filterPeriod       = 14;
   m.netProfit          = 500.0;
   m.sortinoRatio       = 1.5;
   m.maxDrawdownPct     = 12.0;
   m.falseFlipsWhipsaws = 5;
   m.avgLagBars         = 2.3;
   m.totalTrades        = 10;

//--- Broker fields will be populated automatically by
//--- PopulateBrokerFields() inside ExportBrokerAwareRow().
//--- We initialize them to safe baseline default values here.
   m.brokerServer        = "";
   m.accountCurrency     = "";
   m.symbolDigits        = 0;
   m.commissionPerLot    = InpCommissionPerLot;  // Pulled from underlying inclusion file input
   m.totalCommissionPaid = 0.0;
   m.avgSlippagePoints   = 0.0;
   m.grossProfit         = 0.0;

//--- Export the tracking row out to shared architecture layers
   string output_file = "BrokerAware_Test.csv";
   ExportBrokerAwareRow(m, output_file, true);

   PrintFormat("[Test EA] Row exported to %s. Check MQL5/Files (Common folder).", output_file);
  }
The resulting CSV contains all 17 columns — standard performance metrics plus the broker metadata — and serves as a structural verification of the schema. A sample output is shown below.

Figure 1 – Broker-Aware CSV Output. Screenshot of BrokerAware_Test.csv opened in a spreadsheet.
The Python Normalization Layer: broker_normalizer.py
The Python module applies a series of transformations to raw broker exports, producing a unified canonical DataFrame. All visualizations use a light, consistent plotting theme.
Loading and Tagging Raw Broker Exports
def load_broker_export(file_path: str, broker_id: str) -> Optional[pd.DataFrame]:
    if not os.path.isfile(file_path):
        logging.error(f"File not found: {file_path}")
        print(f"[Normalizer] Error: {file_path} not found.")
        return None
    try:
        df = pd.read_csv(file_path, encoding="ansi", low_memory=False)
    except UnicodeDecodeError:
        try:
            df = pd.read_csv(file_path, encoding="utf-8", low_memory=False)
        except Exception as exc:
            logging.error(f"Failed to parse {file_path}: {exc}")
            return None
    df["Broker_ID"] = broker_id
    logging.info(f"Loaded {len(df):,} rows from {os.path.basename(file_path)} [{broker_id}]")
    return df
The function attempts ANSI encoding first, falls back to UTF‑8, and tags every row with a Broker_ID column.
Pip Convention Resolution
def normalize_pip_convention(df: pd.DataFrame, broker_id: str) -> pd.DataFrame:
    profile = BROKER_PROFILES.get(broker_id)
    if profile is None:
        return df
    if profile.get("digit_convention", 5) == 4:
        point_cols = [c for c in df.columns if "Points" in c or "points" in c]
        for col in point_cols:
            if pd.api.types.is_numeric_dtype(df[col]):
                df[col] = df[col] * 10.0
                logging.info(f"[{broker_id}] Scaled {col} x10 (4-digit -> 5-digit).")
    return df
All columns containing "Points" (e.g., Avg_Slippage_Points) are scaled up by a factor of 10 for 4‑digit brokers, bringing them into the 5‑digit canonical convention.
Commission Normalization (expressed in basis points)
def normalize_commission(df: pd.DataFrame, broker_id: str) -> pd.DataFrame:
    profile            = BROKER_PROFILES.get(broker_id, {})
    commission_model   = profile.get("commission_model",   "spread_only")
    commission_per_lot = profile.get("commission_per_lot", 0.0)

    if "Total_Commission_Paid" not in df.columns:
        # Estimate from volume if missing
        vol_col = next((c for c in df.columns if "Volume" in c or "Lots" in c), None)
        if commission_model == "per_trade" and vol_col and pd.api.types.is_numeric_dtype(df[vol_col]):
            df["Total_Commission_Paid"] = df[vol_col].fillna(0) * commission_per_lot * 2.0
        else:
            df["Total_Commission_Paid"] = 0.0

    df["Total_Commission_Paid"] = pd.to_numeric(df["Total_Commission_Paid"], errors="coerce").fillna(0.0)

    vol_col = next((c for c in df.columns if "Volume" in c or "Lots" in c), None)
    if vol_col and pd.api.types.is_numeric_dtype(df[vol_col]):
        notional = df[vol_col].fillna(0.0) * 100_000.0
        df["Commission_BPS"] = np.where(
            notional > 0,
            (df["Total_Commission_Paid"] / notional) * 10_000.0,
            0.0
        )
    else:
        df["Commission_BPS"] = 0.0
    return df
Commission is expressed as basis points of trade notional, allowing direct comparison independent of trade size and account currency.
Symbol Alias Resolution
def normalize_symbols(df: pd.DataFrame, broker_id: str) -> pd.DataFrame:
    profile = BROKER_PROFILES.get(broker_id, {})
    sym_map = profile.get("symbol_map", {})
    if "Symbol" not in df.columns:
        df["Symbol_Canonical"] = "UNKNOWN"
        return df
    df["Symbol_Canonical"] = df["Symbol"].map(sym_map)
    unmapped_mask = df["Symbol_Canonical"].isna()
    unmapped_symbols = df.loc[unmapped_mask, "Symbol"].unique()
    for sym in unmapped_symbols:
        logging.warning(f"[{broker_id}] Unmapped symbol: '{sym}'.")
    df.loc[unmapped_mask, "Symbol_Canonical"] = df.loc[unmapped_mask, "Symbol"]
    return df
Broker‑specific symbol names (e.g., "EURUSDm", "Dow Jones") are mapped to canonical forms. Unmapped symbols are retained with their original name and logged.
Timestamp Reconciliation to UTC
def normalize_timestamps(df: pd.DataFrame,
                          broker_id: str) -> pd.DataFrame:
    profile    = BROKER_PROFILES.get(broker_id, {})
    utc_offset = profile.get("server_utc_offset", 0)
    delta      = timedelta(hours=utc_offset)

    # Broader pattern: match any column containing "time" or "date"
    ts_patterns = ["time", "date", "timestamp"]
    ts_cols = [c for c in df.columns
               if any(p.lower() in c.lower() for p in ts_patterns)]

    for col in ts_cols:
        # Remove the deprecated infer_datetime_format parameter
        parsed = pd.to_datetime(df[col], errors="coerce")
        if parsed.notna().sum() > 0:
            df[col + "_UTC"] = parsed - delta
            logging.info(f"[{broker_id}] Normalized {col} "
                         f"(offset: -{utc_offset}h).")
    return df
Timestamps are detected by name pattern, parsed, and shifted to UTC using the broker’s server offset.
Currency Conversion to USD Denomination
def normalize_currency(df: pd.DataFrame, broker_id: str) -> pd.DataFrame:
    profile          = BROKER_PROFILES.get(broker_id, {})
    account_currency = profile.get("account_currency", "USD")
    monetary_cols    = ["Net_Profit", "Total_Commission_Paid", "Gross_Profit"]
    if account_currency == "USD":
        for col in monetary_cols:
            if col in df.columns:
                df[col + "_USD"] = df[col]
        return df
    fx_rate = STATIC_FX_RATES_TO_USD.get(account_currency)
    if fx_rate is None:
        logging.warning(f"[{broker_id}] No FX rate for '{account_currency}'.")
        return df
    for col in monetary_cols:
        if col in df.columns:
            df[col + "_USD"] = pd.to_numeric(df[col], errors="coerce").fillna(0.0) * fx_rate
            logging.info(f"[{broker_id}] {col} -> USD @ {fx_rate:.4f}.")
    return df
A static exchange rate table converts profit and commission fields to USD. In production, this table should be replaced with a live or historically‑accurate FX feed.
The Unified Dataset Builder
def build_unified_dataset(broker_file_map: dict) -> pd.DataFrame:
    frames = []
    for broker_id, file_path in broker_file_map.items():
        df = load_broker_export(file_path, broker_id)
        if df is None: continue
        df = normalize_pip_convention(df, broker_id)
        df = normalize_symbols(df, broker_id)
        df = normalize_timestamps(df, broker_id)
        df = normalize_commission(df, broker_id)
        df = normalize_currency(df, broker_id)
        profile = BROKER_PROFILES.get(broker_id, {})
        df["Broker_Display"] = profile.get("display_name", broker_id)
        frames.append(df)
    if not frames:
        raise ValueError("No broker exports loaded.")
    unified = pd.concat(frames, ignore_index=True, sort=False)
    # Column aliases and numeric type enforcement follow...
    return unified
The function processes every broker in the map, applies all normalization steps, concatenates the results, and aliases columns to the canonical names.
Cross-Broker Comparative Analysis
Execution Quality Metrics
def summarize_execution_quality(unified: pd.DataFrame) -> pd.DataFrame:
    group_col = "Broker_Display" if "Broker_Display" in unified.columns else "Broker_ID"
    agg_dict = {}
    if "Commission_BPS"      in unified.columns: agg_dict["Commission_BPS"]      = "mean"
    if "Avg_Slippage_Points" in unified.columns: agg_dict["Avg_Slippage_Points"] = "mean"
    if "Total_Trades"        in unified.columns: agg_dict["Total_Trades"]        = "sum"
    summary = unified.groupby(group_col).agg(agg_dict).round(4)
    print("\n── Execution Quality Summary ──────────────────────────────")
    print(summary.to_string())
    return summary
Slippage Distribution Comparison
The plot_slippage_distributions() function generates a KDE plot of Avg_Slippage_Points for each broker, overlaid on a shared axis with vertical median markers. Only brokers with at least three data points are rendered.
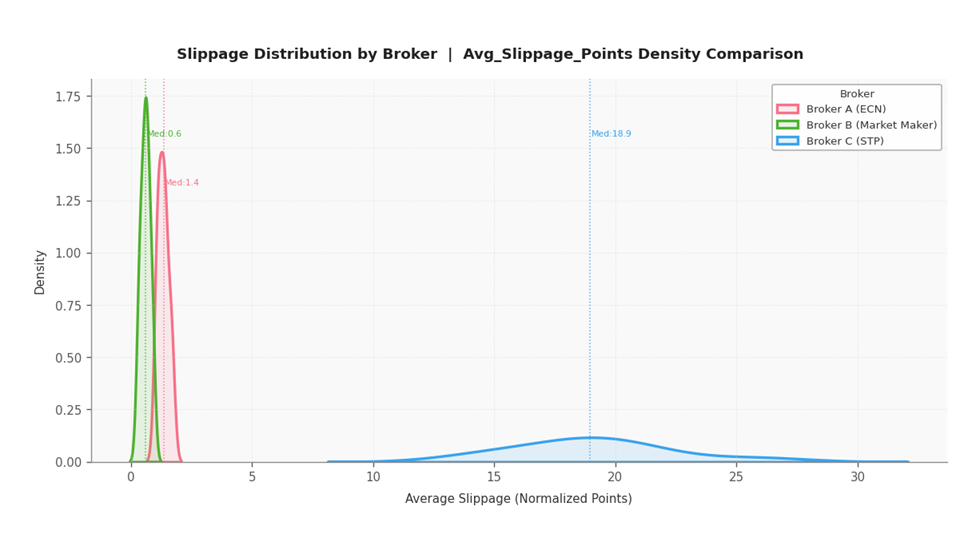
Figure 2 – Slippage Distribution by Broker. KDE density of normalized slippage points for three broker profiles. The overlaid distributions reveal structural differences in execution quality.
Net-of-Cost Performance Ranking
The plot_net_of_cost_ranking() function builds a grouped bar chart comparing Gross Profit vs. Net Profit (after commission) for each indicator and broker, filtered optionally by canonical symbol.

Figure 3 – Net-of-Cost Performance Ranking. Gross versus Net Profit (USD) for the EMA_Crossover indicator on EURUSD across three brokers. The difference between the Gross and Net bars represents the commission cost.
Deployment and Maintenance
The entry‑point block runs the full pipeline, saves the canonical dataset to normalized_outputs/unified_canonical.csv, prints the execution quality summary, and saves both visualization PNGs.
Broker profiles require periodic review for three reasons:
- Commission schedules change; an outdated commission_per_lot will silently produce incorrect Commission_BPS.
- Brokers occasionally adjust symbol naming conventions, causing unmapped entries that appear as warnings in the audit log.
- Brokers in daylight‑saving jurisdictions alternate between two UTC offsets seasonally.
The normalization_audit.log file records every unmapped symbol, failed timestamp parse, and static currency conversion. The canonical CSV is directly compatible with all functions from Parts 3 and 4; the Broker_Display column adds a new grouping dimension to every chart.
Verification and Testing
Before publication, every component was verified through a systematic testing protocol.
Synthetic Test Data
A separate script, generate_test_exports.py, creates three CSV files in an exports/ directory. Each file contains 10 rows with realistic variation in Avg_Slippage_Points drawn from normal distributions, ensuring the KDE plots render meaningful density curves.
- Broker A — 5‑digit, per‑trade commission, USD account, UTC+2, symbol EURUSD
- Broker B — 5‑digit, spread‑only commission, EUR account, UTC+3, symbol EURUSDm
- Broker C — 4‑digit, per‑trade commission, GBP account, UTC+0, symbol "Dow Jones"
Assertion-Based Validation
After running the normalizer, the following assertions confirm the correctness of each transformation:
import pandas as pd
df = pd.read_csv("normalized_outputs/unified_canonical.csv")

# Currency conversion: BrokerB EUR -> USD
assert round(df[df["Broker_ID"]=="BrokerB"]["Net_Profit_USD"].iloc[0], 1) == 432.8
# Currency conversion: BrokerC GBP -> USD
assert round(df[df["Broker_ID"]=="BrokerC"]["Net_Profit_USD"].iloc[0], 1) == 379.2
# Pip scaling: BrokerC Avg_Slippage_Points multiplied by 10
assert df[df["Broker_ID"]=="BrokerC"]["Avg_Slippage_Points"].iloc[0] > 10
# Symbol canonicalization: EURUSDm -> EURUSD, Dow Jones -> US30
assert set(df["Symbol_Canonical"]) == {"EURUSD", "US30"}
# Timestamps: BrokerA UTC+2 08:00 -> 06:00 UTC
assert pd.to_datetime(df[df["Broker_ID"]=="BrokerA"]["Open_Time_UTC"].iloc[0]).hour == 6
print("All assertions passed.")
Running these checks guarantees that pip convention scaling, symbol mapping, timestamp offset subtraction, commission basis‑point calculation, and currency conversion all produce the expected results.
Conclusion
A single‑broker analysis pipeline assumes a level of data uniformity that simply does not exist across real‑world brokerage environments. When CSV exports from multiple brokers are combined without preprocessing, differences in pip convention, symbol naming, time zone offsets, commission accounting, and currency denomination silently corrupt every comparative calculation. This article addressed that problem by introducing a broker‑aware export extension and a Python normalization layer that together convert heterogeneous raw data into a single, analyzable canonical dataset.
The solution rests on two complementary components. On the MetaTrader 5 side, BrokerAwareExporter.mqh enriches every exported row with broker‑specific metadata — server name, account currency, symbol digits, and measured commission and slippage — so that no manual tagging is required downstream. On the Python side, broker_normalizer.py uses a declarative broker profile registry to resolve every source of schema divergence: it scales 4‑digit point values to the 5‑digit convention, maps broker‑specific symbol aliases to canonical names, shifts timestamps to UTC, expresses commission in basis points of notional, and converts all monetary fields to USD. The output, unified_canonical.csv, conforms to a fixed schema and plugs directly into the visualization and analysis functions developed in Parts 3 and 4.
With a unified dataset, cross-broker comparisons become routine. For example: which broker has the lowest slippage, and how much commission erodes edge? How much of the theoretical edge does commission consume at each venue? Are performance rankings consistent across brokers, or do they invert under execution cost? The comparative charts — slippage distributions and net‑of‑cost rankings — expose these structural differences at a glance, while the anomaly‑free assertion suite guarantees that the normalization itself is correct.
The broker profile registry is designed to be maintained, not rewritten. Adding a new broker to the pipeline requires only a new dictionary entry; no normalization logic changes are necessary. Periodic review of the profiles, guided by the normalization_audit.log, keeps the pipeline aligned with evolving broker conditions. The entire system integrates seamlessly with the real‑time streaming from Part 5 and the optimization analytics from earlier parts, forming a complete, broker‑agnostic strategy evaluation framework.
By removing the silent data corruption that plagues multi‑broker analysis, this normalization layer allows you to focus on what the data actually says — not on whether the numbers can be trusted in the first place.
Programs used in the article:
| # | Name | Type | Description |
|---|---|---|---|
| 1 | BrokerAwareExporter.mqh | Include File | Extends the base CSV export schema with broker metadata fields; auto‑populates server name, account currency, symbol digits, commission, and slippage. |
| 2 | Test_BrokerAware_EA.mq5 | Demo EA | Minimal EA demonstrating how to include and call the broker‑aware exporter; writes one test row on the first tick. |
| 3 | generate_test_exports.py | Python Script | Creates synthetic multi‑row CSV files for three fictitious brokers with varied slippage values to test the normalizer. |
| 4 | broker_normalizer.py | Python Script | Full normalization pipeline: loads broker exports, normalizes pip conventions, symbols, timestamps, commission, and currency; builds a unified canonical dataset and generates comparative charts. |
| 5 | assertion_based_validation.py | Python Script | Verifies the correctness of the normalizer’s output by checking currency conversions, pip scaling, symbol canonicalization, and UTC timestamp offsets using assertion statements. |
| 6 | CSV_Data_Analysis_Part_6 | Zip Archive | Zip archive containing all the attached files and their paths relative to the terminal's root folder. |
Warning: All rights to these materials are reserved by MetaQuotes Ltd. Copying or reprinting of these materials in whole or in part is prohibited.
This article was written by a user of the site and reflects their personal views. MetaQuotes Ltd is not responsible for the accuracy of the information presented, nor for any consequences resulting from the use of the solutions, strategies or recommendations described.

 Building Automated Daily Trading Reports with the SendMail Function
 Low-Frequency Quantitative Strategies in MetaTrader 5 (Part 4): A Volatility-Adjusted Momentum-Based Intraday System
 Engineering a Self-Healing Expert Advisor in MQL5 (Part 5): Real-Time Recovery Dashboard (Final Part)
 Automating Classic Market Methods in MQL5 (Part 3): Stan Weinstein Stage Analysis

- Free trading apps
- Over 8,000 signals for copying
- Economic news for exploring financial markets
You agree to website policy and terms of use