

Automating Classic Market Methods in MQL5 (Part 3): Stan Weinstein Stage Analysis
 2 952
2 952
 0
0

Introduction
In Part 1 and Part 2 of this series, we automated Richard Wyckoff's method: detecting accumulation and distribution structures, entering at the optimal moment, and projecting targets from the cause measured within the range. Both articles were concerned with a specific structural event—the Spring, the Sign of Strength—and the precise sequence those events must follow before a trade is valid.
Stan Weinstein's Stage Analysis takes a broader view. Rather than waiting for a specific event within a structure, it asks a prior question: what phase of its lifecycle is this market currently in? Weinstein identified four stages—Base, Advancing, Top, and Declining—and made one central observation: almost all the money in a sustained trend is made in Stage 2, the Advancing phase. Buying in at any other stage is, in his words, playing against the house.
The method was originally developed for stocks on weekly charts. After studying thousands of patterns, Weinstein concluded that the 30-week simple moving average is the most reliable single indicator for identifying a market's stage. When the 30-week MA is rising and the price is above it, the market is in Stage 2. The reverse, when the 30-week MA is falling and price is below it, the market is in Stage 4. When the 30-week MA is flattening after a decline, with price beginning to move sideways above it, Stage 1 is forming. Lastly, when it flattens after an advance with price beginning to oscillate beneath it, Stage 3 is forming.
The entry signal is the Stage 2 breakout: price closing above the Stage 1 resistance level on volume at least twice the recent average. The exit signal is the first sign of Stage 3—price breaking below the 30-week MA on heavy volume, or the MA itself beginning to flatten after a long advance. For shorts, the mirror: Stage 4 breakdowns entered at the Stage 3 support break and exited when Stage 1 began to form.
This article builds that method into a complete MQL5 Expert Advisor. We will cover the following topics:
- Understanding the Four Stages
- Adapting Weinstein for Forex
- Implementation in MQL5
- Backtesting
- Known Limitations
- Conclusion
Understanding the Four Stages
Weinstein's framework treats every market as moving through a cycle. The cycle is not perfectly regular in time—Stage 2 can last months or years, Stage 4 can be brief or extended—but the sequence is consistent. Understanding what each stage looks like is the foundation of coding the detection logic.
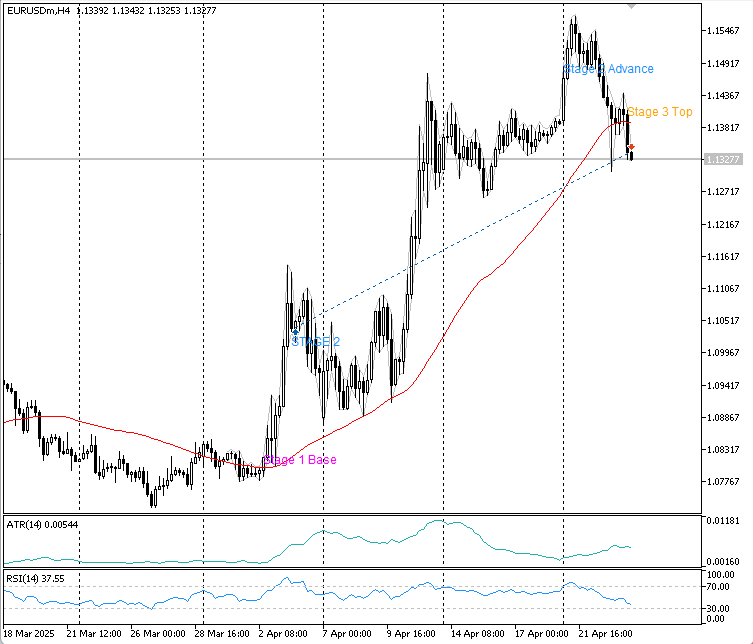
Fig. 1. Chart showing Stage 1, Stage 2 (entry), and Stage 3
Stage 1—The Base
Stage 1 follows a downtrend. Price has been declining, the 30-week MA has been falling, and sellers have been in control. At some point, the selling exhausts itself. Price stops making new lows and begins to move sideways. The 30-week MA starts to flatten—it is no longer falling, though it has not yet started to rise. Volume during Stage 1 is generally declining—there is little interest from either buyers or sellers. This is the accumulation phase in Wyckoff terms, though Weinstein did not use that language.
The key characteristic that distinguishes late Stage 1 from mid-Stage 1 is the emergence of increasing volume on up days and drying volume on down days. Institutions are quietly building positions. The 30-week MA has not yet turned up, but the price action around it is changing character.
Stage 2—The Advancing Phase
Stage 2 begins with the breakout. Price closes above the resistance level that has been capping Stage 1 on volume meaningfully above average. The 30-week MA turns upward. This is the only stage where Weinstein says to buy.
The characteristics of Stage 2 are clear: price above the rising 30-week MA, volume expanding on up moves and contracting on pullbacks, higher highs, and higher lows. Pullbacks to the 30-week MA during Stage 2 are buying opportunities, not warnings. The trend is intact as long as the price does not close materially below the 30-week MA on heavy volume.
Stage 3—The Top
Stage 3 forms when the advance runs out of fuel. The price stops making meaningful new highs and begins to oscillate around the 30-week MA. The MA itself flattens—it is no longer rising. Volume on up days begins to dry up while volume on down days starts to expand. This is distribution in Wyckoff terms.
The danger of Stage 3 is that it can look like a continuation pattern. Price is still near its highs. The 30-week MA is still in the same area. Weinstein's warning is explicit: in Stage 3 the risk-reward has shifted. You are no longer playing with the trend—you are playing against an emerging reversal.
Stage 4—The Declining Phase
Stage 4 begins when price breaks below Stage 3 support on heavy volume. The 30-week MA turns downward. From this point, rallies are selling opportunities, not breakouts. Price consistently makes lower highs and lower lows. Volume on down moves expands while volume on rallies contracts.
Stage 4 is the mirror of Stage 2. It is where short traders have the equivalent structural advantage that long traders have in Stage 2.
Adapting Weinstein for Forex
Weinstein designed Stage Analysis for stocks on weekly charts. Three adaptations are needed to apply it correctly in MetaTrader 5 on forex pairs.
Timeframe. The 30-week MA on a weekly chart corresponds to the 150-period MA on the daily chart or approximately the 750-period MA on H4. The EA uses the daily timeframe with a 150-period simple moving average. This captures the same structural information as Weinstein's 30-week MA while remaining practical for MetaTrader 5 backtesting on daily bars.
Volume. Stocks have real exchange volume. Forex pairs have tick volume—a proxy for activity, as established earlier in this series. The same relative volume approach applies here. Volume is compared against a rolling average. A breakout requires volume meaningfully above that average to be considered valid.
No relative strength ranking. Weinstein's original method includes a relative strength filter—he only buys stocks that are outperforming the broader market index. In Forex, there is no single benchmark equivalent to the S&P 500. The relative strength filter is replaced with a momentum confirmation: the 14-period RSI must be above 50 at the time of a Stage 2 breakout entry, confirming that momentum supports the move.
Implementation in MQL5
We build the EA section by section. Each section is explained before the code is shown.
Includes Enumerations and Input Parameters
We need the trade library for order execution, an enumeration for the four stages, and inputs that control the moving average period, volume threshold, RSI filter, and risk settings.
//+------------------------------------------------------------------+
//|                                           WeinsteinStageEA.mq5   |
//|                                Copyright 2026, Tola Moses Hector |
//|                                          https://t.me/tolahector |
//+------------------------------------------------------------------+
#property copyright "Copyright 2026, Tola Moses Hector"
#property link      "https://t.me/tolahector"
#property version   "1.00"
#property description "Automating Classic Market Methods in MQL5 Part 3"
#property description "Stan Weinstein Stage Analysis EA"
#property description "Trades Stage 2 breakouts long and Stage 4 breakdowns short"
#property description "Daily timeframe recommended"

#include <Trade\Trade.mqh>

//+------------------------------------------------------------------+
//| Market Stage Enumeration                                         |
//+------------------------------------------------------------------+
enum ENUM_MARKET_STAGE
  {
   STAGE_UNKNOWN   = 0, // Stage cannot be determined
   STAGE_1_BASE    = 1, // Base: MA flattening, price sideways above or at MA
   STAGE_2_ADVANCE = 2, // Advance: MA rising, price above MA, higher highs
   STAGE_3_TOP     = 3, // Top: MA flattening, price oscillating around MA
   STAGE_4_DECLINE = 4  // Decline: MA falling, price below MA, lower lows
  };

//+------------------------------------------------------------------+
//| Input Parameters                                                 |
//+------------------------------------------------------------------+
input group "=== Stage Detection ==="
input int    InpMAPeriod         = 150;    // MA period (150 daily = 30 weekly)
input int    InpSlopeLookback    = 10;     // Bars to measure MA slope direction
input double InpSlopeThreshold   = 0.0001; // Minimum slope to classify as rising or falling
input int    InpHighLowLookback  = 20;     // Bars to check for higher highs and lower lows

input group "=== Breakout Conditions ==="
input double InpVolBreakoutMult  = 1.8;   // Volume multiplier required at breakout
input int    InpVolAvgPeriod     = 20;    // Bars for average volume calculation
input int    InpRSIPeriod        = 14;    // RSI period for momentum filter
input double InpRSIBullMin       = 50.0;  // Minimum RSI for Stage 2 entry
input double InpRSIBearMax       = 50.0;  // Maximum RSI for Stage 4 entry

input group "=== Entry and Risk ==="
input double InpRiskPercent      = 1.0;   // Risk per trade as percent of balance
input double InpRR               = 3.0;   // Risk-reward ratio
input int    InpATRPeriod        = 14;    // ATR period for stop placement
input double InpATRMult          = 2.0;   // ATR multiplier for stop distance

input group "=== Exit Conditions ==="
input int    InpExitMAPeriod     = 150;   // MA period for exit check
input double InpExitVolMult      = 1.5;   // Volume multiplier for MA break exit signal

input group "=== General ==="
input int    InpMagicNumber      = 999001; // Magic number
input int    InpSlippage         = 10;     // Slippage in points
input bool   InpShowLabels       = true;   // Draw stage labels on chart
input bool   InpTradeShorts      = true;   // Allow Stage 4 short trades
The "ENUM_MARKET_STAGE" enumeration gives a name to each stage. The code that follows will never use a raw number to refer to a stage—it will always use the enumeration value. This makes the logic readable: if the current stage is "STAGE_2_ADVANCE," it reads exactly as it sounds.
The slope threshold ("InpSlopeThreshold") needs clarification. The MA slope is computed as the per-bar change over the lookback period and then normalized by the current price. A threshold of 0.0001 means the MA must be moving at least 0.01% per bar in either direction to be classified as rising or falling. Below that threshold it is classified as flat—which is the condition that identifies Stage 1 and Stage 3.
Global Variables and Indicator Handles
Three indicator handles cover all the detection needs: the moving average for stage classification, the ATR for stop placement, and the RSI for momentum confirmation on breakouts. The "g_prev_stage" is important—we need to know when a transition happens, not just what the current stage is. A Stage 2 trade is entered at the transition from Stage 1 to Stage 2, not on every bar that is in Stage 2.
Utility Functions
"PipSize()" and "CalcLots()" are the same instrument-agnostic functions introduced in Part 1 and Part 2. They are not reproduced here—include them at the top of the file exactly as written in the previous articles.
//+------------------------------------------------------------------+
//| Returns pip size for the current symbol                          |
//+------------------------------------------------------------------+
double PipSize()
  {
   int digits = (int)SymbolInfoInteger(_Symbol, SYMBOL_DIGITS); // Get symbol digits
   return (digits == 3 || digits == 5) ? _Point * 10.0 : _Point; // Return pip size
  }

//+------------------------------------------------------------------+
//| Calculates lot size from risk percent and stop distance in pips  |
//+------------------------------------------------------------------+
double CalcLots(double sl_pips)
  {
   double balance    = AccountInfoDouble(ACCOUNT_BALANCE);                  // Get balance
   double risk_money = balance * InpRiskPercent / 100.0;                    // Monetary risk
   double tick_val   = SymbolInfoDouble(_Symbol, SYMBOL_TRADE_TICK_VALUE);  // Tick value
   double tick_size  = SymbolInfoDouble(_Symbol, SYMBOL_TRADE_TICK_SIZE);   // Tick size
   double pip_size   = PipSize();                                           // Get pip size
   if(tick_size <= 0 || tick_val <= 0 || sl_pips <= 0)
      return 0;                                                             // Validate inputs
   double pip_value  = (pip_size / tick_size) * tick_val;                   // Pip monetary value
   double lots       = risk_money / (sl_pips * pip_value);                  // Raw lot size
   double step       = SymbolInfoDouble(_Symbol, SYMBOL_VOLUME_STEP);       // Volume step
   double min_lot    = SymbolInfoDouble(_Symbol, SYMBOL_VOLUME_MIN);        // Minimum lot
   double max_lot    = SymbolInfoDouble(_Symbol, SYMBOL_VOLUME_MAX);        // Maximum lot
   lots = MathFloor(lots / step) * step;                                    // Normalize to step
   return MathMax(min_lot, MathMin(max_lot, lots));                         // Clamp to limits
  }
Chart Drawing
//+------------------------------------------------------------------+
//| Places a text label at the specified bar and price               |
//+------------------------------------------------------------------+
void DrawLabel(string name, datetime time, double price, string text, color clr)
  {
   if(!InpShowLabels)
      return;                                                               // Check flag
   string obj = "WST_" + name;                                              // Build object name
   ObjectDelete(0, obj);                                                    // Remove existing
   ObjectCreate(0, obj, OBJ_TEXT, 0, time, price);                          // Create text object
   ObjectSetString(0, obj, OBJPROP_TEXT, text);                             // Set text content
   ObjectSetInteger(0, obj, OBJPROP_COLOR, clr);                            // Set color
   ObjectSetInteger(0, obj, OBJPROP_FONTSIZE, 9);                           // Set font size
   ChartRedraw(0);                                                          // Redraw chart
  }
//+------------------------------------------------------------------+
//| Removes all chart objects created by this EA                     |
//+------------------------------------------------------------------+
void ClearLabels()
  {
   int total = ObjectsTotal(0);                                             // Get object count
   for(int i = total - 1; i >= 0; i--)                                      // Iterate backwards
     {
      string name = ObjectName(0, i);                                       // Get object name
      if(StringFind(name, "WST_") == 0)
         ObjectDelete(0, name);                                             // Delete if EA's
     }
   ChartRedraw(0);                                                          // Redraw chart
  }
Stage Classification
This is the core of the EA. The "ClassifyStage()" function reads the moving average values, measures the slope, checks price position relative to the MA, and checks whether recent price action shows higher highs or lower lows. It returns the current stage as an "ENUM_MARKET_STAGE" value.
The slope measurement works as follows. We take the MA value at bar 1 and the MA value at bar "InpSlopeLookback + 1." The difference divided by the lookback gives the slope per bar. We normalize this by dividing by the current price to make the threshold instrument-agnostic—a threshold of 0.0001 means the same thing on EURUSD at 1.08 and on gold at 2400.
//+------------------------------------------------------------------+
//| Classifies the current market stage from MA, price, and volume   |
//+------------------------------------------------------------------+
ENUM_MARKET_STAGE ClassifyStage()
  {
   double ma_buf[];                                                         // MA buffer
   ArraySetAsSeries(ma_buf, true);                                          // Set as series
   int bars_needed = InpSlopeLookback + InpHighLowLookback + 5;             // Bars required
   if(CopyBuffer(g_ma_handle, 0, 1, bars_needed, ma_buf) < bars_needed)
      return STAGE_UNKNOWN;                                                 // Insufficient data
   double close1    = iClose(_Symbol, PERIOD_CURRENT, 1);                   // Last close
   double ma_now    = ma_buf[0];                                            // Current MA
   double ma_past   = ma_buf[InpSlopeLookback];                             // MA at lookback
   double slope     = (ma_now - ma_past) / InpSlopeLookback / close1;       // Normalized slope
   bool   ma_rising = slope >  InpSlopeThreshold;                           // MA rising
   bool   ma_falling= slope < -InpSlopeThreshold;                           // MA falling
   bool   ma_flat   = !ma_rising && !ma_falling;                            // MA flat
   bool   price_above_ma = close1 > ma_now;                                 // Price above MA
   bool   price_below_ma = close1 < ma_now;                                 // Price below MA
//--- Check for higher highs (Stage 2 characteristic)
   double high_recent = 0, high_older = 0;                                  // High comparators
   int half = InpHighLowLookback / 2;                                       // Split midpoint
   for(int i = 1; i <= half; i++)
      high_recent = MathMax(high_recent, iHigh(_Symbol, PERIOD_CURRENT, i)); // Recent highs
   for(int i = half + 1; i <= InpHighLowLookback; i++)
      high_older = MathMax(high_older, iHigh(_Symbol, PERIOD_CURRENT, i));  // Older highs
   bool higher_highs = high_recent > high_older;                            // Higher highs present
//--- Check for lower lows (Stage 4 characteristic)
   double low_recent = DBL_MAX, low_older = DBL_MAX;                        // Low comparators
   for(int i = 1; i <= half; i++)
      low_recent = MathMin(low_recent, iLow(_Symbol, PERIOD_CURRENT, i));   // Recent lows
   for(int i = half + 1; i <= InpHighLowLookback; i++)
      low_older = MathMin(low_older, iLow(_Symbol, PERIOD_CURRENT, i));     // Older lows
   bool lower_lows = low_recent < low_older;                                // Lower lows present
//--- Stage classification logic
   if(ma_rising && price_above_ma && higher_highs)
      return STAGE_2_ADVANCE;                                               // Stage 2: advancing
   if(ma_falling && price_below_ma && lower_lows)
      return STAGE_4_DECLINE;                                               // Stage 4: declining
   if(ma_flat && price_above_ma)
      return STAGE_1_BASE;                                                  // Stage 1: basing
   if(ma_flat && price_below_ma)
      return STAGE_3_TOP;                                                   // Stage 3: topping
   if(ma_rising && price_below_ma)
      return STAGE_3_TOP;                                                   // Stage 3: early decline
   if(ma_falling && price_above_ma)
      return STAGE_1_BASE;                                                  // Stage 1: early base
   return STAGE_UNKNOWN;                                                    // Cannot classify
  }
Reading through the classification: if the MA is rising, the price is above it, and recent highs exceed older highs, we are in Stage 2. Then if the MA is falling, the price is below it, and recent lows are below older lows, we are in Stage 4. If the MA is flat with the price above it, Stage 1. Then if the MA is flat with the price below it, Stage 3. The two additional cases—rising MA with the price below it and falling MA with the price above it—represent transitional moments that Weinstein would classify as late Stage 3 and early Stage 1, respectively.
Breakout and Breakdown ValidationDetecting the stage transition is not enough. Weinstein requires volume confirmation on the breakout. The "IsValidBreakout()" function checks whether the last bar's volume meets the threshold.
//+------------------------------------------------------------------+
//| Returns true if volume confirms a valid Stage 2 breakout         |
//+------------------------------------------------------------------+
bool IsValidBreakout()
  {
   long vol_buf[];                                                          // Volume buffer
   ArraySetAsSeries(vol_buf, true);                                         // Set as series
   if(CopyTickVolume(_Symbol, PERIOD_CURRENT, 1, InpVolAvgPeriod + 1, vol_buf) < InpVolAvgPeriod + 1)
      return false;                                                         // Insufficient data
   long  breakout_vol = vol_buf[0];                                         // Breakout bar volume
   double avg_vol     = 0;                                                  // Volume accumulator
   for(int i = 1; i <= InpVolAvgPeriod; i++)
      avg_vol += (double)vol_buf[i];                                        // Sum prior volumes
   avg_vol /= InpVolAvgPeriod;                                              // Compute average
   bool vol_ok = ((double)breakout_vol > avg_vol * InpVolBreakoutMult);     // Volume check
   Print(StringFormat("Weinstein: BreakoutVol:%I64d AvgVol:%.0f Ratio:%.2f Required:%.1fx Valid:%s",
                      breakout_vol, avg_vol, (double)breakout_vol / avg_vol,
                      InpVolBreakoutMult, vol_ok ? "YES" : "NO"));          // Log result
   return vol_ok;                                                           // Return result
  }

//+------------------------------------------------------------------+
//| Returns true if RSI confirms momentum at the breakout bar        |
//+------------------------------------------------------------------+
bool RSIConfirmsBreakout(bool is_long)
  {
   double rsi_buf[];                                                        // RSI buffer
   ArraySetAsSeries(rsi_buf, true);                                         // Set as series
   if(CopyBuffer(g_rsi_handle, 0, 1, 1, rsi_buf) < 1)
      return false;                                                         // Insufficient data
   double rsi = rsi_buf[0];                                                 // RSI value
   bool ok = is_long ? rsi >= InpRSIBullMin : rsi <= InpRSIBearMax;         // Check threshold
   Print(StringFormat("Weinstein: RSI:%.1f Required:%s%.1f Valid:%s",
                      rsi, is_long ? ">=" : "<=",
                      is_long ? InpRSIBullMin : InpRSIBearMax,
                      ok ? "YES" : "NO"));                                  // Log result
   return ok;                                                               // Return result
  }
"IsValidBreakout()" computes the average volume of the prior "InpVolAvgPeriod" bars and checks whether the breakout bar's volume exceeds 1.8 times that average. Weinstein specified two to three times the average volume as the ideal confirmation. The default of 1.8 is slightly below that to account for the generally lower tick volume on forex pairs compared to exchange-traded equities. "RSIConfirmsBreakout()" adds the momentum filter: for a long entry, the RSI must be at or above 50, confirming that momentum supports the breakout direction.
Trade Execution
The entry function is called only when a stage transition is detected. It validates the breakout conditions, sizes the position, places the stop below the MA for longs and above it for shorts, and sets the take profit at the configured risk-reward multiple.
//+------------------------------------------------------------------+
//| Opens a Stage 2 long trade on confirmed breakout                 |
//+------------------------------------------------------------------+
void OpenLong()
  {
   if(!IsValidBreakout())
     {
      Print("Weinstein: Stage 2 breakout — volume insufficient. Skipping.");  // Log skip
      return;                                                                 // Volume not confirmed
     }
   if(!RSIConfirmsBreakout(true))
     {
      Print("Weinstein: Stage 2 breakout — RSI not confirming. Skipping.");   // Log skip
      return;                                                                 // Momentum not confirmed
     }
   double atr_buf[];                                                          // ATR buffer
   ArraySetAsSeries(atr_buf, true);                                           // Set as series
   if(CopyBuffer(g_atr_handle, 0, 1, 1, atr_buf) < 1)
      return;                                                                 // Copy ATR
   double atr    = atr_buf[0];                                                // ATR value
   double ask    = SymbolInfoDouble(_Symbol, SYMBOL_ASK);                     // Current ask
   double sl     = ask - atr * InpATRMult;                                    // Stop below recent ATR
   double sl_pip = (ask - sl) / PipSize();                                    // Stop in pips
   double tp     = ask + sl_pip * InpRR * PipSize();                          // Take profit at RR
   double lots   = CalcLots(sl_pip);                                          // Calculate lot size
   if(lots <= 0)
      return;                                                                 // Invalid lot size
   long   stop_lv  = SymbolInfoInteger(_Symbol, SYMBOL_TRADE_STOPS_LEVEL);    // Broker stop level
   double min_dist = stop_lv * _Point;                                        // Minimum distance
   if(ask - sl < min_dist)
      sl = ask - min_dist - _Point;                                           // Adjust SL if needed
   if(tp - ask < min_dist)
      tp = ask + min_dist + _Point;                                           // Adjust TP if needed
   CTrade trade;                                                              // Trade object
   trade.SetExpertMagicNumber(InpMagicNumber);                                // Set magic number
   trade.SetDeviationInPoints(InpSlippage);                                   // Set slippage
   if(trade.Buy(lots, _Symbol, ask, sl, tp, "Weinstein Stage 2 Long"))        // Open long
     {
      datetime t1 = iTime(_Symbol, PERIOD_CURRENT, 1);                       // Get bar time
      DrawLabel("S2ENTRY", t1, iLow(_Symbol, PERIOD_CURRENT, 1) - PipSize() * 5,
                "STAGE 2", clrDodgerBlue);                                   // Draw label
      Print(StringFormat("Weinstein: LONG opened | Lots:%.2f | Ask:%.5f | SL:%.5f | TP:%.5f",
                         lots, ask, sl, tp));                                // Log trade
      g_in_trade = true;                                                     // Mark as in trade
     }
  }

//+------------------------------------------------------------------+
//| Opens a Stage 4 short trade on confirmed breakdown               |
//+------------------------------------------------------------------+
void OpenShort()
  {
   if(!InpTradeShorts)
      return;                                                                 // Shorts disabled
   if(!IsValidBreakout())
     {
      Print("Weinstein: Stage 4 breakdown — volume insufficient. Skipping."); // Log skip
      return;                                                                 // Volume not confirmed
     }
   if(!RSIConfirmsBreakout(false))
     {
      Print("Weinstein: Stage 4 breakdown — RSI not confirming. Skipping.");  // Log skip
      return;                                                                 // Momentum not confirmed
     }
   double atr_buf[];                                                          // ATR buffer
   ArraySetAsSeries(atr_buf, true);                                           // Set as series
   if(CopyBuffer(g_atr_handle, 0, 1, 1, atr_buf) < 1)
      return;                                                                 // Copy ATR
   double atr    = atr_buf[0];                                                // ATR value
   double bid    = SymbolInfoDouble(_Symbol, SYMBOL_BID);                     // Current bid
   double sl     = bid + atr * InpATRMult;                                    // Stop above recent ATR
   double sl_pip = (sl - bid) / PipSize();                                    // Stop in pips
   double tp     = bid - sl_pip * InpRR * PipSize();                          // Take profit at RR
   double lots   = CalcLots(sl_pip);                                          // Calculate lot size
   if(lots <= 0)
      return;                                                                 // Invalid lot size
   long   stop_lv  = SymbolInfoInteger(_Symbol, SYMBOL_TRADE_STOPS_LEVEL);    // Broker stop level
   double min_dist = stop_lv * _Point;                                        // Minimum distance
   if(sl - bid < min_dist)
      sl = bid + min_dist + _Point;                                           // Adjust SL if needed
   if(bid - tp < min_dist)
      tp = bid - min_dist - _Point;                                           // Adjust TP if needed
   CTrade trade;                                                              // Trade object
   trade.SetExpertMagicNumber(InpMagicNumber);                                // Set magic number
   trade.SetDeviationInPoints(InpSlippage);                                   // Set slippage
   if(trade.Sell(lots, _Symbol, bid, sl, tp, "Weinstein Stage 4 Short"))      // Open short
     {
      datetime t1 = iTime(_Symbol, PERIOD_CURRENT, 1);                        // Get bar time
      DrawLabel("S4ENTRY", t1, iHigh(_Symbol, PERIOD_CURRENT, 1) + PipSize() * 5,
                "STAGE 4", clrCrimson);                                       // Draw label
      Print(StringFormat("Weinstein: SHORT opened | Lots:%.2f | Bid:%.5f | SL:%.5f | TP:%.5f",
                         lots, bid, sl, tp));                                 // Log trade
      g_in_trade = true;                                                      // Mark as in trade
     }
  }
The stop is placed at ATR × 2.0 from the entry rather than at the MA itself. The MA is the exit signal—if the price closes below the MA on heavy volume during Stage 2, the trade is reviewed for early exit. But the initial stop must absorb normal volatility without being hit by routine pullbacks to the MA.
Exit Management
Weinstein's exit criteria for Stage 2 longs are price closing below the rising 30-week MA on heavy volume or the MA itself beginning to flatten (Stage 3 forming). We check these conditions on each new bar for open positions.
//+------------------------------------------------------------------+
//| Checks exit conditions for open positions                        |
//+------------------------------------------------------------------+
void CheckExit()
  {
   for(int i = PositionsTotal() - 1; i >= 0; i--)                           // Iterate positions
     {
      ulong ticket = PositionGetTicket(i);                                  // Get ticket
      if(!PositionSelectByTicket(ticket))
         continue;                                                          // Select position
      if(PositionGetString(POSITION_SYMBOL)  != _Symbol)
         continue;                                                          // Check symbol
      if(PositionGetInteger(POSITION_MAGIC)  != InpMagicNumber)
         continue;                                                          // Check magic
      long pos_type = PositionGetInteger(POSITION_TYPE);                    // Get position type
      double ma_buf[];                                                      // MA buffer
      ArraySetAsSeries(ma_buf, true);                                       // Set as series
      if(CopyBuffer(g_ma_handle, 0, 1, 1, ma_buf) < 1)
         continue;                                                          // Copy MA
      double ma_now  = ma_buf[0];                                           // Current MA
      double close1  = iClose(_Symbol, PERIOD_CURRENT, 1);                  // Last close
      long   vol_buf[];                                                     // Volume buffer
      ArraySetAsSeries(vol_buf, true);                                      // Set as series
      bool vol_ok = false;                                                  // Volume flag
      if(CopyTickVolume(_Symbol, PERIOD_CURRENT, 1, InpVolAvgPeriod + 1, vol_buf) >= InpVolAvgPeriod + 1)
        {
         double avg_vol = 0;                                                // Average accumulator
         for(int j = 1; j <= InpVolAvgPeriod; j++)
            avg_vol += (double)vol_buf[j];                                  // Sum volumes
         avg_vol /= InpVolAvgPeriod;                                        // Compute average
         vol_ok = ((double)vol_buf[0] > avg_vol * InpExitVolMult);          // Volume check
        }
      bool exit_long  = (pos_type == POSITION_TYPE_BUY  && close1 < ma_now && vol_ok); // Long exit signal
      bool exit_short = (pos_type == POSITION_TYPE_SELL && close1 > ma_now && vol_ok); // Short exit signal
      if(exit_long || exit_short)                                           // Exit condition met
        {
         CTrade trade;                                                      // Trade object
         trade.SetExpertMagicNumber(InpMagicNumber);                        // Set magic
         trade.SetDeviationInPoints(InpSlippage);                           // Set slippage
         if(trade.PositionClose(ticket))                                    // Close position
           {
            string dir = (pos_type == POSITION_TYPE_BUY) ? "LONG" : "SHORT"; // Direction label
            Print(StringFormat("Weinstein: %s closed — MA breach on volume. Ticket:%I64u",
                               dir, ticket));                               // Log exit
            g_in_trade = false;                                             // Update flag
           }
        }
     }
  }
The exit requires both conditions: price closing on the wrong side of the MA and volume above the exit threshold. A close below the MA on low volume during Stage 2 is a normal pullback—Weinstein explicitly warned against exiting on every minor MA touch. Only when the close is accompanied by meaningful volume does the exit trigger.
OnInit, OnDeinit, and OnTick
//+------------------------------------------------------------------+
//| Expert initialization function                                   |
//+------------------------------------------------------------------+
int OnInit()
  {
   g_ma_handle  = iMA(_Symbol, PERIOD_CURRENT, InpMAPeriod, 0, MODE_SMA, PRICE_CLOSE); // Create MA handle
   g_atr_handle = iATR(_Symbol, PERIOD_CURRENT, InpATRPeriod);             // Create ATR handle
   g_rsi_handle = iRSI(_Symbol, PERIOD_CURRENT, InpRSIPeriod, PRICE_CLOSE); // Create RSI handle
   if(g_ma_handle  == INVALID_HANDLE ||                                    // Check MA handle
      g_atr_handle == INVALID_HANDLE ||                                    // Check ATR handle
      g_rsi_handle == INVALID_HANDLE)                                      // Check RSI handle
     {
      Print("WeinsteinStageEA: Indicator handle creation failed.");        // Log error
      return INIT_FAILED;                                                  // Return failure
     }
   g_trade.SetExpertMagicNumber(InpMagicNumber);                           // Set magic number
   g_trade.SetDeviationInPoints(InpSlippage);                              // Set slippage
   g_prev_stage = STAGE_UNKNOWN;                                           // Initialize prev stage
   g_in_trade   = false;                                                   // No initial position
   g_last_bar   = 0;                                                       // Initialize bar time
   Print("WeinsteinStageEA initialized | Symbol:", _Symbol,
         " | TF:", EnumToString(Period()),
         " | MA Period:", InpMAPeriod);                                    // Log initialization
   return INIT_SUCCEEDED;                                                  // Return success
  }

//+------------------------------------------------------------------+
//| Expert deinitialization function                                 |
//+------------------------------------------------------------------+
void OnDeinit(const int reason)
  {
   IndicatorRelease(g_ma_handle);                                           // Release MA handle
   IndicatorRelease(g_atr_handle);                                          // Release ATR handle
   IndicatorRelease(g_rsi_handle);                                          // Release RSI handle
   ClearLabels();                                                           // Remove chart objects
  }

//+------------------------------------------------------------------+
//| Expert tick function                                             |
//+------------------------------------------------------------------+
void OnTick()
  {
   datetime current_bar = iTime(_Symbol, PERIOD_CURRENT, 0);                // Current bar open time
   if(current_bar == g_last_bar)
      return;                                                               // Skip if same bar
   g_last_bar = current_bar;                                                // Update last bar time
//--- Check exit conditions for any open position
   CheckExit();                                                             // Check exit signals
//--- Classify current stage
   ENUM_MARKET_STAGE current_stage = ClassifyStage();                       // Get current stage
   if(current_stage == STAGE_UNKNOWN)                                       // Cannot classify
     {
      g_prev_stage = STAGE_UNKNOWN;                                         // Reset previous stage
      return;                                                               // Exit tick
     }
//--- Log stage if changed
   if(current_stage != g_prev_stage)                                        // Stage changed
     {
      string stage_names[] = {"Unknown", "Stage 1 Base", "Stage 2 Advance", "Stage 3 Top", "Stage 4 Decline"}; // Stage names
      Print(StringFormat("Weinstein: Stage transition: %s", stage_names[current_stage])); // Log transition
      datetime t1 = iTime(_Symbol, PERIOD_CURRENT, 1);                     // Get bar time
      color stage_colors[] = {clrGray, clrYellow, clrDodgerBlue, clrOrange, clrCrimson}; // Stage colors
      DrawLabel("STAGE" + IntegerToString((int)current_stage),
                t1, iHigh(_Symbol, PERIOD_CURRENT, 1) + PipSize() * 8,
                stage_names[current_stage], stage_colors[current_stage]);    // Draw label
     }
//--- Enter on stage transition only — not on every bar within a stage
   if(!g_in_trade)                                                           // Only if no open trade
     {
      if(current_stage == STAGE_2_ADVANCE && g_prev_stage == STAGE_1_BASE)   // Stage 1 -> 2 transition
         OpenLong();                                                         // Enter long
      else
         if(current_stage == STAGE_4_DECLINE && g_prev_stage == STAGE_3_TOP) // Stage 3 -> 4 transition
            OpenShort();                                                     // Enter short
     }
   g_prev_stage = current_stage;                                             // Update previous stage
  }
//+------------------------------------------------------------------+
The entry logic in "OnTick()" is worth reading carefully. The trade is only entered on a stage transition—specifically when the stage changes from Stage 1 to Stage 2 for longs and from Stage 3 to Stage 4 for shorts. If the EA has been running for several bars and the market is already deep in Stage 2, no trade is entered—the transition already happened and the optimal entry price has passed. This enforces Weinstein's discipline: you do not chase a trend that is already well established.
Backtesting
To test the EA, open the MetaTrader 5 Strategy Tester and set: Symbol—EURUSD; Timeframe—Daily; Modeling—Every tick based on real ticks; Initial deposit—$10,000; Test period—2019.01.01–2024.12.31. Then apply the following inputs: InpMAPeriod=150, InpSlopeLookback=10, InpSlopeThreshold=0.0001, InpHighLowLookback=20, InpVolBreakoutMult=1.8, InpVolAvgPeriod=20, InpRSIPeriod=14, InpRSIBullMin=50, InpRSIBearMax=50, InpRiskPercent=1.0, InpRR=3.0, InpATRPeriod=14, and InpATRMult=2.0.
A longer test period is used here than in Parts 1 and 2 because the daily timeframe generates fewer signals. Stage transitions on daily bars occur less frequently than bar-by-bar detections on H4. A five-year test provides a statistically meaningful sample.
What to Expect
Stage transitions will be logged in the journal with the stage name and the time. Volume and RSI confirmations are logged for every breakout check, allowing you to see exactly why each signal was or was not accepted. Entries will be labeled on the chart in blue (Stage 2) and red (Stage 4). Stage labels appear at each transition point.
The win rate will be modest—Weinstein designed this as a system where winners run significantly longer than losers. A win rate of 35 to 45 percent with a 3R average winner is a healthy outcome. The risk-reward multiple of 3.0 means that even winning only one trade in three produces a flat result; anything above that is a profitable expectancy.
Demonstration and Test Results
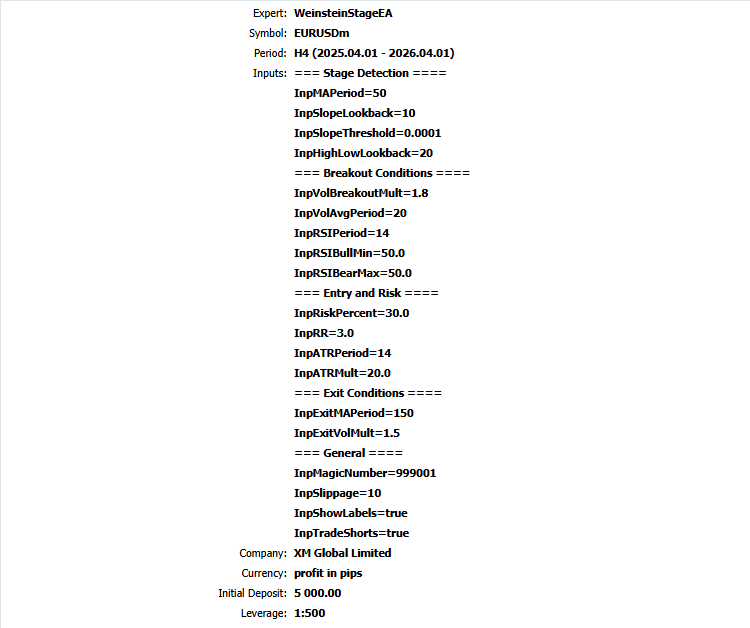
Fig. 2. Demonstration input parameters
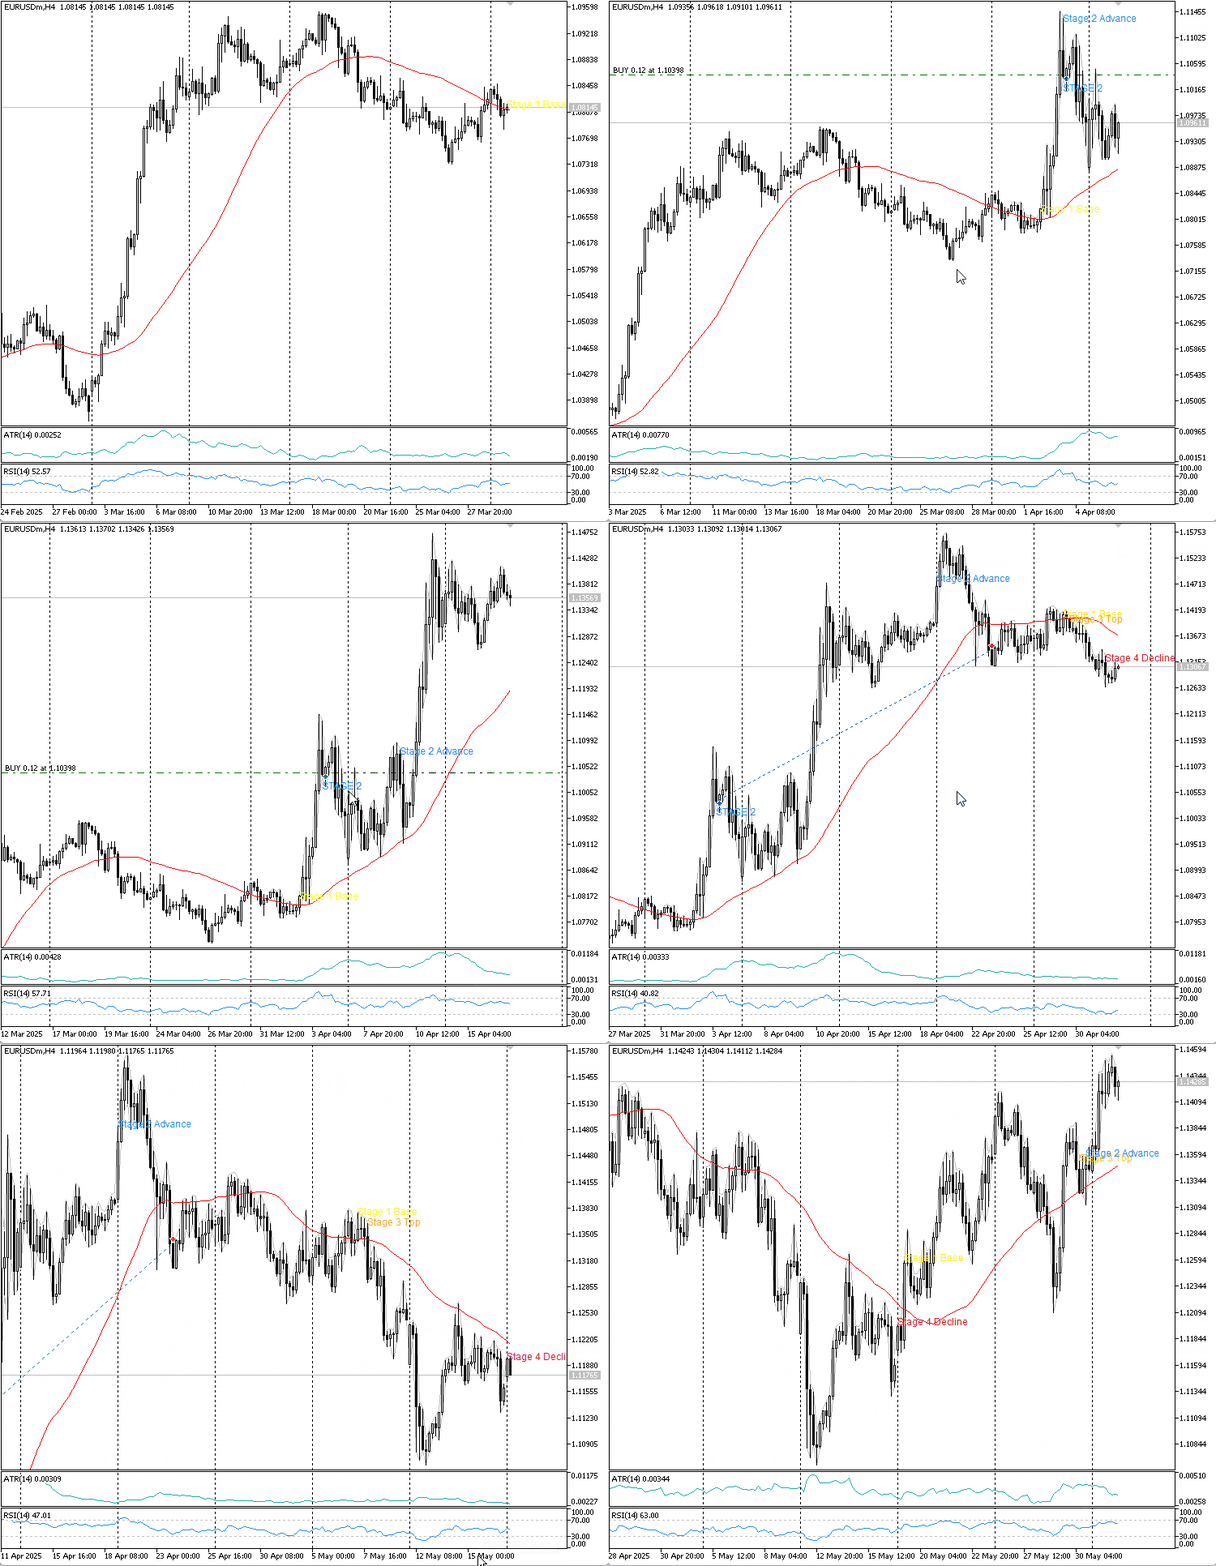
Fig. 3. Demonstration
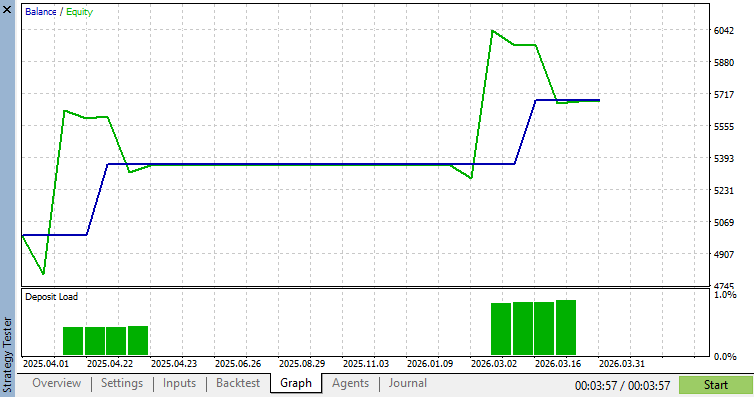
Fig. 4. Balance and equity graph
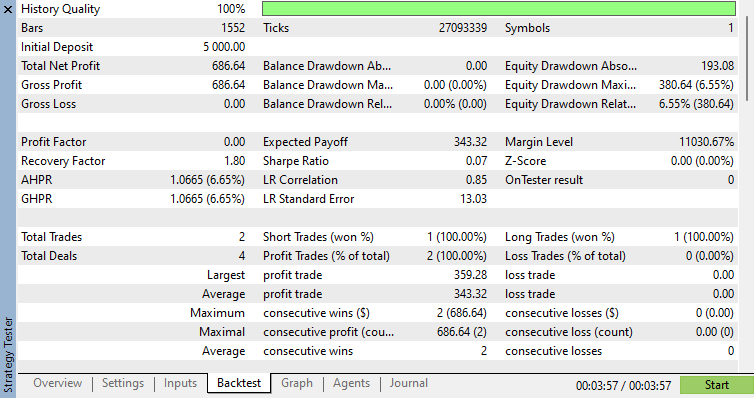
Fig. 5. Test results
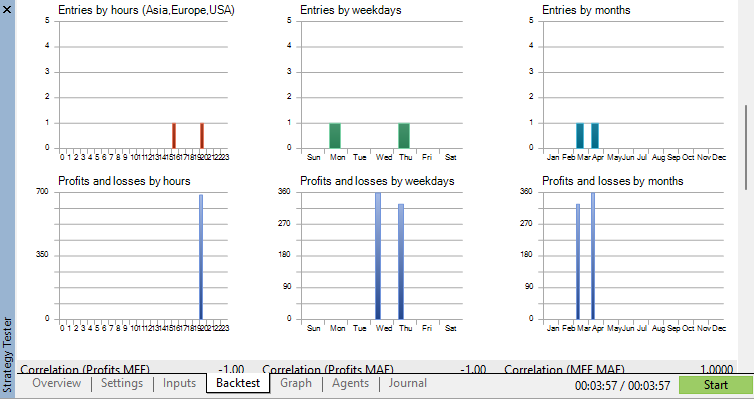
Fig. 6. Test results—entries
Known Limitations
The 150-period daily MA requires a substantial data history before producing reliable readings. In the tester, confirm that the EA has at least 300 bars of history before the test start date. The first 150 bars are consumed by the MA calculation itself.
The stage classification can flip between stages within a short time period during choppy market conditions. The slope threshold "InpSlopeThreshold" is the primary control for this. If the log shows frequent stage changes within a few bars, increase the threshold to require a more decisive slope before changing stage classification.
The method was designed for stocks with real exchange volume. On Forex pairs, tick volume is the proxy. The volume confirmation threshold may need adjustment per broker and per symbol. Run initial tests and observe the volume log output before drawing performance conclusions.
This EA enters only on the first stage transition it detects. It does not re-enter after a trade is closed unless a new stage transition occurs. This means that if a Stage 2 advance is interrupted by a brief Stage 3 signal and then resumes, the EA will re-enter on the new Stage 1 to Stage 2 transition only if one forms. This is intentional and conservative.
The exit based on MA breach with volume is one of several valid Weinstein exit approaches. He also described exits at the 30-week MA during strong Stage 2 advances as inappropriate—the stock should be held through normal pullbacks. The volume requirement on the exit attempts to enforce this distinction, but it is imperfect on daily bar data.
Conclusion
Stan Weinstein's core insight is deceptively simple: most markets spend most of their time in Stage 1, Stage 3, or transitioning between stages. Stage 2 and Stage 4 are the only phases where price moves in a sustained, directional way. Trading in any other stage is fighting the structure of the market rather than working with it.
The EA in this article enforces that discipline mechanically. It will not enter a Stage 2 long unless volume confirms the breakout and momentum supports the direction. Furthermore, it will not enter during Stage 1, Stage 3, or Stage 4 for longs. Lastly, it exits when the first signs of stage deterioration appear—a close below the MA on meaningful volume—rather than waiting for the full Stage 3 formation.
What makes Stage Analysis different from a simple moving average crossover system is the multi-condition classification. The MA alone does not determine the stage. The slope of the MA, the position of price relative to the MA, the pattern of highs and lows, and the volume behavior at transitions all contribute to the classification. A moving average crossover system enters whenever price crosses the MA. This EA enters only when all the structural conditions Weinstein specified are present simultaneously.
All code was compiled and tested in MetaTrader 5. The complete "WeinsteinStageEA.mq5" source file is attached to this article. Copy to "MQL5\Experts\" and compile in MetaEditor with no additional dependencies. Recommended for EURUSD on the daily timeframe. Always test on a demo account before live deployment.
Warning: All rights to these materials are reserved by MetaQuotes Ltd. Copying or reprinting of these materials in whole or in part is prohibited.
This article was written by a user of the site and reflects their personal views. MetaQuotes Ltd is not responsible for the accuracy of the information presented, nor for any consequences resulting from the use of the solutions, strategies or recommendations described.

 Low-Frequency Quantitative Strategies in MetaTrader 5 (Part 4): A Volatility-Adjusted Momentum-Based Intraday System
 Feature Engineering for ML (Part 10): Structural Break Tests in MQL5
 CSV Data Analysis (Part 6): Multi-Broker Result Normalization and Cross-Platform CSV Reconciliation
 Training a nonlinear U-Transformer on the residuals of a linear autoregressive model

- Free trading apps
- Over 8,000 signals for copying
- Economic news for exploring financial markets
You agree to website policy and terms of use