

Detecting and Visualizing Outlier Bars in MQL5 Using Modified Z-Score on OHLCV Features
 1 180
1 180
 0
0

Introduction
Every price series contains bars that do not belong to the ordinary distribution of market behavior. A central bank rate decision can produce a candlestick whose body is ten times the median session range. A liquidity gap at a weekend open can generate a wick that dwarfs anything seen in the preceding hundred bars. A broker feed anomaly can inject a tick volume observation so large it renders the surrounding data invisible on a chart scale.
These bars are outliers. They are not necessarily erroneous — many represent genuine, economically significant events. But their presence inside the fixed lookback window used by common indicators creates a statistical contamination problem that is rarely discussed in quantitative trading literature.
This article presents the engineering design and implementation of a native MQL5 indicator for detecting abnormal price bars using the Modified Z-Score. The indicator analyzes four bar features: body size, upper wick, lower wick, and tick volume. It computes a composite outlier score for each bar, marks anomalies on the chart, and plots the score as a histogram in a dedicated subwindow.
Why Outliers Matter
The arithmetic mean is a non-robust estimator. A single observation at ten times the typical range shifts the mean substantially toward itself. Standard deviation is equally sensitive: because it squares deviations before averaging, a single extreme value dominates the sum. Most classical technical indicators are built on exactly these two quantities.
Consider the Average True Range computed over a 14-bar lookback. If one bar in that window carries a true range of 500 pips on an instrument that normally moves 30 pips per bar, the ATR for the next 14 bars will be inflated by a factor of roughly four. Stop-loss distances derived from ATR during this window are correspondingly distorted. Bollinger Bands, which use a rolling standard deviation, exhibit the same pathology. Moving averages weighted uniformly across their lookback assign equal weight to the outlier bar and all normal bars, pulling the average toward an unrepresentative value. Standard deviation channels, volatility regime detectors, and mean-reversion signals are all vulnerable.
Outliers have distinct causes. News events often increase both body size and tick volume; liquidity gaps typically create large bodies with small wicks; feed anomalies may produce extreme wicks with small bodies. None of these phenomena is inherently a data error. The statistical problem is that they inflate scale estimates derived from the affected lookback window, distorting every indicator that relies on those estimates.
Mathematical Foundation
Feature Engineering
Four measurable characteristics of each bar capture distinct forms of abnormal behavior.
| Feature | Formula |
|---|---|
| Body | |Close − Open| |
| Upper Wick | High − max(Open, Close) |
| Lower Wick | min(Open, Close) − Low |
| Tick Volume | Tick Volume |
Body size captures directional volatility. Upper wick captures upward rejection. Lower wick captures downward rejection. Tick volume captures transaction density. Each measures a structurally different dimension — a news spike may be extreme on body size and tick volume but have ordinary wicks, while a flash spike may be extreme on both wick dimensions but have a small body and normal volume.
The Median as a Robust Location Estimator
The median of a sample X is the value that divides the sorted distribution in half. Its critical property is its breakdown point of 50%: up to half the observations in a sample can be replaced by arbitrarily extreme values without moving the median beyond the range of the remaining data. The arithmetic mean has a breakdown point of 0% — a single observation at infinity moves it to infinity.
Median Absolute Deviation
The Median Absolute Deviation is the median of the absolute deviations from the sample median:
MAD = Median( |xᵢ - Median(X)| )
The MAD is the robust analogue of the standard deviation. Like the median, it has a 50% breakdown point. The standard deviation, in contrast, is highly sensitive to outliers precisely because those outliers are the quantities it is intended to detect.
The Modified Z-Score
The Modified Z-Score transforms each observation into a standardized deviation from the robust center, normalized by the robust scale:
Mᵢ = 0.6745 × (xᵢ − Median(X)) / MAD
The constant 0.6745 is the reciprocal of the 75th percentile of the standard normal distribution (Φ⁻¹(0.75) ≈ 0.6745). Its presence ensures that when the underlying distribution is genuinely normal and contains no outliers, the Modified Z-Score has the same expected scale as the classical Z-Score, making the classical threshold values directly applicable.
Composite Outlier Score
Four Modified Z-Scores are computed per bar — one for each feature. These are combined into a single composite score using the mean absolute value:
Composite = (|M_body| + |M_upper| + |M_lower| + |M_volume|) / 4
Absolute values are taken before averaging because the sign of a Modified Z-Score indicates direction (above or below the median), not magnitude of abnormality. Averaging rather than taking the maximum means that a bar must be elevated across multiple features to produce a high composite score, reducing false positives from single-feature instrument-specific artefacts.
Threshold Interpretation
| Threshold | Interpretation |
|---|---|
| 2.5 | Sensitive — flags mild anomalies |
| 3.5 | Classical robust threshold |
| 5.0 | Conservative — flags only severe outliers |
No threshold is universally optimal. The implementation exposes both a mild and a strong threshold as input parameters, marking bars in different colors depending on which threshold they exceed.
Statistical Components
| Quantity | Meaning |
|---|---|
| Median | Robust center of the rolling distribution |
| MAD | Robust dispersion of the rolling distribution |
| Modified Z-Score | Normalized deviation of a single observation |
| Composite Score | Aggregated anomaly measure across all four features |
Computational Complexity
| Component | Complexity |
|---|---|
| Median calculation | O(N log N) |
| MAD calculation | O(N log N) |
| Feature extraction | O(N) |
| Composite score | O(N) |
| Rendering | O(N) |
The dominant cost is the sorting required by the median and MAD calculations. For a rolling window of N = 200 bars, approximately 1,530 comparisons per feature channel are required per bar update. This is negligible for an indicator processing one bar at a time.
Program Architecture
The implementation is divided across eight source files. Each module encapsulates a single analytical responsibility.
| # | Name | Type | Description |
|---|---|---|---|
| 1 | FeatureExtractor.mqh | Include File | Computes body, upper wick, lower wick, and tick volume for each bar in the rolling window. |
| 2 | MedianCalculator.mqh | Include File | Computes the rolling median of a feature array by sorting a working copy and selecting the middle element. |
| 3 | MADCalculator.mqh | Include File | Computes the Median Absolute Deviation given a feature array and its pre-computed median. |
| 4 | ModifiedZScore.mqh | Include File | Applies the Modified Z-Score formula to every element of a feature array using the 0.6745 normalization constant. |
| 5 | CompositeScore.mqh | Include File | Aggregates four per-feature Modified Z-Score arrays into a single mean absolute composite score per bar. |
| 6 | OutlierRenderer.mqh | Include File | Places arrow and rectangle chart objects on bars whose composite score exceeds the configured thresholds. |
| 7 | OutlierStatistics.mqh | Include File | Prints a structured diagnostic report to the MetaTrader 5 Experts tab after each calculation pass. |
| 8 | OutlierDetector.mq5 | Indicator | Main event handlers that orchestrate the full pipeline and manage the histogram subwindow. |
Module 1 — CFeatureExtractor
CFeatureExtractor computes the four bar characteristics that serve as inputs to the statistical pipeline. It converts raw OHLCV arrays into four parallel feature arrays indexed by bar position within the rolling window.
Class Declaration
//+------------------------------------------------------------------+
//|                                         FeatureExtractor.mqh     |
//|                      OHLCV Feature Outlier Detection Engine      |
//+------------------------------------------------------------------+
#ifndef FEATURE_EXTRACTOR_MQH
#define FEATURE_EXTRACTOR_MQH

//+------------------------------------------------------------------+
//| Feature Extractor Class                                          |
//+------------------------------------------------------------------+
class CFeatureExtractor
  {
private:
   double             m_body[];
   double             m_upper_wick[];
   double             m_lower_wick[];
   double             m_volume[];
   int                m_count;

public:
                     CFeatureExtractor(void);
                    ~CFeatureExtractor(void);
   bool               Extract(const double &open[],
                              const double &high[],
                              const double &low[],
                              const double &close[],
                              const long   &tick_volume[],
                              int           count);
   int                GetCount(void) const;
   double             GetBody(int index) const;
   double             GetUpperWick(int index) const;
   double             GetLowerWick(int index) const;
   double             GetVolume(int index) const;
  };
The class owns four private double arrays — m_body, m_upper_wick, m_lower_wick, and m_volume — and an integer m_count that records how many bars were processed. Each array is indexed in parallel: index i in all four arrays corresponds to the same bar. The public interface exposes a single computation method Extract() and four indexed accessors that downstream modules call to retrieve individual feature values.
Constructor and Destructor
//+------------------------------------------------------------------+
//| Constructor                                                      |
//+------------------------------------------------------------------+
CFeatureExtractor::CFeatureExtractor(void)
   : m_count(0)
  {
  }

//+------------------------------------------------------------------+
//| Destructor                                                       |
//+------------------------------------------------------------------+
CFeatureExtractor::~CFeatureExtractor(void)
  {
   ArrayFree(m_body);
   ArrayFree(m_upper_wick);
   ArrayFree(m_lower_wick);
   ArrayFree(m_volume);
  }
The constructor initializes m_count to zero. The destructor explicitly releases all four feature arrays. ArrayFree() is safe to call on arrays that have never been resized, so no guard conditions are needed.
Extract
//+------------------------------------------------------------------+
//| Extract OHLCV features for all bars in the window                |
//+------------------------------------------------------------------+
bool CFeatureExtractor::Extract(const double &open[],
                                const double &high[],
                                const double &low[],
                                const double &close[],
                                const long   &tick_volume[],
                                int           count)
  {
   m_count = count;

   if(m_count <= 0)
      return(false);

   ArrayResize(m_body,       m_count);
   ArrayResize(m_upper_wick, m_count);
   ArrayResize(m_lower_wick, m_count);
   ArrayResize(m_volume,     m_count);

   for(int i = 0; i < m_count; i++)
     {
      double o = open[i];
      double h = high[i];
      double l = low[i];
      double c = close[i];

      m_body[i]       = MathAbs(c - o);                     // Body size
      m_upper_wick[i] = h - MathMax(o, c);                  // Upper wick
      m_lower_wick[i] = MathMin(o, c) - l;                  // Lower wick
      m_volume[i]     = (double)tick_volume[i];                // Tick volume
     }

   return(true);
  }
Extract() receives the standard OHLCV arrays passed by reference from OnCalculate() and iterates once across all count bars. For each bar at index i, it computes the four feature values using the geometric formulas defined in the mathematical foundation section.
The body formula MathAbs(c - o) captures directional volatility without regard to bar direction. The upper wick formula h - MathMax(o, c) correctly handles both bullish and bearish bars: for a bullish bar where c > o, MathMax(o, c) returns c, so the upper wick extends from close to high. For a bearish bar where o > c, MathMax(o, c) returns o, so the upper wick extends from open to high. The lower wick formula MathMin(o, c) - l applies the same logic symmetrically. Tick volume is cast from long to double for arithmetic consistency with the floating-point statistical pipeline downstream.
Accessor Methods
//+------------------------------------------------------------------+
//| Get total processed elements count                               |
//+------------------------------------------------------------------+
int CFeatureExtractor::GetCount(void) const
  {
   return(m_count);
  }

//+------------------------------------------------------------------+
//| Get body size at specified index                                 |
//+------------------------------------------------------------------+
double CFeatureExtractor::GetBody(int index) const
  {
   return(m_body[index]);
  }

//+------------------------------------------------------------------+
//| Get upper wick size at specified index                           |
//+------------------------------------------------------------------+
double CFeatureExtractor::GetUpperWick(int index) const
  {
   return(m_upper_wick[index]);
  }

//+------------------------------------------------------------------+
//| Get lower wick size at specified index                           |
//+------------------------------------------------------------------+
double CFeatureExtractor::GetLowerWick(int index) const
  {
   return(m_lower_wick[index]);
  }

//+------------------------------------------------------------------+
//| Get tick volume at specified index                               |
//+------------------------------------------------------------------+
double CFeatureExtractor::GetVolume(int index) const
  {
   return(m_volume[index]);
  }

#endif // FEATURE_EXTRACTOR_MQH
GetCount() returns the number of bars processed in the most recent Extract() call. GetBody(), GetUpperWick(), GetLowerWick(), and GetVolume() provide indexed access to the four feature arrays. These accessors are used by CMedianCalculator and CMADCalculator to retrieve individual feature values during the statistical computation phase. Note that no bounds checking is applied — callers are expected to use indices in the range [0, GetCount() - 1].
Module 2 — CMedianCalculator
CMedianCalculator sorts a copy of a feature array and returns the median value for the window. It operates on any double array of arbitrary length, making it reusable across all four feature channels.
Class Declaration
//+------------------------------------------------------------------+
//|                                           MedianCalculator.mqh   |
//+------------------------------------------------------------------+
#ifndef MEDIAN_CALCULATOR_MQH
#define MEDIAN_CALCULATOR_MQH

//+------------------------------------------------------------------+
//| Median Calculator Class                                          |
//+------------------------------------------------------------------+
class CMedianCalculator
  {
private:
   double             m_sorted[];

public:
                     CMedianCalculator(void);
                    ~CMedianCalculator(void);
   double             Calculate(const double &values[], int count);
  };
The class owns a single private array m_sorted[] used as a working buffer for the sort operation. Reusing this buffer across calls avoids repeated heap allocations. The public interface exposes only one method, Calculate(), which accepts a const reference to the input array and its length.
Constructor and Destructor
//+------------------------------------------------------------------+
//| Constructor                                                      |
//+------------------------------------------------------------------+
CMedianCalculator::CMedianCalculator(void)
  {
  }

//+------------------------------------------------------------------+
//| Destructor                                                       |
//+------------------------------------------------------------------+
CMedianCalculator::~CMedianCalculator(void)
  {
   ArrayFree(m_sorted);
  }
The constructor has no initialization work. The destructor releases the internal sorted buffer. Because m_sorted is resized on demand inside Calculate(), the destructor must free it explicitly to release the buffer.
Calculate
//+------------------------------------------------------------------+
//| Calculate Median                                                 |
//+------------------------------------------------------------------+
double CMedianCalculator::Calculate(const double &values[], int count)
  {
   if(count <= 0)
      return(0.0);

//--- Copy to working array to avoid modifying the original
   ArrayResize(m_sorted, count);
   ArrayCopy(m_sorted, values, 0, 0, count);

//--- Sort ascending
   ArraySort(m_sorted);

//--- Return middle value for odd count; average of two middle values for even
   if(count % 2 == 1)
      return(m_sorted[count / 2]);

   return((m_sorted[count / 2 - 1] + m_sorted[count / 2]) * 0.5);
  }

#endif // MEDIAN_CALCULATOR_MQH
Calculate() receives a const reference to the feature array and its length. It copies the input into m_sorted before sorting — this is essential because ArraySort() modifies the array in place, and the original feature array must remain in its original bar-indexed order for the MAD calculation and Z-Score computation that follow. Sorting a copy preserves the correspondence between array index and bar position.
After sorting, the median is selected by index. For an odd count N, the median is at zero-based index N/2. For an even count N, the median is the average of the values at indices N/2 - 1 and N/2. The averaging uses multiplication by 0.5 rather than division by 2 to keep floating-point arithmetic explicit. The complexity is O(N log N) due to ArraySort(), which implements a comparison-based sort.
Module 3 — CMADCalculator
CMADCalculator computes the Median Absolute Deviation given a feature array and its pre-computed median. It reuses CMedianCalculator internally for the second-level median operation.
Class Declaration
//+------------------------------------------------------------------+
//|                                              MADCalculator.mqh   |
//+------------------------------------------------------------------+
#ifndef MAD_CALCULATOR_MQH
#define MAD_CALCULATOR_MQH

#include "MedianCalculator.mqh"

//+------------------------------------------------------------------+
//| MAD Calculator Class                                             |
//+------------------------------------------------------------------+
class CMADCalculator
  {
private:
   double             m_deviations[];
   CMedianCalculator  m_median_calc;

public:
                     CMADCalculator(void);
                    ~CMADCalculator(void);
   double             Calculate(const double &values[],
                                int count,
                                double median_value);
  };
The class owns two private members: m_deviations[], a working buffer for the absolute deviation values, and m_median_calc, an embedded CMedianCalculator instance that computes the median of those deviations. The MAD is a two-pass statistic — it requires the median first, then applies the median operator again to the absolute deviations — and the embedded instance handles the second pass without requiring an externally supplied calculator.
Constructor and Destructor
//+------------------------------------------------------------------+
//| Constructor                                                      |
//+------------------------------------------------------------------+
CMADCalculator::CMADCalculator(void)
  {
  }

//+------------------------------------------------------------------+
//| Destructor                                                       |
//+------------------------------------------------------------------+
CMADCalculator::~CMADCalculator(void)
  {
   ArrayFree(m_deviations);
  }
The constructor has no initialization work. The destructor releases m_deviations[]. The embedded m_median_calc instance manages its own memory through its own destructor, so no explicit cleanup is needed for it here.
Calculate
//+------------------------------------------------------------------+
//| Calculate Median Absolute Deviation                              |
//+------------------------------------------------------------------+
double CMADCalculator::Calculate(const double &values[],
                                 int count,
                                 double median_value)
  {
   if(count <= 0)
      return(0.0);

//--- Build absolute deviation array
   ArrayResize(m_deviations, count);

   for(int i = 0; i < count; i++)
      m_deviations[i] = MathAbs(values[i] - median_value); // Absolute deviation

//--- Return the median of absolute deviations
   return(m_median_calc.Calculate(m_deviations, count));
  }

#endif // MAD_CALCULATOR_MQH
Calculate() receives the original feature array, its length, and the pre-computed median value. It builds the absolute deviation array in a single O(N) pass: for each index i, it computes |values[i] - median_value| and stores it in m_deviations[i]. Passing median_value as a parameter rather than recomputing it saves one O(N log N) sort per feature channel per bar.
The method then passes m_deviations to m_median_calc.Calculate(), which sorts the deviations and returns their median. The result is the MAD. The MAD inherits the 50% breakdown point of the median: up to half the deviation values can be arbitrarily large without distorting the MAD beyond the range of the remaining data.
Module 4 — CModifiedZScore
CModifiedZScore applies the standardization formula to every observation in a feature array, producing a normalized score that is comparable across instruments and timeframes.
Class Declaration
//+------------------------------------------------------------------+
//|                                              ModifiedZScore.mqh  |
//+------------------------------------------------------------------+
#ifndef MODIFIED_Z_SCORE_MQH
#define MODIFIED_Z_SCORE_MQH

//+------------------------------------------------------------------+
//| Modified Z-Score Calculator Class                                |
//+------------------------------------------------------------------+
class CModifiedZScore
  {
private:
   static const double K_CONSTANT; // 0.6745

public:
                     CModifiedZScore(void);
                    ~CModifiedZScore(void);
   bool               Calculate(const double &values[],
                                int count,
                                double median_value,
                                double mad_value,
                                double &scores[]);
  };

//--- Normalization constant: reciprocal of Phi^{-1}(0.75) for standard normal
const double CModifiedZScore::K_CONSTANT = 0.6745;
The class owns a single private static constant K_CONSTANT set to 0.6745. Declaring it as static const ensures it exists once for the entire class rather than per instance, and prevents any accidental modification. The public interface exposes one method Calculate(), which writes its results into an output array passed by reference.
Constructor and Destructor
//+------------------------------------------------------------------+
//| Constructor                                                      |
//+------------------------------------------------------------------+
CModifiedZScore::CModifiedZScore(void)
  {
  }

//+------------------------------------------------------------------+
//| Destructor                                                       |
//+------------------------------------------------------------------+
CModifiedZScore::~CModifiedZScore(void)
  {
  }
The constructor and destructor are both empty. The class allocates no heap memory — the output array scores[] is owned by the caller and passed by reference.
Calculate
//+------------------------------------------------------------------+
//| Calculate Modified Z-Scores for all observations                 |
//+------------------------------------------------------------------+
bool CModifiedZScore::Calculate(const double &values[],
                                int count,
                                double median_value,
                                double mad_value,
                                double &scores[])
  {
   if(count <= 0)
      return(false);

//--- Guard against zero MAD which would produce division by zero
   if(mad_value <= DBL_EPSILON)
     {
      ArrayResize(scores, count);
      ArrayInitialize(scores, 0.0);
      return(false);
     }

   ArrayResize(scores, count);

   for(int i = 0; i < count; i++)
      scores[i] = K_CONSTANT * (values[i] - median_value) / mad_value; // Modified Z-Score

   return(true);
  }

#endif // MODIFIED_Z_SCORE_MQH
Calculate() applies the formula Mᵢ = 0.6745 × (xᵢ − Median) / MAD to every element of values[] and writes the result into scores[]. The caller is responsible for allocating scores[] — Calculate() resizes it to count elements internally.
The guard mad_value <= DBL_EPSILON handles the degenerate case where all values in the rolling window are identical, producing a MAD of zero. Division by zero would produce undefined or infinite scores. When this condition is detected, the method fills scores[] with zeros and returns false. Callers check the return value and treat the feature as non-informative for that window. This situation can arise for tick volume on instruments during market closure periods.
The constant 0.6745 is the key to comparability with classical Z-Scores. For a normal distribution, MAD / σ = Φ⁻¹(0.75) ≈ 0.6745, so σ = MAD / 0.6745. Substituting into the Z-Score formula yields the Modified Z-Score formula with the 0.6745 factor, ensuring that threshold values designed for classical Z-Scores apply directly.
Module 5 — CCompositeScore
CCompositeScore aggregates the four per-feature Modified Z-Score arrays into a single scalar score per bar, and provides a utility method to count how many bars exceed a given threshold.
Class Declaration
//+------------------------------------------------------------------+
//|                                           CompositeScore.mqh     |
//+------------------------------------------------------------------+
#ifndef COMPOSITE_SCORE_MQH
#define COMPOSITE_SCORE_MQH

//+------------------------------------------------------------------+
//| Composite Score Class                                            |
//+------------------------------------------------------------------+
class CCompositeScore
  {
public:
                      CCompositeScore(void);
                     ~CCompositeScore(void);
   bool               Calculate(const double &body_scores[],
                                const double &upper_scores[],
                                const double &lower_scores[],
                                const double &volume_scores[],
                                int count,
                                double &composite[]);
   int                CountOutliers(const double &composite[],
                                    int count,
                                    double threshold);
  };
The class has no private fields — all data is consumed from the four input arrays passed by const reference and the results are written into the output array composite[] passed by reference. CountOutliers() is a utility that operates on the completed composite array and returns the number of bars whose score exceeds a threshold.
Constructor and Destructor
//+------------------------------------------------------------------+
//| Constructor                                                      |
//+------------------------------------------------------------------+
CCompositeScore::CCompositeScore(void)
  {
  }

//+------------------------------------------------------------------+
//| Destructor                                                       |
//+------------------------------------------------------------------+
CCompositeScore::~CCompositeScore(void)
  {
  }
Both are empty. The class allocates no heap memory. The output array is owned by the caller.
Calculate
//+------------------------------------------------------------------+
//| Compute mean absolute composite score across four features       |
//+------------------------------------------------------------------+
bool CCompositeScore::Calculate(const double &body_scores[],
                                const double &upper_scores[],
                                const double &lower_scores[],
                                const double &volume_scores[],
                                int count,
                                double &composite[])
  {
   if(count <= 0)
      return(false);

   ArrayResize(composite, count);

   for(int i = 0; i < count; i++)
     {
      double sum = MathAbs(body_scores[i])     // Body contribution
                   + MathAbs(upper_scores[i])  // Upper wick contribution
                   + MathAbs(lower_scores[i])  // Lower wick contribution
                   + MathAbs(volume_scores[i]);// Volume contribution

      composite[i] = sum * 0.25;               // Mean absolute score
     }

   return(true);
  }
Calculate() iterates once across all count elements and computes the mean absolute Modified Z-Score for each bar. Absolute values are taken before summing because the sign of a Modified Z-Score indicates direction relative to the median — a bar with a body size ten times the median produces a large positive body score, while a bar with a body size near zero produces a large negative body score. Both are equally abnormal. Taking absolute values ensures both directions contribute symmetrically.
Multiplying the sum by 0.25 is equivalent to dividing by four and produces the arithmetic mean of the four absolute scores. A bar that is extreme on only one feature contributes one quarter of that feature's score to the composite, requiring multi-dimensional elevation for a high aggregate. This averaging behavior is what distinguishes the composite score from a simple maximum — a bar with an extreme tick volume but ordinary price geometry will produce a lower composite score than a bar that is simultaneously extreme on body, wick, and volume.
CountOutliers
//+------------------------------------------------------------------+
//| Count bars whose composite score exceeds the threshold           |
//+------------------------------------------------------------------+
int CCompositeScore::CountOutliers(const double &composite[],
                                   int count,
                                   double threshold)
  {
   int outlier_count = 0;

   for(int i = 0; i < count; i++)
     {
      if(composite[i] > threshold)
         outlier_count++; // Increment outlier counter
     }

   return(outlier_count);
  }

#endif // COMPOSITE_SCORE_MQH
CountOutliers() makes a single O(N) pass across the composite array and counts how many elements exceed the threshold. It is called from OnCalculate() after the composite buffer has been populated, with count set to the length of the current rolling window rather than the full chart history. This scoping ensures the count reflects the current statistical context — the same window over which the median and MAD were computed — rather than an accumulation across the full chart lifetime.
Module 6 — COutlierRenderer
COutlierRenderer translates the composite score array into visible chart objects. It places a downward arrow above each flagged bar and draws a dashed rectangle spanning the bar's full high-to-low range. Bars between the mild and strong thresholds receive markers in the mild color; bars above the strong threshold receive markers in the strong color.
Class Declaration
//+------------------------------------------------------------------+ //| OutlierRenderer.mqh | //+------------------------------------------------------------------+ #ifndef OUTLIER_RENDERER_MQH #define OUTLIER_RENDERER_MQH //+------------------------------------------------------------------+ //| Outlier Renderer Class | //+------------------------------------------------------------------+ class COutlierRenderer { private: string m_prefix; color m_mild_color; color m_strong_color; double m_mild_threshold; double m_strong_threshold; public: COutlierRenderer(void); ~COutlierRenderer(void); void Configure(string prefix, color mild_color, color strong_color, double mild_threshold, double strong_threshold); void RemoveObjects(void); void Render(const double &composite[], const datetime ×[], const double &high[], const double &low[], int count); private: void DrawArrow(string name, datetime bar_time, double price, color arrow_color, int arrow_code); void DrawBox(string name, datetime bar_time, double bar_high, double bar_low, color box_color); };
The class owns five private fields: m_prefix is prepended to all chart object names for deterministic cleanup, m_mild_color and m_strong_color are the two marker colors, and m_mild_threshold and m_strong_threshold are the score boundaries that determine which color is applied. The two private methods DrawArrow() and DrawBox() handle the creation of individual chart objects.
Constructor and Destructor
//+------------------------------------------------------------------+
//| Constructor                                                      |
//+------------------------------------------------------------------+
COutlierRenderer::COutlierRenderer(void) : m_prefix("OD_"),
                                           m_mild_color(clrOrange),
                                           m_strong_color(clrRed),
                                           m_mild_threshold(2.5),
                                           m_strong_threshold(3.5)
  {
  }

//+------------------------------------------------------------------+
//| Destructor                                                       |
//+------------------------------------------------------------------+
COutlierRenderer::~COutlierRenderer(void)
  {
  }
The constructor sets sensible defaults for all visual parameters so the renderer works immediately without requiring an explicit Configure() call. The destructor is empty because chart objects are owned by the MetaTrader 5 terminal, not by this class — cleanup is handled explicitly through RemoveObjects().
Configure
//+------------------------------------------------------------------+
//| Configure renderer parameters                                    |
//+------------------------------------------------------------------+
void COutlierRenderer::Configure(string prefix,
                                 color mild_color,
                                 color strong_color,
                                 double mild_threshold,
                                 double strong_threshold)
  {
   m_prefix           = prefix;
   m_mild_color       = mild_color;
   m_strong_color     = strong_color;
   m_mild_threshold   = mild_threshold;
   m_strong_threshold = strong_threshold;
  }
Configure() transfers user-supplied input parameters from the main indicator file into the renderer's private fields. It is called once from OnInit(). Separating configuration from construction allows the renderer to be reconfigured without recreation if the user changes input parameters.
RemoveObjects
//+------------------------------------------------------------------+
//| Remove all objects created by this renderer                      |
//+------------------------------------------------------------------+
void COutlierRenderer::RemoveObjects(void)
  {
   long chart_id = ChartID();
   int  total    = ObjectsTotal(chart_id, 0, -1);

   for(int i = total - 1; i >= 0; i--)
     {
      string name = ObjectName(chart_id, i, 0, -1);
      if(StringFind(name, m_prefix) == 0)
         ObjectDelete(chart_id, name);
     }
  }
RemoveObjects() scans all chart objects in reverse index order and deletes any whose name begins with m_prefix. Iterate in reverse because ObjectDelete() immediately reduces ObjectsTotal(). Forward iteration would skip objects after deletions. The prefix convention ensures only objects owned by this renderer instance are affected, leaving objects created by other indicators untouched. This method is called before each full re-render pass and in OnDeinit().
Render
//+------------------------------------------------------------------+ //| Render markers for all detected outlier bars | //+------------------------------------------------------------------+ void COutlierRenderer::Render(const double &composite[], const datetime ×[], const double &high[], const double &low[], int count) { for(int i = 0; i < count; i++) { double score = composite[i]; if(score <= m_mild_threshold) continue; bool is_strong = (score > m_strong_threshold); color mark_color = (is_strong ? m_strong_color : m_mild_color); string arrow_name = m_prefix + "ARR_" + IntegerToString(i); string box_name = m_prefix + "BOX_" + IntegerToString(i); //--- Draw arrow above the bar's high DrawArrow(arrow_name, times[i], high[i], mark_color, 234); // Down arrow pointing at the bar //--- Draw bounding box around the bar DrawBox(box_name, times[i], high[i], low[i], mark_color); } ChartRedraw(); }
Render() iterates across the full composite array and places two chart objects for every bar whose score exceeds m_mild_threshold. Bars below the mild threshold are skipped with continue, producing no chart objects. For bars above the threshold, the color is determined by comparing the score against m_strong_threshold. Object names follow the pattern "OD_ARR_N" and "OD_BOX_N" where N is the bar index, making each object uniquely identifiable for future updates or deletions. The final ChartRedraw() flushes all pending object changes to the display in a single operation.
DrawArrow
//+------------------------------------------------------------------+
//| Draw arrow marker at a specific bar                              |
//+------------------------------------------------------------------+
void COutlierRenderer::DrawArrow(string name,
                                 datetime bar_time,
                                 double price,
                                 color arrow_color,
                                 int arrow_code)
  {
   if(ObjectFind(ChartID(), name) < 0)
      ObjectCreate(ChartID(), name, OBJ_ARROW, 0, bar_time, price);

   ObjectSetInteger(ChartID(), name, OBJPROP_ARROWCODE,  arrow_code);
   ObjectSetInteger(ChartID(), name, OBJPROP_COLOR,      arrow_color);
   ObjectSetInteger(ChartID(), name, OBJPROP_WIDTH,      2);
   ObjectSetInteger(ChartID(), name, OBJPROP_SELECTABLE, false);
  }
DrawArrow() creates an OBJ_ARROW object anchored at bar_time and price (the bar's high). Arrow code 234 is a downward-pointing arrow, visually directing attention toward the flagged bar beneath it. The ObjectFind() guard prevents recreating an already-existing object during incremental updates — if the object exists, only its properties are updated. OBJPROP_SELECTABLE = false prevents the user from accidentally moving the marker by clicking on it.
DrawBox
//+------------------------------------------------------------------+
//| Draw rectangle box spanning the bar's high-low range             |
//+------------------------------------------------------------------+
void COutlierRenderer::DrawBox(string name,
                               datetime bar_time,
                               double bar_high,
                               double bar_low,
                               color box_color)
  {
   //--- Extend box one bar width to the right for visibility
   datetime box_end = bar_time + PeriodSeconds();

   if(ObjectFind(ChartID(), name) < 0)
      ObjectCreate(ChartID(), name, OBJ_RECTANGLE, 0,
                   bar_time, bar_high,
                   box_end,  bar_low);

   ObjectSetInteger(ChartID(), name, OBJPROP_COLOR,       box_color);
   ObjectSetInteger(ChartID(), name, OBJPROP_STYLE,       STYLE_DASH);
   ObjectSetInteger(ChartID(), name, OBJPROP_WIDTH,       1);
   ObjectSetInteger(ChartID(), name, OBJPROP_FILL,        false);
   ObjectSetInteger(ChartID(), name, OBJPROP_SELECTABLE,  false);
   ObjectSetInteger(ChartID(), name, OBJPROP_BACK,        true);
  }

#endif // OUTLIER_RENDERER_MQH
DrawBox() creates an OBJ_RECTANGLE spanning the full high-to-low range of the flagged bar. The right boundary is set to bar_time + PeriodSeconds(), which advances the box one bar period to the right of the bar's open time, giving the rectangle visible area at any chart zoom level. OBJPROP_FILL = false draws only the border rather than a filled rectangle, keeping the candlestick pattern beneath visible. OBJPROP_BACK = true renders the rectangle behind the price bars so it does not obscure the candlestick it is annotating.
Module 7 — COutlierStatistics
COutlierStatistics prints a structured diagnostic report to the MetaTrader Experts tab after each calculation pass, covering every stage of the pipeline in five lines.
Class Declaration, Constructor, Destructor, and Print
//+------------------------------------------------------------------+
//|                                           OutlierStatistics.mqh  |
//+------------------------------------------------------------------+
#ifndef OUTLIER_STATISTICS_MQH
#define OUTLIER_STATISTICS_MQH

//+------------------------------------------------------------------+
//| Outlier Statistics Class                                         |
//+------------------------------------------------------------------+
class COutlierStatistics
  {
public:
                     COutlierStatistics(void);
                    ~COutlierStatistics(void);
   void               Print(int window_size,
                            double median_body,
                            double mad_body,
                            double threshold,
                            int outlier_count);
  };

//+------------------------------------------------------------------+
//| Constructor                                                      |
//+------------------------------------------------------------------+
COutlierStatistics::COutlierStatistics(void)
  {
  }

//+------------------------------------------------------------------+
//| Destructor                                                       |
//+------------------------------------------------------------------+
COutlierStatistics::~COutlierStatistics(void)
  {
  }

//+------------------------------------------------------------------+
//| Print session diagnostic report to Experts tab                   |
//+------------------------------------------------------------------+
void COutlierStatistics::Print(int window_size,
                               double median_body,
                               double mad_body,
                               double threshold,
                               int outlier_count)
  {
   PrintFormat("Rolling Window      = %d bars", window_size);
   PrintFormat("Median Body Size    = %.5f",    median_body);
   PrintFormat("MAD Body Size       = %.5f",    mad_body);
   PrintFormat("Composite Threshold = %.2f",    threshold);
   PrintFormat("Detected Outliers   = %d",      outlier_count);
  }

#endif // OUTLIER_STATISTICS_MQH
//+------------------------------------------------------------------+
COutlierStatistics has no private fields and no heap allocations, so its constructor and destructor are both empty. The class exists solely to isolate the PrintFormat() calls from the main indicator file, making it possible to redirect, suppress, or extend diagnostic output without modifying any other module.
Print() is called once per new bar from OnCalculate(). It writes five lines to the Experts tab. The rolling window size confirms the lookback period in use. The median body size and MAD body size allow the user to verify that the rolling statistics are producing reasonable scale estimates for the instrument and timeframe. The composite threshold confirms which sensitivity level is active. The outlier count is scoped to the last rolling window only — not the full chart history — so it reflects the current statistical context. When the Experts tab shows plausible median and MAD values but an outlier count of zero, the instrument may have uniform behavior within the window and the threshold may need lowering. When the count seems high, the threshold may need raising.
Expected Experts tab output:
Rolling Window      = 200 bars
Median Body Size    = 0.00039
MAD Body Size       = 0.00028
Composite Threshold = 3.50
Detected Outliers   = 4
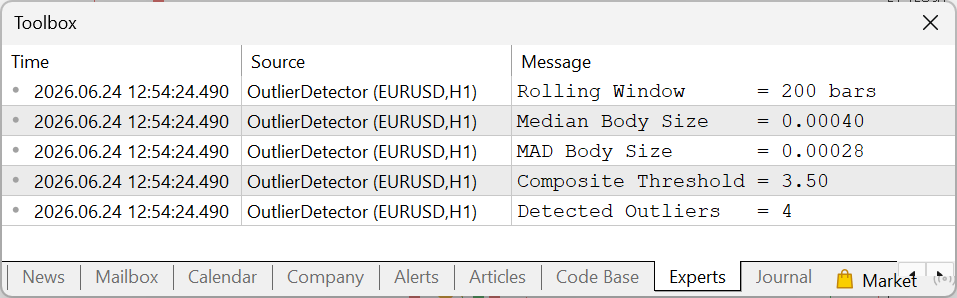
Fig. 1. Experts tab output showing rolling window statistics and detected outlier count for the last 200-bar window on EURUSD H1.
Module 8 — OutlierDetector.mq5
The main indicator file declares all inputs, instantiates the seven module objects as global variables, and orchestrates the complete pipeline through OnInit(), OnDeinit(), and OnCalculate().
Declarations and Inputs
//+------------------------------------------------------------------+
//|                                          OutlierDetector.mq5     |
//+------------------------------------------------------------------+

#property indicator_separate_window
#property indicator_buffers 2
#property indicator_plots   1

#property indicator_label1  "Composite Score"
#property indicator_type1   DRAW_HISTOGRAM
#property indicator_color1  clrDodgerBlue
#property indicator_width1  2

#include <Detecting_and_Visualizing_Outlier_Bars/FeatureExtractor.mqh>
#include <Detecting_and_Visualizing_Outlier_Bars/MedianCalculator.mqh>
#include <Detecting_and_Visualizing_Outlier_Bars/MADCalculator.mqh>
#include <Detecting_and_Visualizing_Outlier_Bars/ModifiedZScore.mqh>
#include <Detecting_and_Visualizing_Outlier_Bars/CompositeScore.mqh>
#include <Detecting_and_Visualizing_Outlier_Bars/OutlierRenderer.mqh>
#include <Detecting_and_Visualizing_Outlier_Bars/OutlierStatistics.mqh>

//--- Inputs
input int    InpWindow          = 200;        // Rolling window size (bars)
input int    InpBinSizePoints   = 10;         // Unused placeholder for consistency
input double InpMildThreshold   = 2.5;        // Mild anomaly threshold
input double InpStrongThreshold = 3.5;        // Strong anomaly threshold
input color  InpMildColor       = clrOrange;  // Mild outlier marker color
input color  InpStrongColor     = clrRed;     // Strong outlier marker color
input string InpPrefix          = "OD_";      // Object name prefix

//--- Indicator buffers
double             g_composite_buffer[];  // Histogram values (subwindow)
double             g_threshold_buffer[];  // Constant threshold line

//--- Global instances
CFeatureExtractor  g_extractor;
CMedianCalculator  g_median_calc;
CMADCalculator     g_mad_calc;
CModifiedZScore    g_zscore_calc;
CCompositeScore    g_composite_calc;
COutlierRenderer   g_renderer;
COutlierStatistics g_statistics;

//--- Track last processed bar to suppress tick-driven recalculation
int                g_last_bar = -1;
The #property indicator_separate_window directive opens a dedicated subwindow below the main chart. indicator_buffers 2 declares two data arrays: g_composite_buffer for the histogram and g_threshold_buffer for the threshold line. indicator_plots 1 declares one explicitly styled plot — the histogram. The threshold line is configured separately in OnInit() using PlotIndexSetInteger().
The #include chain lists the seven headers. MADCalculator.mqh includes MedianCalculator.mqh internally, so that dependency is resolved automatically. The global integer g_last_bar tracks the bar index of the last processed call and is the mechanism that suppresses tick-driven recalculation.
ComputeBarScore
//+------------------------------------------------------------------+
//| Compute composite score for a single bar index                   |
//+------------------------------------------------------------------+
double ComputeBarScore(int bar,
                       const double &open[],
                       const double &high[],
                       const double &low[],
                       const double &close[],
                       const long   &tick_volume[])
  {
   int window_start = bar - InpWindow + 1;

   double body_feat[];
   double upper_feat[];
   double lower_feat[];
   double vol_feat[];

   ArrayResize(body_feat,  InpWindow);
   ArrayResize(upper_feat, InpWindow);
   ArrayResize(lower_feat, InpWindow);
   ArrayResize(vol_feat,   InpWindow);

   for(int k = 0; k < InpWindow; k++)
     {
      int idx       = window_start + k;
      body_feat[k]  = MathAbs(close[idx] - open[idx]);
      upper_feat[k] = high[idx] - MathMax(open[idx], close[idx]);
      lower_feat[k] = MathMin(open[idx], close[idx]) - low[idx];
      vol_feat[k]   = (double)tick_volume[idx];
     }

//--- Compute rolling medians
   double med_body  = g_median_calc.Calculate(body_feat,  InpWindow);
   double med_upper = g_median_calc.Calculate(upper_feat, InpWindow);
   double med_lower = g_median_calc.Calculate(lower_feat, InpWindow);
   double med_vol   = g_median_calc.Calculate(vol_feat,   InpWindow);

//--- Compute MADs
   double mad_body  = g_mad_calc.Calculate(body_feat,  InpWindow, med_body);
   double mad_upper = g_mad_calc.Calculate(upper_feat, InpWindow, med_upper);
   double mad_lower = g_mad_calc.Calculate(lower_feat, InpWindow, med_lower);
   double mad_vol   = g_mad_calc.Calculate(vol_feat,   InpWindow, med_vol);

//--- Compute Modified Z-Scores
   double body_scores[];
   double upper_scores[];
   double lower_scores[];
   double vol_scores[];

   g_zscore_calc.Calculate(body_feat,  InpWindow, med_body,  mad_body,  body_scores);
   g_zscore_calc.Calculate(upper_feat, InpWindow, med_upper, mad_upper, upper_scores);
   g_zscore_calc.Calculate(lower_feat, InpWindow, med_lower, mad_lower, lower_scores);
   g_zscore_calc.Calculate(vol_feat,   InpWindow, med_vol,  mad_vol,  vol_scores);

//--- Compute composite scores for the window
   double composite[];
   g_composite_calc.Calculate(body_scores, upper_scores,
                              lower_scores, vol_scores,
                              InpWindow, composite);

//--- Return the score for the current bar (last element of the window)
   return(composite[InpWindow - 1]);
  }
ComputeBarScore() encapsulates the complete statistical pipeline for a single bar. It constructs four feature sub-arrays covering the InpWindow bars ending at bar, then passes each array through the four-stage chain: g_median_calc.Calculate() → g_mad_calc.Calculate() → g_zscore_calc.Calculate() → g_composite_calc.Calculate(). The function returns composite[InpWindow - 1], which is the Modified Z-Score composite for the target bar — the last element of the window whose rolling statistics were computed from all InpWindow bars including itself.
Extracting this logic into a named function rather than embedding it inline in the main loop makes OnCalculate() readable as a pure sequencer and makes the scoring logic independently understandable.
OnInit
//+------------------------------------------------------------------+
//| Indicator Initialization                                         |
//+------------------------------------------------------------------+
int OnInit(void)
  {
//--- Bind indicator buffers
   SetIndexBuffer(0, g_composite_buffer, INDICATOR_DATA);
   SetIndexBuffer(1, g_threshold_buffer, INDICATOR_DATA);

//--- Configure the threshold line appearance
   PlotIndexSetInteger(1, PLOT_DRAW_TYPE,  DRAW_LINE);
   PlotIndexSetInteger(1, PLOT_LINE_COLOR, clrWhite);
   PlotIndexSetInteger(1, PLOT_LINE_WIDTH, 1);
   PlotIndexSetString(1,  PLOT_LABEL,      "Threshold");

//--- Configure renderer
   g_renderer.Configure(InpPrefix,
                        InpMildColor,
                        InpStrongColor,
                        InpMildThreshold,
                        InpStrongThreshold);

//--- Reset bar tracker
   g_last_bar = -1;

   return(INIT_SUCCEEDED);
  }
OnInit() binds both indicator buffers, configures the threshold line as a DRAW_LINE plot in the second buffer slot, passes all user-supplied visual parameters to g_renderer.Configure(), and resets g_last_bar to -1. The reset ensures that the first call to OnCalculate() always triggers a full history calculation regardless of whether the indicator was reattached or its parameters were changed.
OnDeinit
//+------------------------------------------------------------------+
//| Indicator Deinitialization                                       |
//+------------------------------------------------------------------+
void OnDeinit(const int reason)
  {
//--- Remove all chart objects on indicator removal
   g_renderer.RemoveObjects();
  }
OnDeinit() calls g_renderer.RemoveObjects() to delete all arrow and rectangle objects whose names begin with InpPrefix. Without this call, all chart markers would persist indefinitely after the indicator is removed, creating orphaned objects that no running code manages. The reason parameter is not used — cleanup is unconditional.
OnCalculate
//+------------------------------------------------------------------+
//| Indicator Calculation                                            |
//+------------------------------------------------------------------+
int OnCalculate(const int rates_total,
                const int prev_calculated,
                const datetime &time[],
                const double   &open[],
                const double   &high[],
                const double   &low[],
                const double   &close[],
                const long     &tick_volume[],
                const long     &volume[],
                const int      &spread[])
  {
   if(rates_total < InpWindow)
      return(0);

//--- Suppress tick-driven calls: only process when a new bar has formed
   int current_bar = rates_total - 1;
   if(current_bar == g_last_bar && prev_calculated > 0)
      return(rates_total);

//--- Determine calculation starting bar
   int start = (prev_calculated <= 0) ? InpWindow : prev_calculated - 1;

//--- Score all bars that need updating
   for(int bar = start; bar < rates_total; bar++)
     {
      g_composite_buffer[bar] = ComputeBarScore(bar, open, high, low,
                                close, tick_volume);
      g_threshold_buffer[bar] = InpStrongThreshold;
     }

//--- On initial full load: render all historical markers at once
   if(prev_calculated <= 0)
     {
      g_renderer.RemoveObjects();
      g_renderer.Render(g_composite_buffer, time, high, low, rates_total);
     }
   else
     {
      //--- On new bar: render markers for the newly completed bar only
      //--- The completed bar is the one before the current forming bar
      int completed_bar = rates_total - 2;

      if(completed_bar >= InpWindow &&
         g_composite_buffer[completed_bar] > InpMildThreshold)
        {
         //--- Remove any stale objects for this bar index then re-render all
         g_renderer.RemoveObjects();
         g_renderer.Render(g_composite_buffer, time, high, low, rates_total);
        }
     }

//--- Compute diagnostics for the last rolling window only
   int    window_start = rates_total - InpWindow;
   double last_body[];
   ArrayResize(last_body, InpWindow);

   for(int k = 0; k < InpWindow; k++)
      last_body[k] = MathAbs(close[window_start + k] - open[window_start + k]);

   double last_med = g_median_calc.Calculate(last_body, InpWindow);
   double last_mad = g_mad_calc.Calculate(last_body, InpWindow, last_med);

//--- Count outliers within the last rolling window only
   int outliers = 0;
   for(int k = window_start; k < rates_total; k++)
     {
      if(g_composite_buffer[k] > InpStrongThreshold)
         outliers++;
     }

//--- Print diagnostics once per new bar
   g_statistics.Print(InpWindow, last_med, last_mad,
                      InpStrongThreshold, outliers);

//--- Update the last processed bar tracker
   g_last_bar = current_bar;

   return(rates_total);
  }
OnCalculate() is the pipeline sequencer. It imposes no domain logic of its own — every statistical decision is delegated to the appropriate module.
The first guard current_bar == g_last_bar && prev_calculated > 0 suppresses tick-driven recalculation. On H1, OnCalculate() fires on every incoming price tick — many times per hour. When current_bar equals g_last_bar and a previous calculation has already occurred, the function returns immediately. This reduces the Experts tab output to exactly one diagnostic block per new closed bar and prevents redundant rendering.
The scoring loop calls ComputeBarScore() for each bar from start to rates_total - 1, writing results into g_composite_buffer and the fixed threshold value into g_threshold_buffer. On the initial full load (prev_calculated <= 0), the loop scores the complete history and g_renderer.Render() is called once to place all historical markers. On each subsequent new bar, only the most recently completed bar is rescored, and the renderer is called again only if that bar qualifies as an outlier — avoiding unnecessary object deletion and recreation on bars that produce no markers.
The diagnostic computation is scoped to rates_total - InpWindow through rates_total, ensuring the outlier count and body statistics reflect only the current rolling window. g_statistics.Print() is called once per new bar, printing five lines to the Experts tab. The final line g_last_bar = current_bar updates the tracker so the next tick-driven call will be suppressed.

Fig. 2. OutlierDetector on EURUSD H1 showing an orange arrow marking a mild outlier bar on 23 Jun, 2026, with the composite score histogram rendered in the subwindow below.
Rendering Objects Summary
| Object Name Pattern | Type | Purpose |
|---|---|---|
| OD_ARR_N | OBJ_ARROW | Downward arrow above the flagged bar's high |
| OD_BOX_N | OBJ_RECTANGLE | Dashed border spanning the bar's high-to-low range |
Rolling Window Scope and Marker Persistence
The diagnostic outlier count printed to the Experts tab reflects only the bars within the current rolling window. Chart markers, however, are placed for all bars flagged as outliers at the time of their scoring and persist on the chart as the window advances. A bar that was extreme relative to the statistical context at its formation will retain its marker even after it exits the rolling window. The count shown in the Experts tab and the number of visible markers on the chart will therefore generally differ, and this is by design rather than an error.
Limitations
Small sample sizes: For rolling window sizes below approximately 20 bars, the median and MAD are poorly estimated because sorting a small array places individual observations directly at the median position. The Modified Z-Score becomes unstable and threshold comparisons lose statistical meaning.
Zero MAD situations: If all values in the rolling window are identical — which can occur for tick volume on instruments during market closure periods — the MAD is exactly zero. CModifiedZScore::Calculate() handles this by returning zero scores, effectively treating all observations as non-anomalous when the scale cannot be estimated.
Trending markets: In a persistently trending market, body sizes systematically increase over time. The rolling median body size rises gradually, and bars that would have been extreme at the trend's beginning may produce ordinary Modified Z-Scores near the trend's peak. The indicator detects anomalies relative to the rolling window, not relative to an absolute scale.
Regime changes: A sudden transition from low to high volatility produces a burst of apparent outliers as the window fills with the new regime's bars. These are genuine statistical anomalies relative to the old regime, not false positives. Once the window is entirely populated by the new regime's bars, the outlier count will normalize.
Non-predictive interpretation: Composite outlier scores describe the statistical unusualness of a bar relative to its rolling context. High composite scores do not imply that a reversal, continuation, or any specific subsequent price behavior is likely. The indicator is a descriptive and diagnostic tool, not a signal generator.
Conclusion
MetaTrader 5 provides every primitive required to implement a statistically rigorous, rolling-window outlier detector operating directly on native OHLCV data. The Median and Median Absolute Deviation, computed via sort-based methods using ArraySort(), provide robust location and scale estimates that are resistant to contamination by the very observations they are designed to detect. The Modified Z-Score with its 0.6745 normalization constant translates these robust estimates into a scale comparable to classical Z-Scores, making standard threshold values directly applicable.
The eight-module architecture presented here separates feature extraction, median estimation, MAD estimation, Z-Score normalization, composite aggregation, chart rendering, and diagnostics into independently understandable components. CFeatureExtractor handles bar geometry. CMedianCalculator handles robust location. CMADCalculator handles robust scale. CModifiedZScore handles normalization. CCompositeScore handles aggregation. COutlierRenderer handles visualization. COutlierStatistics handles observability. OutlierDetector.mq5 sequences them. Each module can be understood, tested, and modified in isolation without requiring knowledge of any other module's internal state.
Programs used in the article:
| # | Name | Type | Description |
|---|---|---|---|
| 1 | FeatureExtractor.mqh | Include File | Computes body, upper wick, lower wick, and tick volume for each bar in the rolling window. |
| 2 | MedianCalculator.mqh | Include File | Computes the rolling median of a feature array by sorting a working copy and selecting the middle element. |
| 3 | MADCalculator.mqh | Include File | Computes the Median Absolute Deviation given a feature array and its pre-computed median. |
| 4 | ModifiedZScore.mqh | Include File | Applies the Modified Z-Score formula to every element of a feature array using the 0.6745 normalization constant. |
| 5 | CompositeScore.mqh | Include File | Aggregates four per-feature Modified Z-Score arrays into a single mean absolute composite score per bar. |
| 6 | OutlierRenderer.mqh | Include File | Places arrow and rectangle chart objects on bars whose composite score exceeds the configured thresholds. |
| 7 | OutlierStatistics.mqh | Include File | Prints a structured diagnostic report to the MetaTrader 5 Experts tab after each calculation pass. |
| 8 | OutlierDetector.mq5 | Custom Indicator | Main event handlers that orchestrate the full pipeline and manage the histogram subwindow. |
| 9 | Outlier_Detector.zip | Zip Archive | Zip archive containing all the attached files and their paths relative to the terminal's root folder. |
Warning: All rights to these materials are reserved by MetaQuotes Ltd. Copying or reprinting of these materials in whole or in part is prohibited.
This article was written by a user of the site and reflects their personal views. MetaQuotes Ltd is not responsible for the accuracy of the information presented, nor for any consequences resulting from the use of the solutions, strategies or recommendations described.

 From Basic to Intermediate: Object Events (III)
 Engineering a Self-Healing Expert Advisor in MQL5 (Part 5): Real-Time Recovery Dashboard (Final Part)
 Neural Networks in Practice: Practice Makes Perfect
 Building Automated Daily Trading Reports with the SendMail Function

- Free trading apps
- Over 8,000 signals for copying
- Economic news for exploring financial markets
You agree to website policy and terms of use