

Engineering a Self-Healing Expert Advisor in MQL5 (Part 5): Real-Time Recovery Dashboard (Final Part)
 1 858
1 858
 0
0

Introduction
Over the previous parts of this series, we built a recovery system capable of persisting trade state, restoring virtual protection after restart, recovering dynamic protection workflows, and validating recovery integrity.
While these features work correctly, they are difficult to observe while the Expert Advisor is actively managing a trade on a chart. Most recovery activity happens internally through runtime memory, SQLite records, and log messages. As the recovery architecture grows, it becomes increasingly difficult to understand what the Expert Advisor is doing at any given moment.
A dashboard solves this problem by exposing important recovery information directly on the chart. Instead of relying on journal logs, traders can monitor the Expert Advisor's current operational state in real-time.
In this article, we will build a dashboard that displays trade information, virtual protection levels, recovery status, synchronization status, and heartbeat activity. By the end of this part, readers will have a visual monitoring layer that makes the behavior of the recovery system easier to understand and verify while the Expert Advisor is running.
Preparing the project
This article continues from the implementation completed in Part 4 of the series. Before proceeding, download the "SelfHealingExpertPart4.mq5" source file attached to this article and open it in MetaEditor.
In this final part, we will build a dashboard that displays the current recovery state directly on the chart. The dashboard will show important runtime information such as the EA state, virtual protection levels, recovery status, synchronization status, and heartbeat activity.
The recovery architecture itself will remain unchanged. Our focus will be on presenting the information already maintained by the Expert Advisor in a way that is easy to monitor while the system is running.
Defining Dashboard Requirements
A useful dashboard should help us understand the current state of the Expert Advisor without requiring us to inspect SQLite records or search through journal logs. Therefore, we must decide beforehand what information it needs to display.
The first group of information relates to the current runtime state of the EA. This includes the operational state, the active ticket number, the traded symbol, and the trade direction. These values provide a quick overview of what the Expert Advisor is currently managing.
The second group relates to trade protection. Since the recovery architecture relies on virtual protection, it is useful to display the current virtual stop-loss, virtual take-profit, breakeven status, and trailing status. This makes it possible to observe how protection evolves while the trade is active.
The final group relates to recovery monitoring. Information such as database status, recovery status, synchronization status, and heartbeat age can help confirm that the recovery system is operating correctly and that the saved trade state remains current.
Together, these values provide a complete view of the recovery architecture while it is running.
Building the Dashboard Framework
The dashboard will consist of a panel and a collection of text labels that will later be updated with live recovery information. Before creating any dashboard objects, we first define a common naming prefix that will be used throughout the dashboard implementation.
Add the following constant below the database configuration section:
//+------------------------------------------------------------------+
//| Dashboard configuration                                          |
//+------------------------------------------------------------------+
#define DASHBOARD_PREFIX "SHM_DASHBOARD_"
This prefix will be added to the name of every dashboard object created by the Expert Advisor. Using a consistent naming convention makes it easier to identify, update, and remove dashboard objects during runtime.
Next, add the following functions below the existing utility functions:
//+------------------------------------------------------------------+
//| Creates the dashboard background and initial text labels.        |
//+------------------------------------------------------------------+
void CreateDashboard()
  {
   string panelName = DASHBOARD_PREFIX + "PANEL";

   if(ObjectFind(0, panelName) < 0)
     {
      ObjectCreate(0, panelName, OBJ_RECTANGLE_LABEL, 0, 0, 0);
      ObjectSetInteger(0, panelName, OBJPROP_CORNER, CORNER_LEFT_UPPER);
      ObjectSetInteger(0, panelName, OBJPROP_XDISTANCE, 10);
      ObjectSetInteger(0, panelName, OBJPROP_YDISTANCE, 20);
      ObjectSetInteger(0, panelName, OBJPROP_XSIZE, 360);
      ObjectSetInteger(0, panelName, OBJPROP_YSIZE, 315);
      ObjectSetInteger(0, panelName, OBJPROP_BGCOLOR, clrBlack);
      ObjectSetInteger(0, panelName, OBJPROP_BORDER_TYPE, BORDER_FLAT);
      ObjectSetInteger(0, panelName, OBJPROP_COLOR, clrDimGray);
      ObjectSetInteger(0, panelName, OBJPROP_BACK, false);
     }
  }
//+------------------------------------------------------------------+
//| Deletes all dashboard objects from the chart.                    |
//+------------------------------------------------------------------+
void DeleteDashboard()
  {
   ObjectsDeleteAll(0, DASHBOARD_PREFIX);
  }
The CreateDashboard function creates the dashboard container that will be displayed on the chart. This container acts as the visual area where runtime and recovery information will later be displayed. At this stage, the dashboard only creates the panel itself and establishes the layout that will hold the dashboard labels.
The DeleteDashboard function performs the opposite task. When the Expert Advisor is removed from the chart, all dashboard objects that use the dashboard prefix are deleted automatically. This ensures that no dashboard elements remain on the chart after the EA has been unloaded.
Displaying Dashboard Values
The dashboard panel is now available on the chart, but it still needs helper functions for creating text rows and converting internal state values into readable text. Before adding the main dashboard update function, add the following helper below DeleteDashboard:
//+------------------------------------------------------------------+
//| Creates or updates one dashboard text row.                       |
//+------------------------------------------------------------------+
void SetDashboardLabel(const string name,
                       const string text,
                       const int x,
                       const int y)
  {
   string objectName = DASHBOARD_PREFIX + name;

   if(ObjectFind(0, objectName) < 0)
     {
      ObjectCreate(0, objectName, OBJ_LABEL, 0, 0, 0);
      ObjectSetInteger(0, objectName, OBJPROP_CORNER, CORNER_LEFT_UPPER);
      ObjectSetInteger(0, objectName, OBJPROP_FONTSIZE, 9);
      ObjectSetString(0, objectName, OBJPROP_FONT, "Consolas");
      ObjectSetInteger(0, objectName, OBJPROP_COLOR, clrWhite);
     }

   ObjectSetInteger(0, objectName, OBJPROP_XDISTANCE, x);
   ObjectSetInteger(0, objectName, OBJPROP_YDISTANCE, y);
   ObjectSetString(0, objectName, OBJPROP_TEXT, text);
  }
SetDashboardLabel gives the dashboard a reusable way to create and update text rows. Each label uses the dashboard prefix, which keeps all dashboard objects grouped under the same naming system.
Next, add two small conversion helpers. These functions convert internal enum and position values into text that can be displayed on the chart.
//+------------------------------------------------------------------+
//| Converts the current EA state into readable text.                |
//+------------------------------------------------------------------+
string GetEAStateText()
  {
   switch(g_eaState)
     {
      case EA_STATE_STARTING:
         return("STARTING");
      case EA_STATE_RECOVERING:
         return("RECOVERING");
      case EA_STATE_RUNNING:
         return("RUNNING");
      case EA_STATE_SAFE_MODE:
         return("SAFE MODE");
      case EA_STATE_ERROR:
         return("ERROR");
     }

   return("UNKNOWN");
  }
//+------------------------------------------------------------------+
//| Converts the position direction into readable text.              |
//+------------------------------------------------------------------+
string GetDirectionText()
  {
   if(!g_hasTradeState)
      return("NONE");

   if(g_tradeState.direction == POSITION_TYPE_BUY)
      return("BUY");

   if(g_tradeState.direction == POSITION_TYPE_SELL)
      return("SELL");

   return("UNKNOWN");
  }
With these helper functions in place, we can now add the main dashboard update function.
//+------------------------------------------------------------------+
//| Updates dashboard values using the current runtime trade state.   |
//+------------------------------------------------------------------+
void UpdateDashboard()
  {
   double currentPrice  = 0.0;
   string heartbeatText = "NONE";
   string heartbeatTime = "NONE";

   if(g_hasTradeState)
     {
      if(g_tradeState.direction == POSITION_TYPE_BUY)
         currentPrice = SymbolInfoDouble(g_tradeState.symbol, SYMBOL_BID);
      else
         currentPrice = SymbolInfoDouble(g_tradeState.symbol, SYMBOL_ASK);

      heartbeatText = "OK";
      heartbeatTime = TimeToString(g_tradeState.lastHeartbeat, TIME_SECONDS);
     }

   SetDashboardLabel("TITLE",     "Self-Healing Trade Manager", 25, 35);
   SetDashboardLabel("STATE",     "EA State: " + GetEAStateText(), 25, 60);
   SetDashboardLabel("SYMBOL",    "Symbol: " + (g_hasTradeState ? g_tradeState.symbol : _Symbol), 25, 80);
   SetDashboardLabel("TICKET",    "Ticket: " + (g_hasTradeState ? IntegerToString(g_tradeState.ticket) : "NONE"), 25, 100);
   SetDashboardLabel("DIRECTION", "Direction: " + GetDirectionText(), 25, 120);
   SetDashboardLabel("ENTRY",     "Entry: " + (g_hasTradeState ? DoubleToString(g_tradeState.entryPrice, _Digits) : "0.00"), 25, 140);

   SetDashboardLabel("VSL",   "Virtual SL: " + (g_hasTradeState ? DoubleToString(g_tradeState.virtualSL, _Digits) : "0.00"), 25, 165);
   SetDashboardLabel("VTP",   "Virtual TP: " + (g_hasTradeState ? DoubleToString(g_tradeState.virtualTP, _Digits) : "0.00"), 25, 185);
   SetDashboardLabel("PRICE", "Current Price: " + DoubleToString(currentPrice, _Digits), 25, 205);

   SetDashboardLabel("BE",             "Breakeven: " + (g_hasTradeState ? (g_tradeState.breakevenActivated ? "ACTIVE" : "WAITING") : "NONE"), 25, 230);
   SetDashboardLabel("TRAIL",          "Trailing: " + (g_hasTradeState ? (g_tradeState.trailingActivated ? "ACTIVE" : "WAITING") : "NONE"), 25, 250);
   SetDashboardLabel("HEARTBEAT",      "Heartbeat: " + heartbeatText, 25, 270);
   SetDashboardLabel("LAST_HEARTBEAT", "Last Heartbeat: " + heartbeatTime, 25, 290);
  }
UpdateDashboard gathers the current runtime state and sends it to the dashboard labels. It displays the EA state, trade information, virtual protection levels, breakeven status, trailing status, and heartbeat information.
When a managed trade exists, the dashboard displays values from g_tradeState. When no trade is being managed, it displays safe default values such as NONE or 0.00.
At this stage, the dashboard displays recovery information, but it is not yet connected to the EA event flow. In the next section, we will call the dashboard functions from OnInit, OnTimer, and OnDeinit so the display is created, refreshed, and removed correctly.
Integrating Dashboard Updates
The dashboard functions are now available, but they still need to be connected to the Expert Advisor event flow. The dashboard should be created during initialization, refreshed while the EA is running, and removed when the EA is unloaded.
Replace the existing OnInit function with the following version:
//+------------------------------------------------------------------+
//| Expert initialization function                                   |
//+------------------------------------------------------------------+
int OnInit()
  {
//--- set initial EA state
   g_eaState = EA_STATE_STARTING;

//--- create a connection to the SQLite database
   if(!OpenDatabase())
     {
      g_eaState = EA_STATE_ERROR;
      return(INIT_FAILED);
     }

//--- create the database table or make sure that it exists
   if(!EnsureDatabaseTables())
     {
      CloseDatabase();
      g_eaState = EA_STATE_ERROR;
      return(INIT_FAILED);
     }

//--- create dashboard after database initialization succeeds
   CreateDashboard();

//--- create timer
   EventSetTimer(InpTimerSeconds);

//--- enter recovery mode
   g_eaState = EA_STATE_RECOVERING;

//--- restore saved trade state if a managed position exists
   if(!RecoverTradeState())
     {
      Print("The EA entered Safe Mode because recovery was incomplete.");
      UpdateDashboard();
      return(INIT_SUCCEEDED);
     }

//--- enter normal runtime state
   g_eaState = EA_STATE_RUNNING;

//--- remember whether recovery restored an active trade state
   bool recoveredTradeExists = g_hasTradeState;

//--- validate recovered virtual exits immediately
   CheckVirtualExits();

//--- open a test trade only when no recovered trade existed
   if(InpOpenTestTradeOnStartup && !g_hasTradeState && !recoveredTradeExists)
      OpenTestTrade();

//--- update dashboard after startup workflow completes
   UpdateDashboard();

   return(INIT_SUCCEEDED);
  }
The important addition is the call to CreateDashboard after the database has opened successfully and the required tables have been verified. This ensures that the dashboard panel is created before runtime recovery and trade management continue.
The second important addition is the final call to UpdateDashboard before OnInit returns successfully. This gives the dashboard its first values immediately after startup.
The OnTimer function should refresh the dashboard after runtime trade management:
//+------------------------------------------------------------------+
//| Timer function                                                   |
//+------------------------------------------------------------------+
void OnTimer()
  {
//--- manage active virtual protection at fixed intervals
   ManageActiveTrade();

//--- refresh dashboard values after runtime management
   UpdateDashboard();
  }
Finally, make sure OnDeinit removes dashboard objects when the EA is detached:
//+------------------------------------------------------------------+
//| Expert deinitialization function                                 |
//+------------------------------------------------------------------+
void OnDeinit(const int reason)
  {
//--- remove dashboard objects from the chart
   DeleteDashboard();

//--- Close the database connection
   CloseDatabase();

//--- destroy timer
   EventKillTimer();
  }
With these updates, the dashboard becomes part of the EA lifecycle. It is created during startup, refreshed on every timer cycle, and removed when the Expert Advisor is unloaded.
Observing Recovery Behavior in Real-Time
At this stage, the recovery dashboard is fully integrated into the Expert Advisor. The final step is to observe how it behaves under different operating conditions.
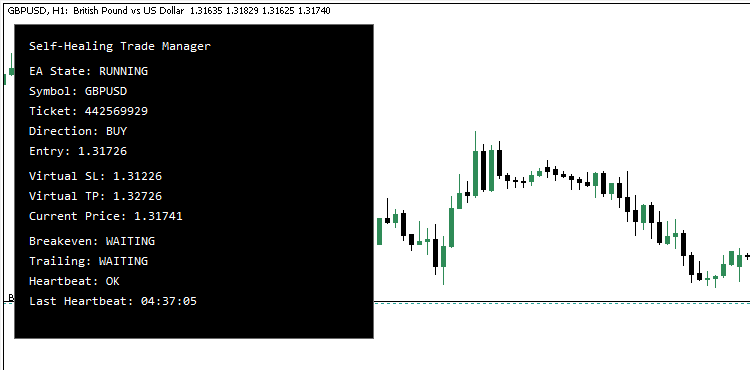
Demonstration 1: Normal Runtime Operation
Begin by attaching the Expert Advisor to a chart and allowing it to open a test trade. Once the trade becomes active, the dashboard should display the current ticket number, trade direction, entry price, and virtual protection levels.
As the market moves in favor of the position, observe the breakeven and trailing status fields. When breakeven protection activates, the dashboard should immediately reflect the new protection state. As trailing protection advances, the virtual stop loss displayed on the dashboard should update accordingly.
This demonstration confirms that the dashboard is correctly displaying the active runtime trade state.
Demonstration 2: Recovery After Restart
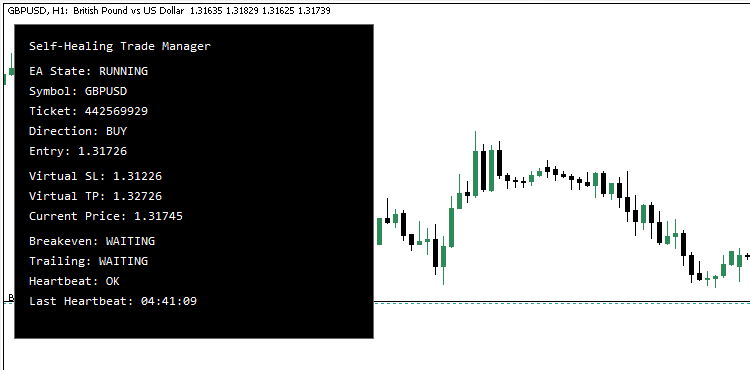
Next, verify that the dashboard continues to reflect the correct recovery state after a restart.
Allow the Expert Advisor to manage an active trade, then detach it from the chart or close the terminal. Leave the broker side position open. After reattaching the Expert Advisor or restarting the terminal, the recovery process should restore the saved trade state from SQLite.
The dashboard should immediately display the restored ticket number, virtual protection levels, breakeven status, trailing status, and heartbeat information. The values shown before the restart should match the values displayed after recovery.
This demonstration confirms that the recovery system and dashboard remain synchronized after startup recovery.
Demonstration 3: Safe-Mode Activation
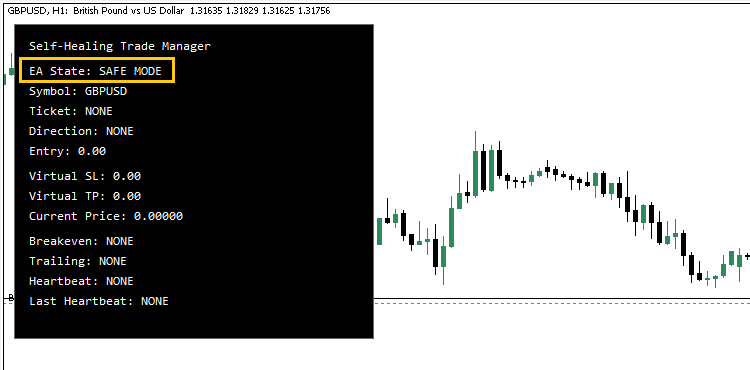
The final test verifies the behavior of the dashboard when recovery integrity can no longer be guaranteed.
Open a managed trade and confirm that the recovery record exists. Next, detach the Expert Advisor from the chart while leaving the broker position open. Run the "DeleteRecoveryRecord.mq5 script" introduced in Part 4 to remove the active recovery record from SQLite.
Reattach the Expert Advisor to the chart. During startup recovery, the EA will detect that the broker position exists but the corresponding recovery record is missing. Recovery will fail and the Expert Advisor will automatically enter Safe-Mode.
The dashboard should clearly display the Safe-Mode state, making it immediately visible that automated trade management has been suspended. This demonstration confirms that the dashboard is capable of exposing recovery failures and Safe-Mode transitions in real-time.
These three demonstrations complete the recovery monitoring workflow. The dashboard now provides a visual view of the entire recovery architecture, making it easier to observe normal operation, startup recovery, and recovery failures directly from the chart.
Conclusion
In this final part of the series, we built a real-time dashboard that exposes the recovery system's internal state on the chart. The dashboard provides visibility into trade information, virtual protection levels, recovery status, synchronization status, and heartbeat activity, making it easier to monitor the behavior of the Expert Advisor while it is running.
This completes the self-healing architecture developed throughout the series. In Part 1, we introduced persistent trade state storage using SQLite. In Part 2, we implemented restart-safe virtual stop-loss and take-profit recovery. In Part 3, we extended the recovery system to support breakeven and trailing protection. In Part 4, we introduced trade state reconciliation and Safe-Mode recovery. Finally, in this article, we added a monitoring layer that lets you observe the recovery workflow in real-time.
The finished Expert Advisor can now persist trade state, recover after restart, restore dynamic protection workflows, validate recovery integrity, enter Safe-Mode when recovery conditions become unsafe, and expose its operational state through a live dashboard.
Although this project was intentionally designed as a simplified educational implementation, the techniques explored throughout the series provide a practical foundation for building more advanced recovery systems in production-grade Expert Advisors.
This series gives you a deeper understanding of state persistence, recovery workflows, and defensive trade management in MQL5. From here, you can extend the architecture further by supporting multiple positions, more advanced synchronization checks, external monitoring systems, or additional recovery mechanisms tailored to your own trading applications.
Attachments
| File Name | Description |
|---|---|
| MQL5.zip | Archive containing all project files organized in the correct MetaTrader 5 directory structure. Extract the archive into the terminal data folder to automatically place the Expert Advisors and script in their appropriate locations. |
| MQL5/Experts/SelfHealingTradeManager/SelfHealingExpertPart5.mq5 | Complete source code developed in this article. It adds a real-time recovery dashboard that displays the EA state, trade information, virtual protection, recovery status, synchronization status, and heartbeat activity directly on the chart. |
| MQL5/Experts/SelfHealingTradeManager/SelfHealingExpertPart4.mq5 | Completed source code from the previous article. Use this file as the starting point before implementing the dashboard developed in this article. |
| MQL5/Scripts/SelfHealingTradeManager/DeleteRecoveryRecord.mq5 | Utility script used to delete active recovery records from the SQLite database. It is provided for testing Safe Mode recovery by simulating a missing recovery record while a managed broker position remains open. |
Warning: All rights to these materials are reserved by MetaQuotes Ltd. Copying or reprinting of these materials in whole or in part is prohibited.
This article was written by a user of the site and reflects their personal views. MetaQuotes Ltd is not responsible for the accuracy of the information presented, nor for any consequences resulting from the use of the solutions, strategies or recommendations described.

 Detecting and Visualizing Outlier Bars in MQL5 Using Modified Z-Score on OHLCV Features
 Building Automated Daily Trading Reports with the SendMail Function
 From Basic to Intermediate: Object Events (III)
 CSV Data Analysis (Part 6): Multi-Broker Result Normalization and Cross-Platform CSV Reconciliation

- Free trading apps
- Over 8,000 signals for copying
- Economic news for exploring financial markets
You agree to website policy and terms of use