

Building the Market Structure Sentinel Indicator in MQL5
 5 408
5 408
 0
0

Introduction
Technical analysis concepts such as Break of Structure (BOS), and Change of Character (CHOCH) have become increasingly popular among discretionary traders seeking to interpret market intent through price action. However, while these concepts are relatively easy to identify visually, translating them into reliable MQL5 logic presents a significant challenge. Implementing market structure analysis requires more than plotting highs and lows. It requires accurate swing-point detection, structural-break validation, false-signal filtering, and consistent behavior across market conditions. What appears intuitive to the human eye is often difficult to define programmatically with both precision and efficiency.
This article addresses these challenges by building a fully functional "Market Structure Sentinel" indicator in MQL5. The indicator is designed to detect and visualize key structural events such as BOS and CHOCH in real time, helping traders better understand market intent, directional bias, and behavioral transitions directly from price action. Beyond marking structural breaks on the chart, the indicator also features a compact mini dashboard that summarizes current market conditions. The dashboard shows an upward arrow for bullish trends and a downward arrow for bearish trends. It shows both arrows to indicate consolidation (ranging). To maintain a clean and uninterrupted charting experience, the dashboard can be hidden or restored through simple keyboard interactions: double-clicking "H" hides the dashboard, while double-clicking "S" displays it again.
Understanding Market Structure
Market structure is one of the oldest and most fundamental concepts in technical analysis. Long before the emergence of Smart Money Concepts (SMC), traders relied on the natural formation of highs, lows, trends, and reversals to determine market direction and price intent. At its core, market structure represents the directional behavior of price as it moves through cycles of expansion, retracement, continuation, and reversal. The foundation of market structure can be traced back to classical price action theories such as the Dow Theory, developed in the late 1800s by Charles Dow, which established that markets move in trends and that those trends can be identified through the formation of higher highs and higher lows in bullish conditions, or lower highs and lower lows in bearish conditions. Modern SMC methodologies expanded on these principles by introducing more refined interpretations of institutional behavior through concepts such as Break of Structure (BOS) and Change of Character (CHOCH).
In practical trading, market structure serves as a framework for understanding market intent. Rather than relying solely on lagging indicators, traders analyze how price reacts around previous highs and lows to determine whether buyers or sellers are in control. A bullish market structure typically reflects strong buying pressure with continuous expansion to new highs, while a bearish structure reflects sustained selling pressure and weakening demand.
Ideal Market Structure
Every structural shift observed on a chart originates from the interaction between swing highs and swing lows. These swing points form the framework traders use to identify trend direction, momentum strength, and potential reversals.
In an Up trend, price typically forms a sequence of Higher Highs (HH) and Higher Lows (HL). A Higher High occurs when price breaks above a previous swing high, indicating continued buying strength. A Higher Low forms when price retraces but fails to move below the previous swing low, suggesting that buyers are still maintaining control of the market. This repeated sequence of HH and HL is the defining characteristic of bullish market structure.
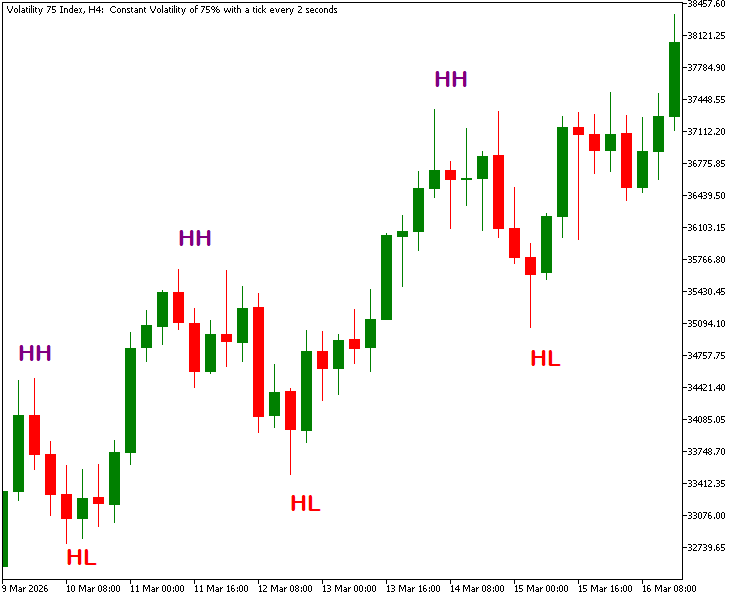
Fig. 1. Market Structure — Up Trend
Conversely, a Down trend is characterized by Lower Lows (LL) and Lower Highs (LH). A Lower Low is formed when price falls below a previous swing low, confirming bearish momentum, while a Lower High occurs when retracement attempts fail to exceed the previous swing high. Together, these formations indicate sustained selling pressure and bearish market intent.
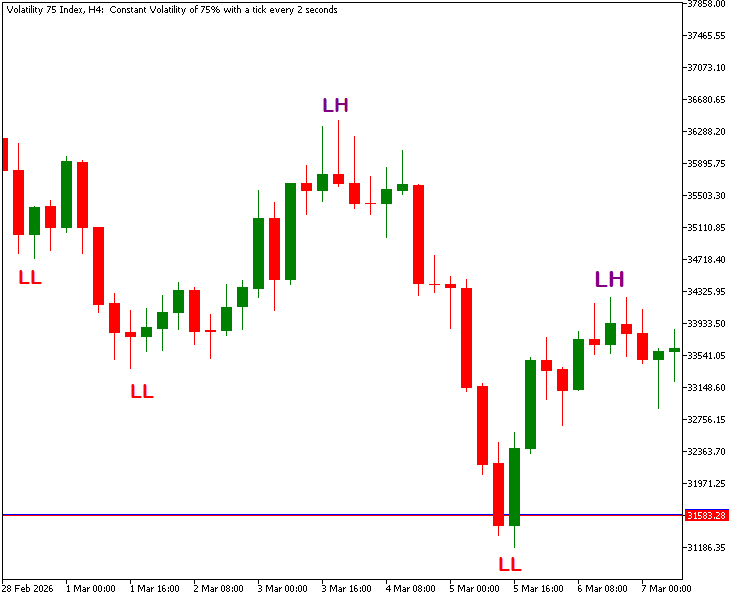
Fig. 2. Market Structure — Down Trend
When the market stops producing clear HH/HL or LL/LH sequences, price often enters a consolidation phase where buyers and sellers are temporarily balanced.
Each sequence of Higher Highs (HH), Higher Lows (HL), Lower Highs (LH), and Lower Lows (LL) contributes to the evolving narrative of market structure. From these formations, BOS and CHOCH events naturally develop, serving as footprints of institutional activity and offering traders early indications of potential continuation or reversal in market direction.
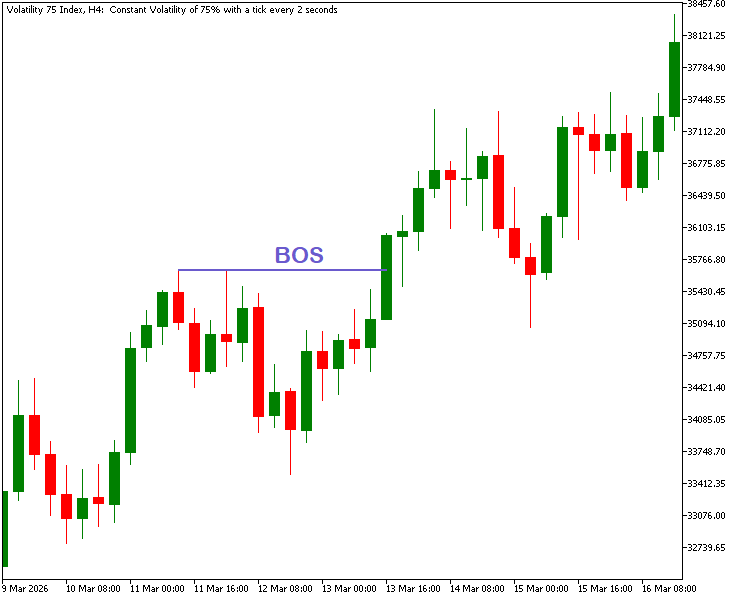
Fig. 3. Market Structure — BOS
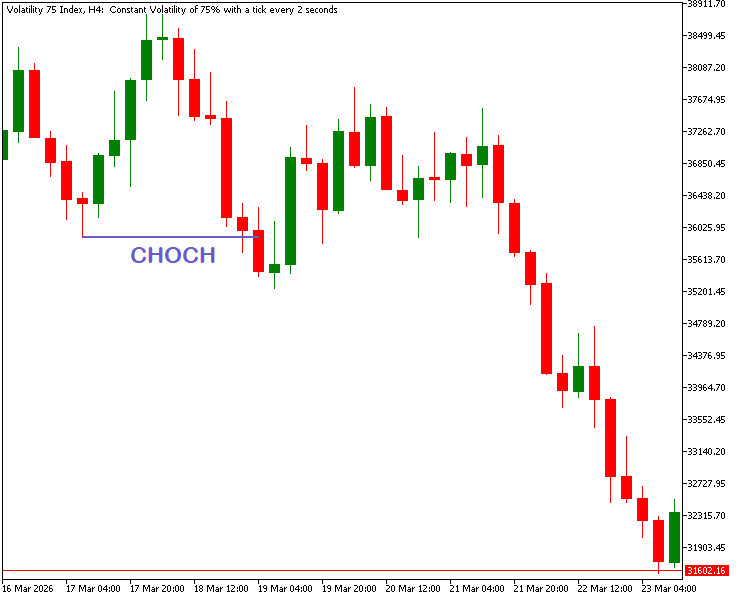
Fig. 4. Market Structure — CHOCH
Implementation
Having established the foundational concepts of market structure and illustrated them through visual diagrams, we now proceed to translate these principles into a fully functional indicator using MQL5.
Preprocessor Directives
At the top of the indicator, we define preprocessor directives for metadata, chart behavior, constants, keyboard controls, object identifiers, color presets, and required libraries. This establishes the program's base configuration.//+------------------------------------------------------------------+ //| Market Structure Sentinel.mq5 | //| © 2026, ChukwuBuikem | //| https://www.mql5.com/en/users/bikeen | //+------------------------------------------------------------------+ #property copyright "© 2026, ChukwuBuikem" #property link "https://www.mql5.com/en/users/bikeen" #property version "1.00" #property indicator_chart_window #property indicator_plots 0 #property strict #include <ChartObjects\ChartObjectsTxtControls.mqh> #include <ChartObjects\ChartObjectsLines.mqh> #define PROG_NAME "Market Structure Sentinel" //--- Mini Dashboard constants #define OUTER_PANEL PROG_NAME + "MiniDashboard_OuterPanel" #define MAIN_HEADER PROG_NAME + "MiniDashboard_Header" #define SUB_HEADER PROG_NAME + "MiniDashboard_SubHeader" #define HEARDER_LABEL PROG_NAME + "MiniDashboard_Direction" #define DIRECTION_LABEL PROG_NAME + "MiniDashboard_Arrow" //--- Market Structure Constants #define TRENDLINE PROG_NAME + "_Trendline" #define TEXT PROG_NAME + "_Text" //--- Keystroke Constants #define KEY_H 72 #define KEY_S 83 #define CLR_DARK_NAVY C'10,20,50' #define CHART_ID ChartID()
Custom Enumeration
This custom enumeration defines the three possible market states—up trend, down trend, and ranging—used throughout the indicator to standardize and simplify trend direction classification.
//--- Custom Enumeration
enum ENUM_TREND
  {
//---
   TREND_UP,//Up trend
   TREND_DOWN,//Down trend
   TREND_RANGE,//Consolidation
  };
Data Structure
We define a lightweight structure for swing points (time, price, and break status). A constructor provides safe defaults to keep state handling consistent.//--- Data structure struct st_SwingPoint { //--- datetime time; double price; bool isBroken; //--- Constructor st_SwingPoint(): time(LONG_MIN), price(EMPTY_VALUE), isBroken(false) {} };
Configurable Parameters
User-defined input parameters establish the core behavioral and visual settings of the indicator, allowing adjustment of pivot sensitivity through rightLeftBars and customization of structural break colors via bosColor and chochColor for BOS and CHOCH visualization.//--- Input settings input int rightLeftBars = 3; //Pivot strength (bars on each side) input color bosColor = clrRed; //Color for BOS input color chochColor = clrPurple; //Color for CHOCH
Global Variables
Core runtime variables are declared globally to maintain persistent state across function calls, including swing point buffers for highs and lows, market context and trend classification flags, and chart object instances used for rendering trendlines, text annotations, and dashboard components throughout the indicator lifecycle.
//--- Global variables
st_SwingPoint swingHigh[2], swingLow[2];
int start = -1;
string marketContext = "";
color contextColor = clrNONE;
CChartObjectRectLabel rectLabel;
CChartObjectLabel label;
CChartObjectText text;
CChartObjectTrend trendLine;
ENUM_TREND currentTrend;
Helper Functions
A set of utility routines is defined to modularize repetitive tasks such as detecting structural conditions, and managing chart objects, ensuring cleaner logic separation and improved code maintainability throughout the indicator.
- New Candle Detection
We begin by creating a helper function that ensures calculations are executed only when a new candle forms, comparing the current candle’s opening time with the previously stored value to detect the arrival of a new bar.
//+------------------------------------------------------------------+
//|                  New candle detection                            |
//+------------------------------------------------------------------+
bool isNewCandle(const datetime newOpenTime)
  {
//---
   static datetime lastOpenTime = LONG_MIN;
   if(lastOpenTime == LONG_MIN)
     {
      lastOpenTime = newOpenTime;
      return false;
     }
   if(lastOpenTime != newOpenTime)
     {
      lastOpenTime = newOpenTime;
      return true;
     }
   return false;
  }
- Swing Point Detection
A swing point represents a local market turning point where price temporarily changes direction, with swing highs marking peaks and swing lows marking bottoms. The following functions identify these points by comparing the current candle’s high or low against a defined number of neighboring candles on both the left and right sides.
//+------------------------------------------------------------------+
//|                  Swing high detection                            |
//+------------------------------------------------------------------+
bool isSwingHigh(const int index, const double &high[], const double &close[])
  {
//---
   int size = ArraySize(high);
//--- Index boundary validation
   if(index < rightLeftBars)
      return false;
   if(index >= (size - (rightLeftBars + 1)))
      return false;

   for(int w = 1; w <= rightLeftBars && (index - w) >= 1; w++)
     {
      //--- Look right (newer candles)
      if(high[index] < high[index - w])
         return false;
      //--- Look left (older candles)
      if(high[index] < high[index + w])
         return false;
     }
   return true;
  }
//+------------------------------------------------------------------+
//|                   Swing low detection                            |
//+------------------------------------------------------------------+
bool isSwingLow(const int index, const double &low[], const double &close[])
  {
//---
   int size = ArraySize(low);
//--- Index boundary validation
   if(index < rightLeftBars)
      return false;
   if(index >= (size - (rightLeftBars + 1)))
      return false;

   for(int w = 1; w <= rightLeftBars && (index - w) >= 1; w++)
     {
      //--- Look right (newer candles)
      if(low[index] > low[index - w])
         return false;
      //--- Look left (older candles)
      if(low[index] > low[index + w])
         return false;
     }
   return true;
  }
- Trend Direction Engine
To determine the prevailing market structure, we analyze the relationship between the most recent swing highs and swing lows.
//+------------------------------------------------------------------+
//|                 Trend direction detection                        |
//+------------------------------------------------------------------+
ENUM_TREND getTrendDirection(const st_SwingPoint &high[],
                             const st_SwingPoint &low[])
  {
//--- Most recent pair of swing points
   if(high[0].time > low[1].time && high[1].time > low[1].time)
     {
      //--- Determine trend direction using highs
      return(high[0].price > high[1].price) ?
            TREND_UP : (high[0].price < high[1].price) ? TREND_DOWN : TREND_RANGE;
     }
   if(low[0].time > high[1].time && low[1].time > high[1].time)
     {
      //--- Determine trend direction using highs
      return(low[0].price > low[1].price) ?
            TREND_UP : (low[0].price < low[1].price) ? TREND_DOWN : TREND_RANGE;
     }

   return TREND_RANGE;// Default value
  }
Explanation:
In practice, market structure is seldom as symmetrical as illustrated in Figures 1 and 2. To remain responsive to evolving price action and reduce structural lag, this implementation adopts a pair-based swing analysis approach. Instead of relying exclusively on either swing highs or swing lows, the algorithm dynamically evaluates the most recent valid pair of swing points — whichever structure is currently dominant in time. This adaptive approach provides a more context-aware assessment of trend direction than statically anchoring analysis to a single swing type.
- Keystroke Double-Click Detection
Interactive trading tools often require quick user input handling, particularly when actions must only be triggered after intentional confirmation. To support this behavior, the following helper function is designed to detect a double-click event by measuring the time interval between consecutive keystrokes.
//+------------------------------------------------------------------+
//|           Keystroke double click detection                       |
//+------------------------------------------------------------------+
bool isDoubleClick(ulong &lastClick, ulong thresholdMs)
  {
//---
   ulong now = GetTickCount();
   lastClick = now;

   return (now - lastClick <= thresholdMs);
  }
- Normalized Middle Candle Time Calculation
//+------------------------------------------------------------------+
//|             Normalized middle time detection                     |
//+------------------------------------------------------------------+
datetime getMiddleCandleTime(const datetime time1, const datetime time2)
  {
//---
   datetime rawMiddleTime = (time1 + time2) / 2;

   int nearestBar = iBarShift(_Symbol, PERIOD_CURRENT, rawMiddleTime, false);

   if(nearestBar < 0)
      return rawMiddleTime;

   return iTime(_Symbol, PERIOD_CURRENT, nearestBar);// Normalized value
  }
- Chart Visualization Utilities
//+------------------------------------------------------------------+
//|                    Trendline creation                            |
//+------------------------------------------------------------------+
void drawTrendline(const string objName, const datetime time1,
                   const double price1, const datetime time2,
                   const double price2, const color clr,
                   const int width, const string tooltip)
  {
//---
   if(trendLine.Create(CHART_ID, objName, 0, time1, price1, time2, price2))
     {
      trendLine.Color(clr);
      trendLine.Width(width);
      trendLine.Tooltip(tooltip);
      trendLine.SetInteger(OBJPROP_HIDDEN, true);
     }
  }
//+------------------------------------------------------------------+
//|                      Text creation                               |
//+------------------------------------------------------------------+
void createText(const string objName, const datetime time, const double price, const color clr,
                const string display, const int fontSize = 10, const string font = "Arial")
  {
//---
   if(text.Create(CHART_ID, objName, 0, time, price))
     {
      text.Color(clr);
      text.Font(font);
      text.FontSize(fontSize);
      text.Tooltip(display);
      text.SetString(OBJPROP_TEXT, display);
      text.SetInteger(OBJPROP_HIDDEN, true);
     }
  }
//+------------------------------------------------------------------+
//|        Function to create rectangle labels                       |
//+------------------------------------------------------------------+
bool createRectLabel(const string objName, const int xDistance, const int yDistance,
                     const int xSize, const int ySize, const color clr, int borderWidth,
                     const color borderColor  = clrNONE, const ENUM_BORDER_TYPE borderType  = BORDER_FLAT,
                     const ENUM_LINE_STYLE  borderStyle = STYLE_SOLID)
  {
//---
   if(rectLabel.Create(CHART_ID, objName, 0, 0, 0, 0, 0))
     {
      rectLabel.X_Distance(xDistance);
      rectLabel.Y_Distance(yDistance);
      rectLabel.X_Size(xSize);
      rectLabel.Y_Size(ySize);
      rectLabel.BackColor(clr);
      rectLabel.SetInteger(OBJPROP_BORDER_COLOR, borderColor);
      rectLabel.SetInteger(OBJPROP_WIDTH, borderWidth);
      rectLabel.BorderType(borderType);
      rectLabel.Style(borderStyle);
      rectLabel.Corner(CORNER_RIGHT_UPPER);
      rectLabel.Tooltip("\n");
      rectLabel.SetInteger(OBJPROP_HIDDEN, true);
      return true;
     }
   return false;
  }
//+------------------------------------------------------------------+
//|        Function to create  labels                                |
//+------------------------------------------------------------------+
bool createLabel(const string objName, const int xDistance, const int yDistance,
                 const color clr, const string display, const int fontSize = 15,
                 const string font = "Arial", const string tooltip = "\n")
  {
//---
   if(label.Create(CHART_ID, objName, 0, 0, 0))
     {
      label.X_Distance(xDistance);
      label.Y_Distance(yDistance);
      label.Color(clr);
      label.Tooltip(tooltip);
      label.SetString(OBJPROP_TEXT, display);
      label.FontSize(fontSize);
      label.Font(font);
      label.SetInteger(OBJPROP_HIDDEN, true);
      return true;
     }
   return false;
  }
//+------------------------------------------------------------------+
//|             Trend direction arrows creation                      |
//+------------------------------------------------------------------+
void createDirectionalArrows(const ENUM_TREND trendDirection)
  {
//---
   string upArrow   = DIRECTION_LABEL + "_UP";
   string downArrow = DIRECTION_LABEL + "_DOWN";
//--- Create both arrows, then set color based on current market direction
   createLabel(upArrow, 710, 70, clrNONE, "▲", 30);
   createLabel(downArrow, 750, 70, clrNONE, "▼", 30);
//--- Up trend
   if(trendDirection == TREND_UP)
     {
      label.Attach(CHART_ID, upArrow, 0, 0);
      label.Tooltip("Up trend");
      label.Color(clrLimeGreen);
      return;
     }
//--- Down trend
   if(trendDirection == TREND_DOWN)
     {
      label.Attach(CHART_ID, downArrow, 0, 0);
      label.Tooltip("Down trend");
      label.Color(clrRed);
      return;
     }
//--- Ranging market
   label.Attach(CHART_ID, upArrow, 0, 0);
   label.Tooltip("Consolidation");
   label.Color(clrLimeGreen);
   label.Attach(CHART_ID, downArrow, 0, 0);
   label.Tooltip("Consolidation");
   label.Color(clrRed);
  }
- Mini Dashboard Interface
The interface functions are responsible for both rendering and removing the mini dashboard dynamically, allowing users to toggle its visibility based on preference or analysis requirements. This dashboard aggregates key information such as trend direction and visual status elements into a single structured panel, improving readability without cluttering the main chart.
//+------------------------------------------------------------------+
//|                     Mini dashboard display                       |
//+------------------------------------------------------------------+
void showMiniDashboard(const ENUM_TREND trendDirection)
  {
//---
   createRectLabel(OUTER_PANEL, 300, 20, 250, 130, CLR_DARK_NAVY, 3, CLR_DARK_NAVY, BORDER_FLAT, STYLE_DASHDOTDOT);
   createLabel(MAIN_HEADER, 595, 27, clrWhite, "Market Structure Sentinel", 13);
   createLabel(SUB_HEADER, 600, 80, clrGold, "Trend: ", 20);
   createDirectionalArrows(trendDirection);
   ChartRedraw(CHART_ID);
  }
//+------------------------------------------------------------------+
//|                  Hide mini dashboard                             |
//+------------------------------------------------------------------+
void hideMiniDashboard()
  {
//---
   ObjectsDeleteAll(CHART_ID, PROG_NAME + "MiniDashboard");
   ChartRedraw(CHART_ID);
  }
- Historical Swing Extraction
During initialization, the routines scan historical data to find the latest swing highs and lows, determine the prevailing trend, and detect recent BOS/CHOCH events already on the chart. This ensures that the indicator begins operation with a fully synchronized structural context rather than waiting for new live market formations to occur.
The implementation performs swing detection directly on an MqlRates array, allowing price properties such as open, high, low, close, and time to be accessed from a single contiguous data structure during initialization.
//+------------------------------------------------------------------+
//|       Detect swing high within MqlRates array[]                  |
//+------------------------------------------------------------------+
bool isRatesSwingHigh(const int index, const MqlRates & rates[])
  {
//---
   int size = ArraySize(rates);
//--- Index boundary validation
   if(index < rightLeftBars)
      return false;
   if(index >= size - (rightLeftBars + 1))
      return false;

   for(int w = 1; w <= rightLeftBars; w++)
     {
      if(index - w < 1)
         return false;
      //--- Look right (newer candles)
      if(rates[index].high < rates[index - w].high)
         return false;
      //--- Look left (older candles)
      if(rates[index].high < rates[index + w].high)
         return false;
     }
   return true;
  }
//+------------------------------------------------------------------+
//|       Detect swing low within MqlRates array[]                   |
//+------------------------------------------------------------------+
bool isRatesSwingLow(const int index, const MqlRates & rates[])
  {
//---
   int size = ArraySize(rates);
//--- Index boundary validation
   if(index < rightLeftBars)
      return false;
   if(index >= size - (rightLeftBars + 1))
      return false;

   for(int w = 1; w <= rightLeftBars; w++)
     {
      if(index - w < 1)
         return false;
      //--- Look right (newer candles)
      if(rates[index].low > rates[index - w].low)
         return false;
      //--- Look left (older candles)
      if(rates[index].low > rates[index + w].low)
         return false;
     }
   return true;
  }
//+------------------------------------------------------------------+
//|                  Initial structure state                         |
//+------------------------------------------------------------------+
void initialMarketStructure(const MqlRates &rates[])
  {
//---
   int lowCount = 0, highCount = 0;
//--- Detect last two swing highs and lows
   for(int w = rightLeftBars; w < ArraySize(rates) - rightLeftBars; w++)
     {
      //--- Detect swing low
      if(lowCount < 2 && isRatesSwingLow(w, rates))
        {
         //--- Save properties
         swingLow[lowCount].price = rates[w].low;
         swingLow[lowCount].time = rates[w].time;
         lowCount++;
        }
      //--- Detect swing high
      if(highCount < 2 && isRatesSwingHigh(w, rates))
        {
         //--- Save properties
         swingHigh[highCount].price = rates[w].high;
         swingHigh[highCount].time = rates[w].time;
         highCount++;
        }
      //--- Exit early when both buffers are filled
      if(lowCount >= 2 && highCount >= 2)
         break;
     }
//--- Determine trend direction using highs
   currentTrend = getTrendDirection(swingHigh, swingLow);
//--- Check break of recent swing high
   for(int w = iBarShift(_Symbol, PERIOD_CURRENT, swingHigh[0].time) - 1; w >= 0 && !swingHigh[0].isBroken; w--)
     {
      if(rates[w].close > swingHigh[0].price)
        {
         swingHigh[0].isBroken = true;
         marketContext = (currentTrend == TREND_UP) ? "BOS" : "CHOCH";
         contextColor = (marketContext == "BOS") ? bosColor : chochColor;
         drawTrendline(TRENDLINE, swingHigh[0].time, swingHigh[0].price,
                       rates[w].time, swingHigh[0].price, contextColor, 2, marketContext);
         createText(TEXT, getMiddleCandleTime(swingHigh[0].time, rates[w].time) - PeriodSeconds(),
                    swingHigh[0].price + (30 * _Point), contextColor, marketContext);
         ChartRedraw(CHART_ID);
        }
     }
//--- Check break of recent swing low
   for(int w = iBarShift(_Symbol, PERIOD_CURRENT, swingLow[0].time) - 1; w >= 0 && !swingLow[0].isBroken; w--)
     {
      if(rates[w].close < swingLow[0].price)
        {
         swingLow[0].isBroken = true;
         marketContext = (currentTrend == TREND_DOWN) ? "BOS" : "CHOCH";
         contextColor = (marketContext == "BOS") ? bosColor : chochColor;
         drawTrendline(TRENDLINE, swingLow[0].time, swingLow[0].price,
                       rates[w].time, swingLow[0].price, contextColor, 2, marketContext);
         createText(TEXT, getMiddleCandleTime(swingLow[0].time, rates[w].time) - PeriodSeconds(),
                    swingLow[0].price - (10 * _Point), contextColor, marketContext);
         ChartRedraw(CHART_ID);
        }
     }
  }
Initialization Logic (OnInit)
OnInit() validates inputs, waits for data synchronization, loads historical data into an MqlRates array, initializes swing context, and then displays the mini dashboard.//+------------------------------------------------------------------+ //| Initialization function | //+------------------------------------------------------------------+ int OnInit() { //--- if(rightLeftBars <= 1) { Print("[INIT]: Pivot strength (bars) input must be > 1"); return INIT_PARAMETERS_INCORRECT; } while(!SeriesInfoInteger(_Symbol, PERIOD_CURRENT, SERIES_SYNCHRONIZED) && !IsStopped()) { Sleep(100); } MqlRates rates[]; ArraySetAsSeries(rates, true); if(CopyRates(_Symbol, PERIOD_CURRENT, 1, iBars(_Symbol, PERIOD_CURRENT), rates) > 0) { initialMarketStructure(rates); } showMiniDashboard(currentTrend); return(INIT_SUCCEEDED); }
Cleanup (OnDeinit)
Proper object management is essential for maintaining chart integrity and preventing orphaned graphical objects after an indicator is removed or reloaded. The OnDeinit() routine performs the necessary cleanup operations by deleting all program-related chart objects, hiding the mini dashboard interface, and refreshing the chart to ensure a clean visual state.
//+------------------------------------------------------------------+
//|              Cleanup function                                    |
//+------------------------------------------------------------------+
void OnDeinit(const int32_t reason)
  {
//---
   ObjectsDeleteAll(CHART_ID, PROG_NAME);
   hideMiniDashboard();
   ChartRedraw(CHART_ID);
  }
Interactive Toggle System
To improve usability and reduce chart clutter, the indicator implements an event-driven dashboard control system using double-click keyboard interaction. The OnChartEvent handler listens for specific key events and utilizes the double-click detection mechanism to dynamically display or hide the mini dashboard on user demand.//+------------------------------------------------------------------+ //| Interactive toggle system | //+------------------------------------------------------------------+ void OnChartEvent(const int32_t id, const long& lparam, const double& dparam, const string& sparam) { //--- int key = (int)lparam; //--- Accept only "S" and "H" presses if(id != CHARTEVENT_KEYDOWN || (key != KEY_H && key != KEY_S)) return; static ulong lastClick = 0; switch(key) { case KEY_S: //--- Double-click is set to happen under 500 milliseconds (ms) if(isDoubleClick(lastClick, 500)) showMiniDashboard(currentTrend); break; case KEY_H: //--- Double-click is set to happen under 500 milliseconds (ms) if(isDoubleClick(lastClick, 500)) hideMiniDashboard(); break; } }
Core Calculation Engine (OnCalculate)
The heart of the indicator resides in OnCalculate(), where all real-time market structure processing is performed. Unlike implementations that iterate over historical bars on every tick, this engine runs only on new bars and does not loop through the price series. This event-driven design significantly improves runtime efficiency by limiting calculations to only newly completed candles, reducing unnecessary processing overhead during live market conditions.//+------------------------------------------------------------------+ //| Custom indicator iteration function | //+------------------------------------------------------------------+ int OnCalculate(const int32_t rates_total, const int32_t prev_calculated, const datetime & time[], const double & open[], const double & high[], const double & low[], const double & close[], const long & tick_volume[], const long & volume[], const int32_t &spread[]) { //--- if(isNewCandle(time[rates_total - 1])) { ArraySetAsSeries(open, true); ArraySetAsSeries(high, true); ArraySetAsSeries(low, true); ArraySetAsSeries(close, true); ArraySetAsSeries(time, true); //--- Detect break of swing high if(!swingHigh[0].isBroken && swingHigh[0].price != EMPTY_VALUE && close[1] > swingHigh[0].price) { //--- Break of swing high swingHigh[0].isBroken = true; marketContext = (currentTrend == TREND_UP) ? "BOS" : "CHOCH"; contextColor = (marketContext == "BOS") ? bosColor : chochColor; drawTrendline(TRENDLINE, swingHigh[0].time, swingHigh[0].price, time[1], swingHigh[0].price, contextColor, 2, marketContext); createText(TEXT, getMiddleCandleTime(swingHigh[0].time, time[1]) - PeriodSeconds(), swingHigh[0].price + (30 * _Point), contextColor, marketContext); ChartRedraw(CHART_ID); return rates_total; } //--- Detect break of swing low if(!swingLow[0].isBroken && swingLow[0].price != EMPTY_VALUE && close[1] < swingLow[0].price) { //--- Break of swing low swingLow[0].isBroken = true; marketContext = (currentTrend == TREND_UP) ? "CHOCH" : "BOS"; contextColor = (marketContext == "BOS") ? bosColor : chochColor; drawTrendline(TRENDLINE, swingLow[0].time, swingLow[0].price, time[1], swingLow[0].price, contextColor, 2, marketContext); createText(TEXT, getMiddleCandleTime(swingLow[0].time, time[1]) - PeriodSeconds(), swingLow[0].price - (10 * _Point), contextColor, marketContext); ChartRedraw(CHART_ID); return rates_total; } if(rates_total < (rightLeftBars + 1) * 2) return rates_total; //--- Detect swing high if(isSwingHigh(rightLeftBars + 1, high, close) && swingHigh[0].time != time[rightLeftBars + 1]) { //--- Update swing high array swingHigh[1] = swingHigh[0]; swingHigh[0].time = time[rightLeftBars + 1]; swingHigh[0].price = high[rightLeftBars + 1]; swingHigh[0].isBroken = false; //--- Update trend direction currentTrend = getTrendDirection(swingHigh, swingLow); //--- Display mini dashboard with latest trend direction showMiniDashboard(currentTrend); return rates_total; } //--- Detect swing low if(isSwingLow(rightLeftBars + 1, low, close) && swingLow[0].time != time[rightLeftBars + 1]) { //--- Update swing low array swingLow[1] = swingLow[0]; swingLow[0].time = time[rightLeftBars + 1]; swingLow[0].price = low[rightLeftBars + 1]; swingLow[0].isBroken = false; //--- Update trend direction currentTrend = getTrendDirection(swingHigh, swingLow); //--- Display mini dashboard with latest trend direction showMiniDashboard(currentTrend); return rates_total; } } return(rates_total); }
Explanation:
Once a new candle is detected, the execution flow proceeds as follows:
- Break Detection
On every newly completed candle, the engine first checks whether price has broken the most recent swing high or swing low.
- A close above the active swing high confirms a bullish structural break.
- A close below the active swing low confirms a bearish structural break.
The broken swing is flagged, market context is classified as either BOS or CHOCH, and the corresponding trendline and text annotation are rendered on the chart.
This stage is processed first because structural breaks provide immediate market context before new swing formation occurs.
- Data Validation
- Swing Point Detection
The engine evaluates whether the recently completed candle forms a valid swing high or low using left-right price comparison logic.
When confirmed:
- The previous swing point shifts into historical storage, respectively.
- The new swing point becomes the active structural reference.
- Break status resets.
- Trend direction is recalculated.
- The mini dashboard updates accordingly.
By combining new-bar execution with localized swing validation, the engine delivers efficient real-time market structure analysis with minimal computational cost.
Program Testing
After compiling successfully with no errors, the indicator was attached to a live chart to evaluate its real-time behavior, and the resulting output is shown below.
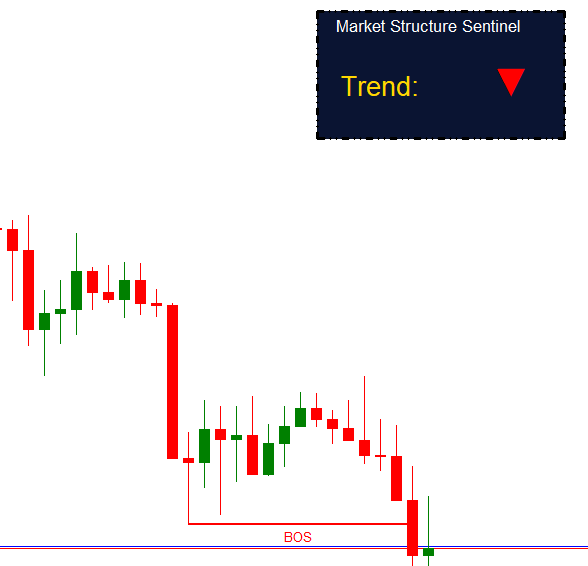
Fig. 5. Market Structure Sentinel Indicator
Conclusion
In this article, we developed a complete market structure analysis framework from the ground up by implementing:
- Efficient new-candle detection for event-driven execution
- Swing point identification for structural market analysis
- Adaptive trend direction detection using dynamic swing relationships
- Historical structure extraction and structural break detection for BOS and CHOCH analysis
- Real-time visualization utilities, normalized text positioning, interactive dashboard controls, and optimized initialization routines using MqlRates for improved execution efficiency
By combining these components, we now have a fully functional Market Structure Sentinel indicator capable of delivering real-time market structure intelligence in a lightweight and extensible architecture.
Warning: All rights to these materials are reserved by MetaQuotes Ltd. Copying or reprinting of these materials in whole or in part is prohibited.
This article was written by a user of the site and reflects their personal views. MetaQuotes Ltd is not responsible for the accuracy of the information presented, nor for any consequences resulting from the use of the solutions, strategies or recommendations described.

 News Filtering with MetaTrader 5 Economic Calendar and CSV Fallback
 How to Detect and Normalize Chart Objects in MQL5 (Part 1): Building a Chart Object Detection Engine
 Integrating AI into 3 Smart Money Concepts (SMC): OB, BOS, and FVG
 Building a Megaphone Pattern Indicator in MQL5

- Free trading apps
- Over 8,000 signals for copying
- Economic news for exploring financial markets
You agree to website policy and terms of use