

Custom Indicator Workshop (Part 3): Building the UT Bot Alerts Indicator in MQL5
 6 682
6 682
 0
0

Introduction
Many traders and developers are familiar with the UT Bot Alerts indicator. The indicator combines volatility-adjusted trailing stops with crossover logic to identify potential trend reversals and generate trading signals.
However, MetaTrader developers often face a common problem: most available UT Bot Alerts implementations are not designed for automation. Many versions that can be found online suffer from several practical limitations:- They repaint historical signals, making them unreliable for automated systems.
- They lack properly documented indicator buffers, which makes it difficult for developers to access signals programmatically.
- They are difficult to integrate with Expert Advisors or other automated trading tools.
- They often mix visualization logic with calculation logic, making the code difficult to reuse or extend.
Because of these challenges, developers who want to use the UT Bot logic in automated trading systems are often forced to rewrite the indicator from scratch before integrating it into their applications.
This is a major pain point for developers building automated trading systems. This article presents a fully documented UT Bot Alerts indicator in MQL5 for integration with automated tools. The goal is to reproduce the visual behavior and provide a clean, extensible architecture for reuse in other systems.The implementation presented in this article exposes clearly structured indicator buffers, allowing developers to access the following components directly:
- Buy signals
- Sell signals
- Current trend direction
- ATR-based trailing stop levels
By providing a well-structured, well-documented implementation, this indicator can serve as a foundation for a wide range of trading applications, including Expert Advisors, algorithmic trading systems, signal scanners, trading dashboards, and quantitative research tools.
Most importantly, it eliminates the need for developers to reverse-engineer or rebuild the UT Bot Alerts logic whenever they want to use it in an automated environment.
Understanding the UT Bot Alerts Concept
Before implementing the indicator in MQL5, it is important to understand the underlying concept behind UT Bot Alerts. Although the indicator appears visually simple, its internal logic is based on a dynamic volatility-adjusted trailing stop that continuously adapts to market conditions.
At the core of the UT Bot system is an ATR-based trailing stop. The Average True Range (ATR) measures market volatility and uses it to determine how far the trailing stop should remain from the current price. Instead of using a fixed stop distance, the system calculates a distance that expands during volatile market conditions and contracts during calmer periods. This distance is typically defined as:
Loss Distance = ATR × Multiplier
The multiplier allows the user to control the indicator's sensitivity. A larger multiplier produces a wider trailing stop and therefore fewer signals, while a smaller multiplier keeps the stop closer to the price and results in more frequent signals.
Once the Loss Distance is determined, the indicator constructs a dynamic trailing stop that follows the price as the market trends. When the market is moving upward, the trailing stop is placed below the price and moves upward as the price advances. Importantly, the stop never moves downward during a bullish trend. Instead, it only tightens in the direction of the trend. This behavior allows the stop to gradually lock in the trend while remaining responsive to changes in volatility.
Similarly, during a bearish trend, the trailing stop is positioned above the price and moves downward as the price declines. Just like in the bullish case, the stop does not move against the direction of the trend. It only adjusts further in the direction of the current movement, ensuring that the stop always trails the price rather than leading it.
A trend reversal occurs when the price crosses the trailing stop. When this happens, the indicator interprets the event as a change in market direction. The trailing stop then flips to the opposite side of the price. For example, if the price was previously above the trailing stop and then crosses below it, the system switches from a bullish state to a bearish state and places the trailing stop above the price. This flip mechanism effectively converts the trailing stop into a dynamic support and resistance level that continuously adapts to price action.
To generate signals, the indicator monitors when price crosses the trailing stop. In practice, it uses EMA(1) to detect the crossover. EMA(1) closely tracks price and provides a consistent crossover test against the trailing stop.
When the EMA crosses above the trailing stop, and the price is positioned above the stop level, the indicator generates a buy signal. Conversely, when the EMA crosses below the trailing stop, and the price is positioned below the stop level, the indicator generates a sell signal. These signals represent potential transitions between bullish and bearish market regimes.
From a conceptual standpoint, the UT Bot system can be viewed as a sequence of transformations applied to price data:
Price

   ↓

ATR-based volatility measurement

   ↓

ATR Trailing Stop

   ↓

Trend State Detection

   ↓

Buy / Sell Signal Generation
Understanding this flow is important because the visual elements of the indicator—colored candles, signal arrows, and trailing stop behavior—are derived from it. In the next sections, we will translate this conceptual model into a structured MQL5 implementation designed specifically for algorithmic trading and automated systems.
Architectural Design for an MQL5 Implementation
When translating the UT Bot Alerts indicator into MQL5, the primary objective was to reproduce the behavior of the original indicator developed by Quant Nomad while structuring the implementation in a way that is practical for developers who intend to extend or automate it.
The implementation closely mirrors the logic of the original UT Bot Alerts algorithm. At the same time, the indicator's internal structure was carefully organised to make the code easier to understand, maintain, and integrate into automated trading systems.
Configurable Input Parameters
The first design decision was to make the indicator configurable through a small set of input parameters. These parameters allow users and developers to control the sensitivity of the trailing stop and adjust the indicator's behavior without modifying the source code.
Three input parameters are exposed:
- ATR Period
- ATR Multiplier
- Source price selection between standard candles and Heikin Ashi candles
The ATR period determines the lookback window used to measure market volatility. The ATR multiplier controls how far the trailing stop is positioned from the current price. A larger multiplier produces a wider stop and therefore fewer signals, while a smaller multiplier keeps the stop closer to the price and generates signals more frequently.
The third parameter allows the user to select the source price used in the calculations. When this option is enabled, the indicator uses Heikin Ashi candlestick values instead of standard price data. This can help smooth price fluctuations and produce a more stable trend representation.
Using a Dedicated Heikin Ashi Indicator
Instead of calculating Heikin Ashi values within the UT Bot indicator itself, the implementation reads them from a separate Heikin Ashi indicator developed in an earlier article.
This approach offers two advantages. First, it keeps the UT Bot Alerts indicator focused only on its own logic. Second, it allows the Heikin Ashi indicator to be reused in other projects without duplicating code. The UT Bot Alerts indicator reads the required buffers from the Heikin Ashi indicator whenever the user enables this option.
Non-Repainting Behavior
Another important design requirement is that the indicator must not repaint historical signals. In this implementation, once a candle closes, its calculated values remain fixed. Only the most recently closed bar is updated when a new bar forms. This ensures that signals remain stable and that the indicator behaves consistently in both live trading and historical testing environments.
Non-repainting behavior is particularly important when the indicator is used as a signal source for automated trading systems.
Visual Design and Chart Presentation
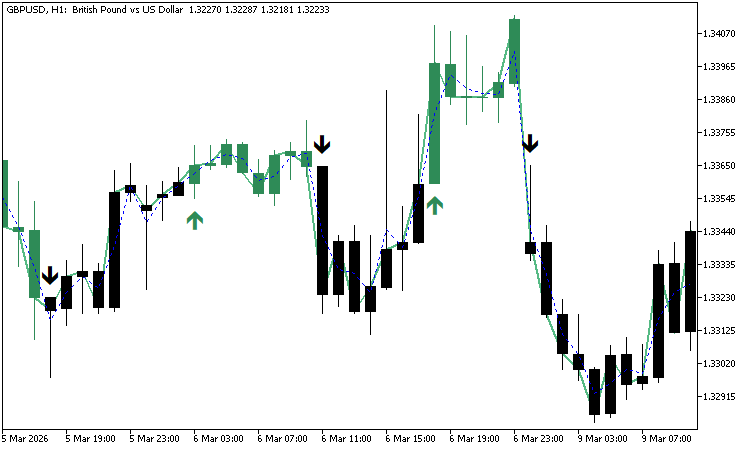
The indicator's visual appearance was also designed to provide clear, immediate feedback on the current trend state. When the indicator is applied to a chart, the background is set to white to create a neutral visual environment. The candles are then colored uniformly depending on the current trend direction.
By default, candles during an uptrend are colored black, while candles during a downtrend are colored sea green. This color scheme creates a strong contrast that allows traders to identify trend changes quickly.
Signal arrows are also displayed directly on the chart. Buy signals are represented by sea green upward arrows placed below the candle at the point where the signal occurs. Black downward arrows above the candle represent sell signals. These visual markers make it easy to identify the exact point where the system detects a potential trend transition.
Modular Structure
The indicator was intentionally designed to be modular. Instead of implementing the entire algorithm in a single block of code, the calculations are divided into several well-defined functions.
Separate functions handle tasks such as retrieving ATR values, calculating the trailing stop, determining the trend state, generating signals, and updating the visual buffers. This modular structure makes the code easier to read and allows developers to modify or extend specific parts of the algorithm without affecting the entire system.
This design approach is particularly useful for developers who want to integrate the indicator into larger applications such as Expert Advisors, signal scanners, or trading dashboards.
The figure below shows the final appearance of the UT Bot Alerts indicator when applied to a price chart.
Implementing the UT Bot Alerts Indicator in MQL5
With the architectural design established, the next step is to implement the indicator. In this section, the development process begins, and the indicator will be constructed step by step using MQL5.
Before proceeding, several prerequisites must be met. The article assumes basic MQL5 and MetaTrader 5 proficiency.
First, familiarity with the MQL5 programming language is required. Basic language concepts such as variables, functions, conditional statements, loops, enumerations, and the use of standard libraries should already be understood. If these concepts are unfamiliar, please review the official MQL5 documentation before continuing.
Second, prior experience using the MetaTrader 5 trading platform is expected. It is assumed that the development environment is already installed and that the platform interface can be navigated comfortably. This includes opening charts, attaching indicators to charts, and using the Navigator window to manage MQL programs and initiate testing through the Strategy Tester.
Third, the built-in development environment, MetaEditor, should be familiar. MetaEditor is used to create source files, write code, compile programs, inspect errors, and debug problems. Once these basic requirements are satisfied, the development process can begin.
Programming concepts are best learned through practice rather than passive reading. For this reason, it is highly recommended that you write the code alongside this tutorial as you follow each step of the implementation.
The complete source code for the finished indicator is attached to this article as ciw_uTBotAlerts.mq5. Keeping this file open in a separate tab for reference can be helpful during development. If issues arise while coding, the implementation in the attached file can be used to verify the structure and logic.
Preparing the Required Indicator Resources
As discussed earlier, the UT Bot Alerts indicator uses Heikin Ashi price data when the user enables this option. Instead of computing the Heikin Ashi values directly in the UT Bot Alerts indicator, this implementation reads them from an external Heikin Ashi indicator developed in a separate article.
The source code of that indicator is included in the attachments for this article under the name heikinAshiIndicator.mq5. There are two simple ways to make this indicator available.
The first approach is to download the source file and place it inside the Indicators directory of the MQL5 folder. This directory contains the source files for all custom indicators used by the MetaTrader terminal.
The procedure is as follows.
- Open the MetaTrader 5 terminal.
- From the top menu, select File and then choose Open Data Folder.
- Navigate to the MQL5 directory.
- Open the Indicators folder.
- Copy the file heikinAshiIndicator.mq5 into this directory.
- Open MetaEditor and compile the indicator.
After compilation, the indicator will be available for use by other MQL5 programs.
The second approach is to create a new empty indicator source file and paste the provided code into it. To do this, open MetaEditor and create a new Custom Indicator file named heikinAshiIndicator.mq5. The source code from the attached file can then be copied and pasted into the new file before compiling.
This article assumes that indicator resources are stored in the Indicators directory under the root MQL5 folder.
Creating the Indicator Source File
With the required resources prepared, the development of the UT Bot Alerts indicator can begin.
Open MetaEditor and create a new empty Custom Indicator file. The file can be named as desired, though the implementation in this article uses the name ciw_uTBotAlerts.mq5. Once the file has been created, insert the following boilerplate code into the source file.
//+------------------------------------------------------------------+
//|                                              ciw_uTBotAlerts.mq5 |
//|            Copyright 2026, MetaQuotes Ltd. Developer: Chacha Ian |
//|                          https://www.mql5.com/en/users/chachaian |
//+------------------------------------------------------------------+

#property copyright "Copyright 2026, MetaQuotes Ltd. Developer is Chacha Ian"
#property link      "https://www.mql5.com/en/users/chachaian"
#property version   "1.00"
#property indicator_chart_window
#property indicator_buffers 11
#property indicator_plots 4
#resource "\\Indicators\\heikinAshiIndicator.ex5"


//+------------------------------------------------------------------+
//| User input variables                                             |
//+------------------------------------------------------------------+
input group "Information"
input int32_t atrPeriod     = 10;
input double  atrMultiplier = 1.5;
input bool useHeikinAshi    = true;


//+------------------------------------------------------------------+
//| Global Variables                                                 |
//+------------------------------------------------------------------+
ENUM_TIMEFRAMES timeframe = PERIOD_CURRENT;

int atrHandle;
double atrValues [];

int    heikinAshiIndicatorHandle;
double heikinAshiClose     [];


//+------------------------------------------------------------------+
//| Declaration of indicator buffers                                 |
//+------------------------------------------------------------------+
double SellSignalArrowBuffer[];
double BuySignalArrowBuffer [];

double CandleOpenBuffer [];
double CandleHighBuffer [];
double CandleLowBuffer  [];
double CandleCloseBuffer[];
double CandleColorIndexBuffer[];

double emaValues[];

double utBotTrendState[];

double lossDistance[];

double TrailingStop[];

//+------------------------------------------------------------------+
//| Custom indicator initialization function                         |
//+------------------------------------------------------------------+
int OnInit()
  {

//--- Initialize the ATR indicator
   atrHandle = iATR(_Symbol, timeframe, atrPeriod);
   if(atrHandle == INVALID_HANDLE)
     {
      Print("Error while initializing the ATR indicator ", GetLastError());
      return(INIT_FAILED);
     }

// Initialize the Heikin Ashi indicator
   heikinAshiIndicatorHandle    = iCustom(_Symbol, timeframe, "::Indicators\\heikinAshiIndicator.ex5");
   if(heikinAshiIndicatorHandle == INVALID_HANDLE)
     {
      Print("Error while initializing The Heikin Ashi Indicator: ", GetLastError());
      return(INIT_FAILED);
     }

//--- Bind arrays to indicator buffers
   SetIndexBuffer(0, SellSignalArrowBuffer, INDICATOR_DATA);
   SetIndexBuffer(1, BuySignalArrowBuffer, INDICATOR_DATA);
   SetIndexBuffer(2, CandleOpenBuffer, INDICATOR_DATA);
   SetIndexBuffer(3, CandleHighBuffer, INDICATOR_DATA);
   SetIndexBuffer(4, CandleLowBuffer, INDICATOR_DATA);
   SetIndexBuffer(5, CandleCloseBuffer, INDICATOR_DATA);
   SetIndexBuffer(6, CandleColorIndexBuffer, INDICATOR_COLOR_INDEX);
   SetIndexBuffer(7, emaValues, INDICATOR_DATA);
   SetIndexBuffer(8, utBotTrendState, INDICATOR_CALCULATIONS);
   SetIndexBuffer(9, lossDistance, INDICATOR_CALCULATIONS);
   SetIndexBuffer(10, TrailingStop, INDICATOR_CALCULATIONS);

//-- Set all global arrays to non-timeseries
   SetNonTimeSeries();

   return(INIT_SUCCEEDED);
  }


//+------------------------------------------------------------------+
//| Custom indicator iteration function                              |
//+------------------------------------------------------------------+
int OnCalculate(const int32_t rates_total,
                const int32_t prev_calculated,
                const datetime &time[],
                const double &open[],
                const double &high[],
                const double &low[],
                const double &close[],
                const long &tick_volume[],
                const long &volume[],
                const int32_t &spread[])
  {

//--- Temporary buffers used to store price data for rendering custom colored candles
   double utOpen [];
   double utHigh [];
   double utLow  [];
   double utClose[];

//--- Copy price data into local working buffers to safely manipulate candle values without altering the original price arrays
   ArrayCopy(utOpen, open);
   ArraySetAsSeries(utOpen, false);
   ArrayCopy(utHigh, high);
   ArraySetAsSeries(utHigh, false);
   ArrayCopy(utLow, low);
   ArraySetAsSeries(utLow, false);
   ArrayCopy(utClose, close);
   ArraySetAsSeries(utClose, false);

//--- This block is executed when the indicator is initially attached to a chart
   if(prev_calculated == 0)
     {

      //--- Start with clean buffers at first calculation
      ArrayInitialize(SellSignalArrowBuffer, EMPTY_VALUE);
      ArrayInitialize(BuySignalArrowBuffer,  EMPTY_VALUE);
      ArrayInitialize(CandleOpenBuffer,      EMPTY_VALUE);
      ArrayInitialize(CandleHighBuffer,      EMPTY_VALUE);
      ArrayInitialize(CandleLowBuffer,       EMPTY_VALUE);
      ArrayInitialize(CandleCloseBuffer,     EMPTY_VALUE);
      ArrayInitialize(CandleColorIndexBuffer,EMPTY_VALUE);
      ArrayInitialize(emaValues,             EMPTY_VALUE);
      ArrayInitialize(utBotTrendState,       EMPTY_VALUE);
      ArrayInitialize(atrValues,             EMPTY_VALUE);
      ArrayInitialize(heikinAshiClose,       EMPTY_VALUE);
      ArrayInitialize(lossDistance,          EMPTY_VALUE);
      ArrayInitialize(TrailingStop,          EMPTY_VALUE);

      //--- Get all ATR values
      GetAllATRValues(rates_total);

      //--- Get all Heikin Ashi values
      GetAllHeikinAshiCloseValues(rates_total);

      //--- When using Heikin Ashi is enabled
      if(useHeikinAshi)
        {
        }

      //--- When using Heikin Ashi is disabled
      if(!useHeikinAshi)
        {
        }

     }

//--- This block is executed on every new bar open
   if(prev_calculated != rates_total && prev_calculated != 0)
     {

      //--- Get all ATR values
      GetAllATRValues(rates_total);

      //--- Get all Heikin Ashi values
      GetAllHeikinAshiCloseValues(rates_total);

      //--- When using Heikin Ashi is enabled
      if(useHeikinAshi)
        {
        }

      //--- When using Heikin Ashi is disabled
      if(!useHeikinAshi)
        {
        }

     }

   return(rates_total);
  }

//+------------------------------------------------------------------+
//| Sets array indexing to non-timeseries (0 = oldest bar)           |
//+------------------------------------------------------------------+
void SetNonTimeSeries()
  {
   ArraySetAsSeries(atrValues, false);
   ArraySetAsSeries(heikinAshiClose, false);
   ArraySetAsSeries(SellSignalArrowBuffer, false);
   ArraySetAsSeries(BuySignalArrowBuffer, false);
   ArraySetAsSeries(CandleOpenBuffer, false);
   ArraySetAsSeries(CandleHighBuffer, false);
   ArraySetAsSeries(CandleLowBuffer, false);
   ArraySetAsSeries(CandleCloseBuffer, false);
   ArraySetAsSeries(CandleColorIndexBuffer, false);
   ArraySetAsSeries(emaValues, false);
   ArraySetAsSeries(utBotTrendState, false);
   ArraySetAsSeries(lossDistance, false);
   ArraySetAsSeries(TrailingStop, false);
  }


//+------------------------------------------------------------------+
//| Get all ATR values into global atrValues array                   |
//| Index 0 = oldest bar                                             |
//+------------------------------------------------------------------+
bool GetAllATRValues(int rates_total)
  {

// Copy entire ATR buffer
   int copied = CopyBuffer(atrHandle, 0, 0, rates_total, atrValues);

   if(copied <= 0)
     {
      Print("Failed to copy ATR data. Error: ", GetLastError());
      return false;
     }

   ArraySetAsSeries(atrValues, false);

   return true;
  }


//+-------------------------------------------------------------------+
//| Get all Heikin Ashi close values into global heikinAshiClose array|
//| Index 0 = oldest bar                                              |
//+-------------------------------------------------------------------+
bool GetAllHeikinAshiCloseValues(int rates_total)
  {

// Copy entire Heikin Ashi buffer
   int copied = CopyBuffer(heikinAshiIndicatorHandle, 3, 0, rates_total, heikinAshiClose);

   if(copied <= 0)
     {
      Print("Error while copying Heikin Ashi Close prices: ", GetLastError());
      return false;
     }

   ArraySetAsSeries(heikinAshiClose, false);

   return true;
  }

//+------------------------------------------------------------------+
This code serves as the foundation for the entire indicator. It does not yet implement the UT Bot Alerts logic, but it establishes the structural components that will support the calculations that follow.
To understand how the implementation works, it is helpful to examine this code in several logical sections.
Indicator Properties and Resource Declaration
The first section of the code defines several properties that describe the indicator.
//+------------------------------------------------------------------+
//|                                              ciw_uTBotAlerts.mq5 |
//|          Copyright 2026, MetaQuotes Ltd. Developer is Chacha Ian |
//|                          https://www.mql5.com/en/users/chachaian |
//+------------------------------------------------------------------+

#property copyright "Copyright 2026, MetaQuotes Ltd. Developer is Chacha Ian"
#property link      "https://www.mql5.com/en/users/chachaian"
#property version   "1.00"
#property indicator_chart_window
#property indicator_buffers 11
#property indicator_plots 4
#resource "\\Indicators\\heikinAshiIndicator.ex5"
These properties specify basic information such as the indicator version, the chart window where it will be drawn, and the number of buffers used by the indicator.
The resource directive is also defined here. This directive allows the indicator to access the previously compiled Heikin Ashi indicator.
By declaring the resource at this stage, the UT Bot Alerts indicator can retrieve Heikin Ashi values directly from the external indicator at runtime.
Input Parameters
The next section defines the input parameters that control the indicator's behavior. Three parameters are exposed to the user.
//+------------------------------------------------------------------+
//| User input variables                                             |
//+------------------------------------------------------------------+
input group "Information"
input int32_t atrPeriod     = 10;
input double  atrMultiplier = 1.5;
input bool useHeikinAshi    = true;
The first parameter specifies the ATR period used to measure market volatility. The second parameter specifies the ATR multiplier, which determines the distance of the trailing stop from the price. The third parameter allows the user to choose whether to use standard or Heikin Ashi candle prices for calculations. These parameters allow the sensitivity of the UT Bot Alerts system to be adjusted without modifying the source code.
Global Variables and Indicator Handles
The following section declares several global variables used throughout the indicator.
//+------------------------------------------------------------------+
//| Global Variables                                                 |
//+------------------------------------------------------------------+
ENUM_TIMEFRAMES timeframe = PERIOD_CURRENT;

int atrHandle;
double atrValues [];

int    heikinAshiIndicatorHandle;
double heikinAshiClose     [];
Two important handles are created in this section. One handle is used to access the built-in ATR indicator provided by the MetaTrader platform. The other handle is used to access the external Heikin Ashi indicator. These handles allow the indicator to retrieve data from other indicators without having to compute those values manually.
Two arrays are also declared. One array stores the ATR values retrieved from the ATR indicator. The other stores the Heikin Ashi closing prices retrieved from the Heikin Ashi indicator. These arrays will later serve as inputs for the trailing stop calculations.
Indicator Buffer Declarations
The next section declares the indicator buffers used by the implementation.
//+------------------------------------------------------------------+
//| Declaration of indicator buffers                                 |
//+------------------------------------------------------------------+
double SellSignalArrowBuffer[];
double BuySignalArrowBuffer [];

double CandleOpenBuffer [];
double CandleHighBuffer [];
double CandleLowBuffer  [];
double CandleCloseBuffer[];
double CandleColorIndexBuffer[];

double emaValues[];

double utBotTrendState[];

double lossDistance[];

double TrailingStop[];
Indicator buffers are arrays that store values displayed on the chart or used internally by the algorithm.
Several buffers are used for visualisation purposes. These include buffers for buy and sell signals, and colored candles that indicate the current trend state.
Additional buffers are used internally to store calculated values, such as the exponential moving average, trend direction, ATR Loss Distance, and trailing stop level.
Separating these buffers improves code readability and makes it easier to access specific components of the indicator from other programs.
Indicator Initialization
The initialization function prepares the indicator when it is first attached to a chart.
//+------------------------------------------------------------------+
//| Custom indicator initialization function                         |
//+------------------------------------------------------------------+
int OnInit()
  {

//--- Initialize the ATR indicator
   atrHandle = iATR(_Symbol, timeframe, atrPeriod);
   if(atrHandle == INVALID_HANDLE)
     {
      Print("Error while initializing the ATR indicator ", GetLastError());
      return(INIT_FAILED);
     }

// Initialize the Heikin Ashi indicator
   heikinAshiIndicatorHandle    = iCustom(_Symbol, timeframe, "::Indicators\\heikinAshiIndicator.ex5");
   if(heikinAshiIndicatorHandle == INVALID_HANDLE)
     {
      Print("Error while initializing The Heikin Ashi Indicator: ", GetLastError());
      return(INIT_FAILED);
     }

//--- Bind arrays to indicator buffers
   SetIndexBuffer(0, SellSignalArrowBuffer, INDICATOR_DATA);
   SetIndexBuffer(1, BuySignalArrowBuffer, INDICATOR_DATA);
   SetIndexBuffer(2, CandleOpenBuffer, INDICATOR_DATA);
   SetIndexBuffer(3, CandleHighBuffer, INDICATOR_DATA);
   SetIndexBuffer(4, CandleLowBuffer, INDICATOR_DATA);
   SetIndexBuffer(5, CandleCloseBuffer, INDICATOR_DATA);
   SetIndexBuffer(6, CandleColorIndexBuffer, INDICATOR_COLOR_INDEX);
   SetIndexBuffer(7, emaValues, INDICATOR_DATA);
   SetIndexBuffer(8, utBotTrendState, INDICATOR_CALCULATIONS);
   SetIndexBuffer(9, lossDistance, INDICATOR_CALCULATIONS);
   SetIndexBuffer(10, TrailingStop, INDICATOR_CALCULATIONS);

//-- Set all global arrays to non-timeseries
   SetNonTimeSeries();

   return(INIT_SUCCEEDED);
  }
//+------------------------------------------------------------------+
During initialization the indicator creates handles for the ATR indicator and the external Heikin Ashi indicator. If either handle fails to initialise correctly, the indicator reports an error and terminates safely.
The earlier declared indicator buffers are also registered during initialisation. This step connects the arrays defined in the source code to MetaTrader's internal buffer system.
Finally, all arrays are configured to use a non-time series indexing direction. In this arrangement, the oldest bar is stored at index zero, and newer bars appear at higher indices. This indexing style simplifies many calculations and makes the flow of data easier to understand.
The Calculation Function
The OnCalculate function is the indicator's core processing engine. It is called automatically by the MetaTrader platform whenever price data changes.
//+------------------------------------------------------------------+
//| Custom indicator iteration function                              |
//+------------------------------------------------------------------+
int OnCalculate(const int32_t rates_total,
                const int32_t prev_calculated,
                const datetime &time[],
                const double &open[],
                const double &high[],
                const double &low[],
                const double &close[],
                const long &tick_volume[],
                const long &volume[],
                const int32_t &spread[])
  {

//--- Temporary buffers used to store price data for rendering custom colored candles
   double utOpen [];
   double utHigh [];
   double utLow  [];
   double utClose[];

//--- Copy price data into local working buffers to safely manipulate candle values without altering the original price arrays
   ArrayCopy(utOpen, open);
   ArraySetAsSeries(utOpen, false);
   ArrayCopy(utHigh, high);
   ArraySetAsSeries(utHigh, false);
   ArrayCopy(utLow, low);
   ArraySetAsSeries(utLow, false);
   ArrayCopy(utClose, close);
   ArraySetAsSeries(utClose, false);

//--- This block is executed when the indicator is initially attached to a chart
   if(prev_calculated == 0)
     {

      //--- Start with clean buffers at first calculation
      ArrayInitialize(SellSignalArrowBuffer, EMPTY_VALUE);
      ArrayInitialize(BuySignalArrowBuffer,  EMPTY_VALUE);
      ArrayInitialize(CandleOpenBuffer,      EMPTY_VALUE);
      ArrayInitialize(CandleHighBuffer,      EMPTY_VALUE);
      ArrayInitialize(CandleLowBuffer,       EMPTY_VALUE);
      ArrayInitialize(CandleCloseBuffer,     EMPTY_VALUE);
      ArrayInitialize(CandleColorIndexBuffer,EMPTY_VALUE);
      ArrayInitialize(emaValues,             EMPTY_VALUE);
      ArrayInitialize(utBotTrendState,       EMPTY_VALUE);
      ArrayInitialize(atrValues,             EMPTY_VALUE);
      ArrayInitialize(heikinAshiClose,       EMPTY_VALUE);
      ArrayInitialize(lossDistance,          EMPTY_VALUE);
      ArrayInitialize(TrailingStop,          EMPTY_VALUE);

      //--- Get all ATR values
      GetAllATRValues(rates_total);

      //--- Get all Heikin Ashi values
      GetAllHeikinAshiCloseValues(rates_total);

      //--- When using Heikin Ashi is enabled
      if(useHeikinAshi)
        {
        }

      //--- When using Heikin Ashi is disabled
      if(!useHeikinAshi)
        {
        }

     }

//--- This block is executed on every new bar open
   if(prev_calculated != rates_total && prev_calculated != 0)
     {

      //--- Get all ATR values
      GetAllATRValues(rates_total);

      //--- Get all Heikin Ashi values
      GetAllHeikinAshiCloseValues(rates_total);

      //--- When using Heikin Ashi is enabled
      if(useHeikinAshi)
        {
        }

      //--- When using Heikin Ashi is disabled
      if(!useHeikinAshi)
        {
        }
     }
   return(rates_total);
  }
//+------------------------------------------------------------------+
At the beginning of the function, temporary arrays are created to hold price data. The open, high, low, and close arrays provided by the terminal are copied into these local arrays, allowing the values to be manipulated safely without modifying the original data.
The function checks prev_calculated to determine whether this is the first run or a recalculation after a new bar.
When the indicator is first attached to a chart, all indicator buffers are initialised, and the historical ATR and Heikin Ashi values are retrieved. These values will later be used to compute the trailing stop and generate signals.
When a new bar appears, the indicator retrieves the latest ATR and Heikin Ashi data to keep calculations in sync with the latest market conditions.
The remaining sections of the algorithm will be gradually added to this function as development progresses.
Helper Functions
The final section of the boilerplate code contains several helper functions.
//+------------------------------------------------------------------+
//| Sets array indexing to non-timeseries (0 = oldest bar)           |
//+------------------------------------------------------------------+
void SetNonTimeSeries()
  {
   ArraySetAsSeries(atrValues, false);
   ArraySetAsSeries(heikinAshiClose, false);
   ArraySetAsSeries(SellSignalArrowBuffer, false);
   ArraySetAsSeries(BuySignalArrowBuffer, false);
   ArraySetAsSeries(CandleOpenBuffer, false);
   ArraySetAsSeries(CandleHighBuffer, false);
   ArraySetAsSeries(CandleLowBuffer, false);
   ArraySetAsSeries(CandleCloseBuffer, false);
   ArraySetAsSeries(CandleColorIndexBuffer, false);
   ArraySetAsSeries(emaValues, false);
   ArraySetAsSeries(utBotTrendState, false);
   ArraySetAsSeries(lossDistance, false);
   ArraySetAsSeries(TrailingStop, false);
  }


//+------------------------------------------------------------------+
//| Get all ATR values into global atrValues array                   |
//| Index 0 = oldest bar                                             |
//+------------------------------------------------------------------+
bool GetAllATRValues(int rates_total)
  {

// Copy entire ATR buffer
   int copied = CopyBuffer(atrHandle, 0, 0, rates_total, atrValues);

   if(copied <= 0)
     {
      Print("Failed to copy ATR data. Error: ", GetLastError());
      return false;
     }

   ArraySetAsSeries(atrValues, false);

   return true;
  }

//+------------------------------------------------------------------+
//| Get all Heikin Ashi close values into global heikinAshiClose     |
//| array Index 0 = oldest bar                                       |
//+------------------------------------------------------------------+
bool GetAllHeikinAshiCloseValues(int rates_total)
  {

//--- Copy entire Heikin Ashi buffer
   int copied = CopyBuffer(heikinAshiIndicatorHandle, 3, 0, rates_total, heikinAshiClose);

   if(copied <= 0)
     {
      Print("Error while copying Heikin Ashi Close prices: ", GetLastError());
      return false;
     }

   ArraySetAsSeries(heikinAshiClose, false);

   return true;
  }
//+------------------------------------------------------------------+
One function ensures that all arrays use non-time series indexing. Two additional functions retrieve ATR and Heikin Ashi values from their respective indicators and store them in the arrays declared earlier. These helper functions isolate repetitive tasks, making the main calculation logic easier to read.
Completing the UT Bot Alerts Indicator Implementation
With the boilerplate structure prepared earlier, the next step is to implement the core logic of the UT Bot Alerts indicator. This stage transforms the framework that was prepared earlier into a fully functional trading indicator.
The UT Bot Alerts indicator relies on several key components that work together to produce signals and visualize trend direction on the chart. These components include the exponential moving average used for signal detection, the ATR-based Loss Distance that controls the trailing stop, the trailing stop algorithm itself, candle coloring logic, and finally the signal generation mechanism.
Each of these components will be implemented as modular functions. This modular design keeps the logic clear and easier to maintain.
Implementing the EMA Calculation Engine
The original UT Bot Alerts indicator uses an exponential moving average with a period of one to detect signal crossovers. The same approach is implemented here. However, the built-in EMA indicator provided by MetaTrader cannot be used directly. The reason is that the built-in indicator calculates moving averages only from standard price data such as open, high, low, and close values.
In this implementation, the source price can optionally be derived from Heikin Ashi candles. Because of this flexibility, the EMA must be calculated manually using the standard exponential moving average formula.
A full explanation of the mathematical formula can be found in external references such as Investopedia. For this article, it is sufficient to understand that the EMA is calculated from the current price and the previous EMA value.
The first EMA value in history is normally initialized using a simple moving average. This initial value allows the recursive EMA formula to operate correctly for the rest of the data series.
Computing the Initial SMA Value
The first helper function calculates a simple moving average for a given range of values.
//+------------------------------------------------------------------+
//|Calculates a Simple Moving Average (SMA) over a specified period  |
//|starting from a given index in a non-timeseries price array.      |
//+------------------------------------------------------------------+
double CalculateSMA(const double &source[], const int startIndex, const int period)
  {

   double sum = 0.0;

   for(int i = startIndex; i < startIndex + period; i++)
     {
      sum += source[i];
     }

   return sum/period;
  }
This function receives a price array, a starting index, and the desired period. It sums the values across the specified range and divides the result by the number of elements. The returned value becomes the first EMA value in the series.
Computing Individual EMA Values
Once the first EMA value is established, subsequent EMA values can be computed using the standard exponential moving average formula.
//+------------------------------------------------------------------+
//|Computes a single Exponential Moving Average (EMA) value using the|
//| current price, previous EMA, and specified period.               |
//+------------------------------------------------------------------+
double CalculateEMAValue(const double price, const double prevEMA, const int period)
  {

   const double alpha = 2.0 / (period + 1.0);

   return (price * alpha) + (prevEMA * (1.0 - alpha));

  }
This function receives the current price, the previous EMA value, and the EMA period. It then calculates a smoothing factor and combines the current price with the previous EMA to produce the next EMA.
Computing Historical EMA Values
When the indicator is attached to a chart for the first time, historical EMA values must be calculated for all past bars.
//+------------------------------------------------------------------+
//|Computes and fills all historical EMA values up to the last       |
//|closed bar using SMA initialization to prevent repainting.        |
//+------------------------------------------------------------------+
void CalculateHistoricalEMA(const double &source[], const int rates_total, const int period)
  {

//--- Safety check
   if(rates_total < period)
      return;

//--- First EMA seed using SMA
   const int firstEMAIndex = period - 1;
   emaValues[firstEMAIndex] = CalculateSMA(source, 0, period);

//--- Calculate EMA forward up to the last CLOSED bar
   for(int i = firstEMAIndex + 1; i <= rates_total - 2; i++)
     {
      emaValues[i] = CalculateEMAValue(
                        source[i],
                        emaValues[i - 1],
                        period
                     );
     }
  }
The function first checks that there are enough bars to compute the EMA. The first EMA value is initialised using the simple moving average function described earlier. After initialization, the function iterates through the remaining bars and computes EMA values sequentially. Each new value depends on the previous EMA value, ensuring the calculation remains consistent with the standard EMA formula. The computed values are stored in the emaValues buffer.
Updating EMA When a New Bar Appears
Once the historical EMA values are calculated, they must not be recalculated again. Recomputing past values could lead to repainting behavior. Instead, only the most recently closed bar must be updated whenever a new candle appears.
//+------------------------------------------------------------------+
//|Updates the EMA value for the most recently closed bar when a new |
//| bar opens to finalize historical EMA values.                     |
//+------------------------------------------------------------------+
void UpdateEMAOnNewBar(const double &source[], const int rates_total, const int period)
  {

   const int closedBarIndex  = rates_total - 2;
   const int currentBarIndex = rates_total - 1;

   emaValues[closedBarIndex] = CalculateEMAValue(source[closedBarIndex], emaValues[closedBarIndex - 1], period);

   emaValues[currentBarIndex]= EMPTY_VALUE;

  }
This function calculates the EMA for the most recently closed bar using the previous EMA and the new price. The EMA value of the current forming candle is cleared to prevent premature calculations.
Calculating the ATR-Based Loss Distance
The next component required by the UT Bot algorithm is the Loss Distance. The Loss Distance defines how far the trailing stop should remain from the price. It is calculated by multiplying the ATR value by the user-defined multiplier.
Loss Distance = ATR Value * ATR Multiplier
This distance adjusts automatically according to market volatility. When volatility increases, the trailing stop moves farther from the price. When volatility decreases, the trailing stop moves closer.
Computing Historical Loss Distances
//+------------------------------------------------------------------+
//| Computes and fills historical Loss Distance values up to the     |
//| last closed bar using ATR values and the user-defined multiplier |
//+------------------------------------------------------------------+
void CalculateHistoricalLossDistance(const int rates_total)
  {

   if(rates_total <= 1)
     {
      return;
     }

   const int lastClosedBar = rates_total - 2;

   for(int i = 0; i <= lastClosedBar; i++)
     {
      lossDistance[i] = atrValues[i] * atrMultiplier;
     }

  }
This function calculates the Loss Distance for all historical bars by multiplying each ATR value by the ATR multiplier. The resulting values are stored inside the lossDistance buffer and later used by the trailing stop algorithm.
Updating Loss Distance on a New Bar
When a new candle forms, the loss distance for the recently closed bar must be updated.
//+------------------------------------------------------------------+
//| Updates the Loss Distance value for the most recently closed     |
//| bar when a new bar is formed                                     |
//+------------------------------------------------------------------+
void UpdateLossDistanceOnNewBar(const int rates_total){

   if(rates_total <= 1){
      return;
   }

   const int closedBarIndex = rates_total - 2;

   lossDistance[closedBarIndex] = atrValues[closedBarIndex] * atrMultiplier;

}
This function computes the Loss Distance for the most recently closed bar using the latest ATR value.
Implementing the Trailing Stop Engine
The trailing stop is the core component of the UT Bot Alerts indicator. The trailing stop behaves differently depending on the trend direction. During an upward trend, the stop follows the price from below. During a downward trend, the stop follows the price from above. When the price crosses the stop, the trend direction flips, and the stop moves to the opposite side of the price.
Initializing the Trailing Stop
The trailing stop must be initialized with a starting value.
//+------------------------------------------------------------------+
//| Initializes the first trailing stop value using the first        |
//| available source price to anchor the state machine safely        |
//+------------------------------------------------------------------+
void InitializeTrailingStop(const double &src[])
  {

   TrailingStop[0]     = src[0];
   utBotTrendState[0]  = 0;

  }
The first trailing stop value is set to the first available price. The trend state is also initialized. This establishes the starting point for the trailing stop calculations.
Computing Historical Trailing Stops
The following function calculates trailing stops for all historical bars.
//+------------------------------------------------------------------+
//| Computes historical trailing stop and trend state for all        |
//| closed bars using ATR-based loss distance and source prices      |
//+------------------------------------------------------------------+
void CalculateHistoricalTrailingStop(const double &src[], const int rates_total)
  {

   if(rates_total <= 2)
      return;

   for(int i = 1; i <= rates_total - 2; i++)
     {
      double prevStop = TrailingStop[i - 1];

      bool bullishContinuation =
         (src[i]   > prevStop &&
          src[i-1] > prevStop);

      bool bearishContinuation =
         (src[i]   < prevStop &&
          src[i-1] < prevStop);

      if(bullishContinuation)
        {
         TrailingStop[i] =
            MathMax(prevStop, src[i] - lossDistance[i]);

         utBotTrendState[i] = +1;
        }
      else
         if(bearishContinuation)
           {
            TrailingStop[i] =
               MathMin(prevStop, src[i] + lossDistance[i]);

            utBotTrendState[i] = -1;
           }
         else
           {
            // Trend Flip
            if(src[i] > prevStop)
              {
               TrailingStop[i] = src[i] - lossDistance[i];
               utBotTrendState[i] = +1;
              }
            else
              {
               TrailingStop[i] = src[i] + lossDistance[i];
               utBotTrendState[i] = -1;
              }
           }
     }
  }
The function evaluates three possible conditions for each bar. First, the algorithm checks whether the market is continuing in a bullish direction. In this situation, the trailing stop moves upward but never downward. Second, the algorithm checks for bearish continuation. In this case, the trailing stop moves downward but never upward. If neither condition is satisfied, the algorithm interprets this as a trend reversal. The trailing stop flips to the opposite side of the price, and the trend state changes accordingly.
The resulting stop levels are stored in the TrailingStop buffer while the trend direction is stored in the utBotTrendState buffer.
Updating Trailing Stop When a New Bar Forms
After historical values are calculated, the trailing stop must only update the most recently closed bar.
//+------------------------------------------------------------------+
//| Updates trailing stop and trend state for the most recently      |
//| closed bar when a new bar forms                                  |
//+------------------------------------------------------------------+
void UpdateTrailingStopOnNewBar(const double &src[], const int rates_total)
  {

   const int i = rates_total - 2;
   double prevStop = TrailingStop[i - 1];

   bool bullishContinuation =
      (src[i]   > prevStop &&
       src[i-1] > prevStop);

   bool bearishContinuation =
      (src[i]   < prevStop &&
       src[i-1] < prevStop);

   if(bullishContinuation)
     {
      TrailingStop[i] =
         MathMax(prevStop, src[i] - lossDistance[i]);

      utBotTrendState[i] = +1;
     }
   else
      if(bearishContinuation)
        {
         TrailingStop[i] =
            MathMin(prevStop, src[i] + lossDistance[i]);

         utBotTrendState[i] = -1;
        }
      else
        {
         if(src[i] > prevStop)
           {
            TrailingStop[i] = src[i] - lossDistance[i];
            utBotTrendState[i] = +1;
           }
         else
           {
            TrailingStop[i] = src[i] + lossDistance[i];
            utBotTrendState[i] = -1;
           }
        }
  }
This function applies the same trailing stop logic but only for the most recently closed bar.
Coloring Candles Based on Trend Direction
The UT Bot indicator visually represents trend direction by coloring candles according to the current trend state.
Coloring Historical Candles
//+------------------------------------------------------------------+
//| Colors historical candles according to UT Bot trend direction    |
//+------------------------------------------------------------------+
void ColorHistoricalCandles(const double &open[], const double &high[], const double &low[], const double &close[], const int rates_total)
  {

   for(int i = 0; i <= rates_total - 2; i++)
     {
      CandleOpenBuffer[i]  = open[i];
      CandleHighBuffer[i]  = high[i];
      CandleLowBuffer[i]   = low[i];
      CandleCloseBuffer[i] = close[i];

      if(utBotTrendState[i] == +1)
         CandleColorIndexBuffer[i] = 0;
      else
         if(utBotTrendState[i] == -1)
            CandleColorIndexBuffer[i] = 1;
     }
  }
This function copies the original candle values into the indicator buffers. It then assigns a color index depending on the detected trend state. By default, bullish candles are colored sea green while bearish candles are colored black.
Updating Candle Colors on New Bars
When a new bar appears, the color of the most recently closed candle must also be updated.
//+------------------------------------------------------------------+
//| Update the most recently closed bar                              |
//+------------------------------------------------------------------+
void UpdateCandleOnNewBar(const double &open[], const double &high[], const double &low[], const double &close[], const int rates_total)
  {

   const int i = rates_total - 2;

   CandleOpenBuffer [i]  = open [i];
   CandleHighBuffer [i]  = high [i];
   CandleLowBuffer  [i]  = low  [i];
   CandleCloseBuffer[i]  = close[i];

   CandleColorIndexBuffer[i] =
      (utBotTrendState[i] == +1) ? 0 : 1;
  }
This function updates the candle buffers for the most recently closed bar and assigns the appropriate colour index.
Generating Buy and Sell Signals
The final step in the algorithm is detecting crossovers between the EMA and the trailing stop. A crossover indicates a possible trend reversal and therefore generates a trading signal.
Detecting Historical Signals
//+------------------------------------------------------------------+
//| Detects historical crossovers and generates UT Bot signals       |
//+------------------------------------------------------------------+
void GenerateHistoricalSignals(const double &src[], const int rates_total)
  {

   for(int i = 1; i <= rates_total - 2; i++)
     {
      bool crossAbove =
         (emaValues[i-1] < TrailingStop[i-1] &&
          emaValues[i]   > TrailingStop[i]);

      bool crossBelow =
         (emaValues[i-1] > TrailingStop[i-1] &&
          emaValues[i]   < TrailingStop[i]);

      if(src[i] > TrailingStop[i] && crossAbove)
         BuySignalArrowBuffer[i] = CandleLowBuffer[i];

      if(src[i] < TrailingStop[i] && crossBelow)
         SellSignalArrowBuffer[i] = CandleHighBuffer[i];
     }
  }
This function scans historical data and checks whether the EMA crossed above or below the trailing stop. If the EMA crosses above the stop and the price remains above the stop, a buy signal is recorded. A buy arrow is placed below the candle.
If the EMA crosses below the stop and the price remains below the stop, a sell signal is recorded. A sell arrow is placed above the candle.
Updating Signals When a New Bar Appears
//+------------------------------------------------------------------+
//| Detect crossover in real time when a new candle forms            |
//+------------------------------------------------------------------+
void UpdateSignalOnNewBar(const double &src[], const int rates_total)
  {
   const int i = rates_total - 2;

   bool crossAbove =
      (emaValues[i-1] < TrailingStop[i-1] &&
       emaValues[i]   > TrailingStop[i]);

   bool crossBelow =
      (emaValues[i-1] > TrailingStop[i-1] &&
       emaValues[i]   < TrailingStop[i]);

   BuySignalArrowBuffer[i]  = EMPTY_VALUE;
   SellSignalArrowBuffer[i] = EMPTY_VALUE;

   if(src[i] > TrailingStop[i] && crossAbove)
      BuySignalArrowBuffer[i] = CandleLowBuffer[i];

   if(src[i] < TrailingStop[i] && crossBelow)
      SellSignalArrowBuffer[i] = CandleHighBuffer[i];
  }
This function performs the same crossover detection but only for the most recently closed bar.
Integrating the Logic Into the Calculation Engine
After defining all the required helper functions, the next step is to integrate them into the OnCalculate function.
//+------------------------------------------------------------------+
//| Custom indicator iteration function                              |
//+------------------------------------------------------------------+
int OnCalculate(const int32_t rates_total,
                const int32_t prev_calculated,
                const datetime &time[],
                const double &open[],
                const double &high[],
                const double &low[],
                const double &close[],
                const long &tick_volume[],
                const long &volume[],
                const int32_t &spread[])
  {

//--- Temporary buffers used to store price data for rendering custom colored candles
   double utOpen [];
   double utHigh [];
   double utLow  [];
   double utClose[];

//--- Copy price data into local working buffers to safely manipulate candle values without altering the original price arrays
   ArrayCopy(utOpen, open);
   ArraySetAsSeries(utOpen, false);
   ArrayCopy(utHigh, high);
   ArraySetAsSeries(utHigh, false);
   ArrayCopy(utLow, low);
   ArraySetAsSeries(utLow, false);
   ArrayCopy(utClose, close);
   ArraySetAsSeries(utClose, false);

//--- This block is executed when the indicator is initially attached to a chart
   if(prev_calculated == 0)
     {

      //--- Start with clean buffers at first calculation
      ArrayInitialize(SellSignalArrowBuffer, EMPTY_VALUE);
      ArrayInitialize(BuySignalArrowBuffer,  EMPTY_VALUE);
      ArrayInitialize(CandleOpenBuffer,      EMPTY_VALUE);
      ArrayInitialize(CandleHighBuffer,      EMPTY_VALUE);
      ArrayInitialize(CandleLowBuffer,       EMPTY_VALUE);
      ArrayInitialize(CandleCloseBuffer,     EMPTY_VALUE);
      ArrayInitialize(CandleColorIndexBuffer,EMPTY_VALUE);
      ArrayInitialize(emaValues,             EMPTY_VALUE);
      ArrayInitialize(utBotTrendState,       EMPTY_VALUE);
      ArrayInitialize(atrValues,             EMPTY_VALUE);
      ArrayInitialize(heikinAshiClose,       EMPTY_VALUE);
      ArrayInitialize(lossDistance,          EMPTY_VALUE);
      ArrayInitialize(TrailingStop,          EMPTY_VALUE);

      //--- Get all ATR values
      GetAllATRValues(rates_total);

      //--- Get all Heikin Ashi values
      GetAllHeikinAshiCloseValues(rates_total);

      //--- Get historical Loss Distances
      CalculateHistoricalLossDistance(rates_total);

      //--- When using Heikin Ashi is enabled
      if(useHeikinAshi)
        {
         CalculateHistoricalEMA(heikinAshiClose, rates_total, 1);
         InitializeTrailingStop(heikinAshiClose);
         CalculateHistoricalTrailingStop(heikinAshiClose, rates_total);
         ColorHistoricalCandles(utOpen, utHigh, utLow, utClose, rates_total);
         GenerateHistoricalSignals(heikinAshiClose, rates_total);
        }

      //--- When using Heikin Ashi is disabled
      if(!useHeikinAshi)
        {
         CalculateHistoricalEMA(utClose, rates_total, 1);
         InitializeTrailingStop(utClose);
         CalculateHistoricalTrailingStop(utClose, rates_total);
         ColorHistoricalCandles(utOpen, utHigh, utLow, utClose, rates_total);
         GenerateHistoricalSignals(close, rates_total);
        }

     }

//--- This block is executed on every new bar open
   if(prev_calculated != rates_total && prev_calculated != 0)
     {

      //--- Get all ATR values
      GetAllATRValues(rates_total);

      //--- Get all Heikin Ashi close values
      GetAllHeikinAshiCloseValues(rates_total);

      //--- Update historical Loss Distance for the recently closed bar
      UpdateLossDistanceOnNewBar(rates_total);

      //--- When using Heikin Ashi is enabled
      if(useHeikinAshi)
        {
         UpdateEMAOnNewBar(heikinAshiClose, rates_total, 1);
         UpdateTrailingStopOnNewBar(heikinAshiClose, rates_total);
         UpdateCandleOnNewBar(utOpen, utHigh, utLow, utClose, rates_total);
         UpdateSignalOnNewBar(heikinAshiClose, rates_total);
        }

      //--- When using Heikin Ashi is disabled
      if(!useHeikinAshi)
        {
         UpdateEMAOnNewBar(utClose, rates_total, 1);
         UpdateTrailingStopOnNewBar(utClose, rates_total);
         UpdateCandleOnNewBar(utOpen, utHigh, utLow, utClose, rates_total);
         UpdateSignalOnNewBar(utClose, rates_total);
        }

     }

   return(rates_total);
  }
The calculation engine performs two main tasks.
When the indicator runs for the first time, it calculates all historical values, including EMA values, Loss Distances, trailing stops, candle colors, and trading signals.
When a new bar appears, the engine updates only the most recently closed bar to maintain efficiency and avoid repainting behavior.
Configuring Indicator Visualization
After the algorithm is implemented, the indicator must be instructed how to display its buffers on the chart. This configuration is performed inside the initialization function using PlotIndexSet functions.
//+------------------------------------------------------------------+
//| Custom indicator initialization function                         |
//+------------------------------------------------------------------+
int OnInit()
  {

   ...

//--- Configure Graphic Plots
   PlotIndexSetInteger(0, PLOT_DRAW_TYPE, DRAW_ARROW);
   PlotIndexSetInteger(0, PLOT_ARROW, 234);
   PlotIndexSetInteger(0, PLOT_LINE_COLOR, clrBlack);
   PlotIndexSetInteger(0, PLOT_ARROW_SHIFT, -20);
   PlotIndexSetInteger(0, PLOT_LINE_WIDTH, 2);
   PlotIndexSetInteger(0, PLOT_SHOW_DATA, true);
   PlotIndexSetDouble(0, PLOT_EMPTY_VALUE, EMPTY_VALUE);
   PlotIndexSetString(0, PLOT_LABEL, "Sell Signal");

   PlotIndexSetInteger(1, PLOT_DRAW_TYPE, DRAW_ARROW);
   PlotIndexSetInteger(1, PLOT_ARROW, 233);
   PlotIndexSetInteger(1, PLOT_LINE_COLOR, clrSeaGreen);
   PlotIndexSetInteger(1, PLOT_ARROW_SHIFT, +20);
   PlotIndexSetInteger(1, PLOT_LINE_WIDTH, 2);
   PlotIndexSetInteger(1, PLOT_SHOW_DATA, true);
   PlotIndexSetDouble(1, PLOT_EMPTY_VALUE, EMPTY_VALUE);
   PlotIndexSetString(1, PLOT_LABEL, "Buy Signal");

   PlotIndexSetInteger(2, PLOT_DRAW_TYPE, DRAW_COLOR_CANDLES);
   PlotIndexSetInteger(2, PLOT_SHOW_DATA, true);
   PlotIndexSetDouble(2, PLOT_EMPTY_VALUE, EMPTY_VALUE);
   PlotIndexSetString(2, PLOT_LABEL, "Trend Direction");

   PlotIndexSetInteger(3, PLOT_DRAW_TYPE, DRAW_LINE);
   PlotIndexSetInteger(3, PLOT_LINE_STYLE, STYLE_DOT);
   PlotIndexSetInteger(3, PLOT_LINE_COLOR, clrBurlyWood);
   PlotIndexSetInteger(3, PLOT_LINE_WIDTH, 1);
   PlotIndexSetInteger(3, PLOT_SHOW_DATA, true);
   PlotIndexSetDouble(3, PLOT_EMPTY_VALUE, EMPTY_VALUE);
   PlotIndexSetString(3, PLOT_LABEL, "Custom EMA");

   return(INIT_SUCCEEDED);
  }
These commands specify the graphical representation of each buffer, including arrows for signals, colored candles for trend visualization, and a line for the EMA.
A color palette is also defined for the custom candles.
#property indicator_color3 clrSeaGreen, clrBlack
General Indicator Settings
The following commands assign general properties to the indicator.
//+------------------------------------------------------------------+
//| Custom indicator initialization function                         |
//+------------------------------------------------------------------+
int OnInit()
  {

   ...

//--- General indicator configurations
   IndicatorSetString(INDICATOR_SHORTNAME, "UT Bot Alerts");
   IndicatorSetInteger(INDICATOR_DIGITS, Digits());

   return(INIT_SUCCEEDED);
  }
These settings control how the indicator appears in the platform interface.
Configuring the Chart Appearance
For improved visibility, the indicator also adjusts the chart colors automatically when it is attached. The function ConfigureChartAppearance sets the chart background, grid visibility, and candle colors to ensure good visual contrast between bullish and bearish trends.
//+------------------------------------------------------------------+
//| This function configures the chart's appearance.                 |
//+------------------------------------------------------------------+
bool ConfigureChartAppearance()
  {
   if(!ChartSetInteger(0, CHART_COLOR_BACKGROUND, clrWhite))
     {
      Print("Error while setting chart background, ", GetLastError());
      return false;
     }

   if(!ChartSetInteger(0, CHART_SHOW_GRID, false))
     {
      Print("Error while setting chart grid, ", GetLastError());
      return false;
     }

   if(!ChartSetInteger(0, CHART_MODE, CHART_CANDLES))
     {
      Print("Error while setting chart mode, ", GetLastError());
      return false;
     }

   if(!ChartSetInteger(0, CHART_COLOR_FOREGROUND, clrBlack))
     {
      Print("Error while setting chart foreground, ", GetLastError());
      return false;
     }

   if(!ChartSetInteger(0, CHART_COLOR_CANDLE_BULL, clrWhite))
     {
      Print("Error while setting bullish candles color, ", GetLastError());
      return false;
     }

   if(!ChartSetInteger(0, CHART_COLOR_CANDLE_BEAR, clrWhite))
     {
      Print("Error while setting bearish candles color, ", GetLastError());
      return false;
     }

   if(!ChartSetInteger(0, CHART_COLOR_CHART_UP, clrSeaGreen))
     {
      Print("Error while setting bearish candles color, ", GetLastError());
      return false;
     }

   if(!ChartSetInteger(0, CHART_COLOR_CHART_DOWN, clrBlack))
     {
      Print("Error while setting bearish candles color, ", GetLastError());
      return false;
     }

   return true;
  }
The function returns a Boolean value indicating whether the configuration was applied successfully. It is then called from inside the Initialization function.
//+------------------------------------------------------------------+
//| Custom indicator initialization function                         |
//+------------------------------------------------------------------+
int OnInit(){

   ...

   //--- To configure the chart's appearance
   if(!ConfigureChartAppearance()){
      Print("Error while configuring chart appearance: ", GetLastError());
      return INIT_FAILED;
   }

   return(INIT_SUCCEEDED);
}
Indicator Deinitialization
The OnDeinit function is executed when the indicator is removed from the chart.
//+------------------------------------------------------------------+
//| Deinitialization function                                        |
//+------------------------------------------------------------------+
void OnDeinit(const int reason)
  {

//--- Release ATR
   if(atrHandle != INVALID_HANDLE)
     {
      IndicatorRelease(atrHandle);
     }

//--- Free up memory used by indicators
   if(heikinAshiIndicatorHandle != INVALID_HANDLE)
     {
      IndicatorRelease(heikinAshiIndicatorHandle);
     }

  }
This function releases the handles for the ATR and Heikin Ashi indicators. Releasing these handles ensures that the indicator's memory is properly freed and prevents resource leaks in the MetaTrader terminal.
Finalizing the Implementation
At this point, the UT Bot Alerts indicator is fully implemented. The source code can now be compiled inside MetaEditor. If the implementation was followed correctly, the indicator should compile successfully.
If compilation problems occur, the attached source file, ciw_uTBotAlerts.mq5, can be used as a reference to verify the code structure.
In the next section, the indicator will be tested on historical data, and the visual behavior will be verified directly on the chart.
Visual Testing
After completing the implementation, the source code should be compiled in MetaEditor. If the compilation process completes successfully, the indicator will appear under Custom Indicators in the Navigator window of the MetaTrader 5 terminal.
The indicator can then be attached to any chart for testing. For this example, the indicator was applied to the GBPUSD chart on the one-hour timeframe.

The figure above shows the indicator rendered on the price chart. Candles are colored according to the detected trend direction. During a bullish trend, all candles appear in sea green, while candles during a bearish trend appear in black. This consistent colouring helps highlight the prevailing market direction.
Signal arrows are displayed when a crossover between the EMA and the trailing stop occurs. A sea green arrow appears below the candle when a bullish signal is generated. A black arrow appears above the candle when a bearish signal is generated. These arrows mark the bars where the indicator detects a transition in trend direction.
This visual test confirms that the indicator renders correctly and that the signals and trend colors appear as expected on the chart.
Conclusion
In this article, the UT Bot Alerts indicator was implemented from the ground up using MQL5. The goal of this implementation was not only to replicate the behavior of the original indicator, but also to structure the code in a way that makes it practical for developers building automated trading systems.
Throughout the development process, the indicator was designed to address several limitations commonly found in many existing implementations. As a result, the final indicator provides the following improvements:
- Historical signals remain stable once a candle closes, ensuring the indicator does not repaint and can be safely used in automated trading systems.
- Clearly defined and documented indicator buffers provide direct access to signals, trend direction, and trailing stop values.
- Separating the calculation logic from the visualisation logic improves code readability and simplifies future modifications.
- The modular implementation structure makes it easier to extend the indicator or reuse individual components in other projects.
The indicator can be integrated directly into Expert Advisors, trading dashboards, scanners, and other automated trading tools without requiring developers to rewrite the UT Bot Alerts algorithm.
By addressing these challenges, this implementation provides a reliable and reusable UT Bot Alerts indicator for the MetaTrader 5 platform.
In the next article of this series, the focus will shift from indicator development to automation. An Expert Advisor will be developed that uses the UT Bot Alerts indicator as its signal source. This will demonstrate how the indicator can be integrated into a complete trading system and how developers can build automated strategies around its signals.
Attachments
| Attachment | Location inside ZIP | Purpose |
|---|---|---|
| MQL5.zip | Root attachment | Contains the full source-code folder structure required to compile the article example correctly. |
| ciw_utBotAlerts.mq5 | MQL5/Indicators/ciw_utBotAlerts.mq5 | Main UT Bot Alerts custom indicator discussed in the article. This is the indicator readers compile and attach to the chart. |
| heikinAshiIndicator.mq5 | MQL5/Indicators/heikinAshiIndicator.mq5 | Supporting the Heikin Ashi indicator required by ciw_utBotAlerts.mq5. It must be compiled first so MetaEditor can generate the required .ex5 resource file. |
Warning: All rights to these materials are reserved by MetaQuotes Ltd. Copying or reprinting of these materials in whole or in part is prohibited.
This article was written by a user of the site and reflects their personal views. MetaQuotes Ltd is not responsible for the accuracy of the information presented, nor for any consequences resulting from the use of the solutions, strategies or recommendations described.

 Extreme Value Theory in MQL5: Building a Tail-Risk Crash Gauge Beyond Monte Carlo VaR
 Market Simulation (Part 23): Position View (I)
 Reimagining Classic Strategies (Part 22): Ensemble Mean Reverting Strategy
 From Basic to Intermediate: Objects (IV)

- Free trading apps
- Over 8,000 signals for copying
- Economic news for exploring financial markets
You agree to website policy and terms of use