

From Basic to Intermediate: Objects (IV)
 1 205
1 205
 0
0

Introduction
In the previous article From Basic to Intermediate: Objects (III) we showed how to implement an indicator with a very simple purpose: to place a trend line on the chart easily, without opening the MetaTrader 5 menu.
I know that many people consider this content completely unnecessary. However, remember that the goal here is not to implement one specific thing, but to show how we can do it. Whether it is implemented and whether it brings practical benefit is only a detail. What matters most is that you, dear reader, understand that anyone can turn ideas into practice by studying and applying what these articles show.
What we saw and did in the previous article is only a small part of what we can truly achieve once we start programming our own applications for specific purposes. In this article, we will try to show something very interesting: an indicator hidden in MetaTrader 5 that almost no one knows exists.
So let us follow our usual ritual: put aside anything that might distract you while studying the article, and move on to the next section to see what this indicator is.
A Hidden Indicator in MetaTrader 5
Many people claim that MetaTrader 5 has few indicators or tools for market analysis. Personally, I strongly disagree with this. It is not the platform or its contents that are limited, but the narrow view of most people who always expect to find things ready-made and exactly as they imagine them.
MetaTrader 5 includes an element that almost no one notices because it is hidden inside another indicator. In fact, it is not exactly an indicator, but rather an analysis object. We need to open this object so that the hidden indicator — or rather, this analysis object — becomes visible. By default, it can be used in the form in which it is implemented in MetaTrader 5, but if we modify it correctly, the information it displays will become much clearer, because its purpose will be completely different from its original one.
I am referring specifically to the Fibonacci object. Of course, we could create what we are about to implement using trend lines, but with the Fibonacci object it is much easier to build the object we need.
So, to begin with, let us look at the indicator code we created in the previous article. It is shown below and will serve as the starting point for building another type of indicator:
01. //+------------------------------------------------------------------+
02. #property copyright "Daniel Jose"
03. //+------------------------------------------------------------------+
04. #define def_Prefix  "Demo"
05. //+------------------------------------------------------------------+
06. #define macro_NameObject  def_Prefix + (string)(ObjectsTotal(0) + 1)
07. //+------------------------------------------------------------------+
08. #include <Tutorial\File 01.mqh>
09. //+------------------------------------------------------------------+
10. st_Cross gl_Cross;
11. //+------------------------------------------------------------------+
12. int OnInit()
13. {
14.     gl_Cross.Init();
15.
16.     IndicatorSetString(INDICATOR_SHORTNAME, def_Prefix);
17.     ChartSetInteger(0, CHART_EVENT_MOUSE_MOVE, true);
18.     ChartSetInteger(0, CHART_CROSSHAIR_TOOL, false);
19.
20.     return INIT_SUCCEEDED;
21. };
22. //+------------------------------------------------------------------+
23. int OnCalculate(const int rates_total, const int prev_calculated, const int begin, const double &price[])
24. {
25.     return rates_total;
26. };
27. //+------------------------------------------------------------------+
28. void OnChartEvent(const int id, const long &lparam, const double &dparam, const string &sparam)
29. {
30.     st_TimePrice tp;
31.     static string isPaint = "";
32.
33.     switch (id)
34.     {
35.         case CHARTEVENT_KEYDOWN:
36.             if (TerminalInfoInteger(TERMINAL_KEYSTATE_ESCAPE)) gl_Cross.Hide();
37.             break;
38.         case CHARTEVENT_MOUSE_MOVE:
39.             if (((uchar)sparam & MOUSE_MIDDLE) != 0)
40.             {
41.                 tp = gl_Cross.Move((ushort)lparam, (ushort)dparam);
42.                 if (isPaint == "")
43.                 {
44.                     ObjectCreate(0, isPaint = macro_NameObject, OBJ_TREND, 0, tp.Time, tp.Price);
45.                     ObjectSetInteger(0, isPaint, OBJPROP_SELECTABLE, true);
46.                     ObjectSetInteger(0, isPaint, OBJPROP_COLOR, clrMagenta);
47.                     ObjectSetInteger(0, isPaint, OBJPROP_WIDTH, 3);
48.                     ObjectSetInteger(0, isPaint, OBJPROP_RAY_RIGHT, true);
49.                 }
50.                 ObjectMove(0, isPaint, 1, tp.Time, tp.Price);
51.                 gl_Cross.Show();
52.             }else
53.             {
54.                 isPaint = "";
55.                 gl_Cross.Hide();
56.             }
57.             break;
58.         case CHARTEVENT_MOUSE_WHEEL:
59.             break;
60.     }
61.     ChartRedraw();
62. };
63. //+------------------------------------------------------------------+
64. void OnDeinit(const int reason)
65. {
66.     ChartSetInteger(0, CHART_EVENT_MOUSE_MOVE, false);
67.     ChartSetInteger(0, CHART_CROSSHAIR_TOOL, true);
68.
69.     gl_Cross.Hide();
70.
71.     if (reason == REASON_REMOVE)
72.         ObjectsDeleteAll(0, def_Prefix);
73. };
74. //+------------------------------------------------------------------+
Code 01
Although this code works, it has one small drawback for most users: it creates the object we want to add to the chart using the middle mouse button. This is not very familiar, since the left button is usually used for such actions. However, this is only a minor detail that does not concern us right now. To be able to use the left button, we would have to change some aspects of how the code works, but we will do that later.
At the moment, we want to replace the OBJ_TREND object with OBJ_FIBO. With this simple replacement, we get the following:
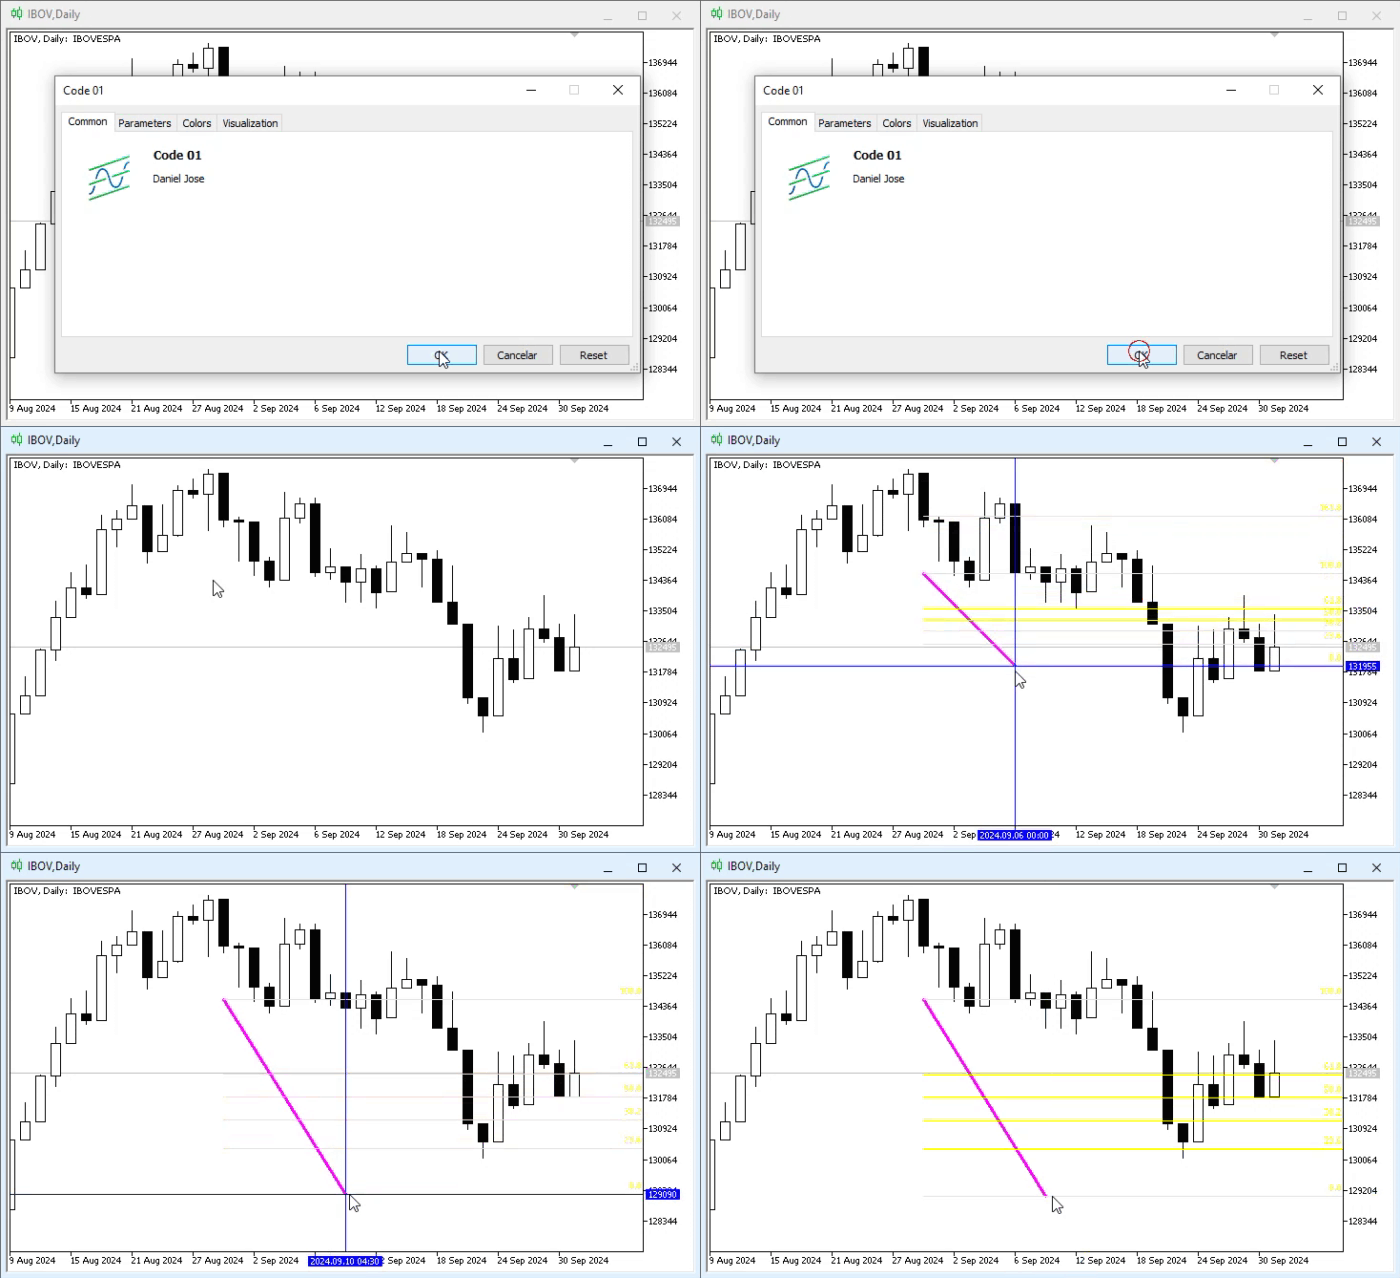
Animation 01
Please note that we have moved from a trend line to a Fibonacci object. However, we do not intend to use the created object in this form, because the object we want to develop is based on this Fibonacci object, but is not exactly the same. We are going to create a modification of the Fibonacci object. To simplify this task, we will start with the code below.
001. //+------------------------------------------------------------------+
002. #property copyright "Daniel Jose"
003. //+------------------------------------------------------------------+
004. #define def_Prefix  "Demo"
005. //+------------------------------------------------------------------+
006. #define macro_NameObject  def_Prefix + (string)(ObjectsTotal(0) + 1)
007. //+------------------------------------------------------------------+
008. #include <Tutorial\File 01.mqh>
009. //+------------------------------------------------------------------+
010. st_Cross gl_Cross;
011. //+------------------------------------------------------------------+
012. int OnInit()
013. {
014.     gl_Cross.Init();
015.
016.     IndicatorSetString(INDICATOR_SHORTNAME, def_Prefix);
017.     ChartSetInteger(0, CHART_EVENT_MOUSE_MOVE, true);
018.     ChartSetInteger(0, CHART_CROSSHAIR_TOOL, false);
019.
020.     return INIT_SUCCEEDED;
021. };
022. //+------------------------------------------------------------------+
023. int OnCalculate(const int rates_total, const int prev_calculated, const int begin, const double &price[])
024. {
025.     return rates_total;
026. };
027. //+------------------------------------------------------------------+
028. void OnChartEvent(const int id, const long &lparam, const double &dparam, const string &sparam)
029. {
030.     st_TimePrice tp;
031.     static string isPaint = "";
032.
033.     switch (id)
034.     {
035.         case CHARTEVENT_KEYDOWN:
036.             if (TerminalInfoInteger(TERMINAL_KEYSTATE_ESCAPE)) gl_Cross.Hide();
037.             break;
038.         case CHARTEVENT_MOUSE_MOVE:
039.             if (((uchar)sparam & MOUSE_MIDDLE) != 0)
040.             {
041.                 tp = gl_Cross.Move((ushort)lparam, (ushort)dparam);
042.                 if (isPaint == "")
043.                 {
044.                     ObjectCreate(0, isPaint = macro_NameObject, OBJ_FIBO, 0, tp.Time, tp.Price);
045.                     Modifier_OBJ_FIBO(isPaint);
046.                 }
047.                 ObjectMove(0, isPaint, 1, tp.Time, tp.Price);
048.                 gl_Cross.Show();
049.             }else
050.             {
051.                 isPaint = "";
052.                 gl_Cross.Hide();
053.             }
054.             break;
055.         case CHARTEVENT_MOUSE_WHEEL:
056.             break;
057.     }
058.     ChartRedraw();
059. };
060. //+------------------------------------------------------------------+
061. void OnDeinit(const int reason)
062. {
063.     ChartSetInteger(0, CHART_EVENT_MOUSE_MOVE, false);
064.     ChartSetInteger(0, CHART_CROSSHAIR_TOOL, true);
065.
066.     gl_Cross.Hide();
067.
068.     if (reason == REASON_REMOVE)
069.         ObjectsDeleteAll(0, def_Prefix);
070. };
071. //+------------------------------------------------------------------+
072. void Modifier_OBJ_FIBO(const string szNameObj)
073. {
074.     const double nLevels[] =
075.     {
076.         0,
077.         1,
078.         2.5
079.     };
080.     const string sLevels[] =
081.     {
082.         "Stop",
083.         "Enter",
084.         "Take"
085.     };
086.     const color cLevels[] =
087.     {
088.         clrRed,
089.         clrBlue,
090.         clrGreen
091.     };
092.
093.     ObjectSetInteger(0, szNameObj, OBJPROP_SELECTABLE, false);
094.     ObjectSetInteger(0, szNameObj, OBJPROP_COLOR, clrNONE);
095.     ObjectSetInteger(0, szNameObj, OBJPROP_WIDTH, 3);
096.     ObjectSetInteger(0, szNameObj, OBJPROP_RAY_RIGHT, true);
097.
098.     ObjectSetInteger(0, szNameObj, OBJPROP_LEVELS, nLevels.Size());
099.     for (uint c = 0; c < nLevels.Size(); c++)
100.     {
101.         ObjectSetDouble(0, szNameObj, OBJPROP_LEVELVALUE, c, nLevels[c]);
102.         ObjectSetInteger(0, szNameObj, OBJPROP_LEVELCOLOR, c, cLevels[c]);
103.         ObjectSetInteger(0, szNameObj, OBJPROP_LEVELWIDTH, c, 2);
104.         ObjectSetString(0, szNameObj, OBJPROP_LEVELTEXT, c, sLevels[c]);
105.     }
106. }
107. //+------------------------------------------------------------------+
Code 02
Code 02 is very interesting, especially because it almost completely implements the object I want to show. How is this possible? Dear reader, if you look carefully, you will see that on line 45 we call a procedure located on line 72. This procedure, let us say, looks somewhat untidy, because it is much less organized than I would initially like. Nevertheless, I think this makes it easier to understand how it works.
Before explaining how the procedure works, let us look at the result shown in the animation below:
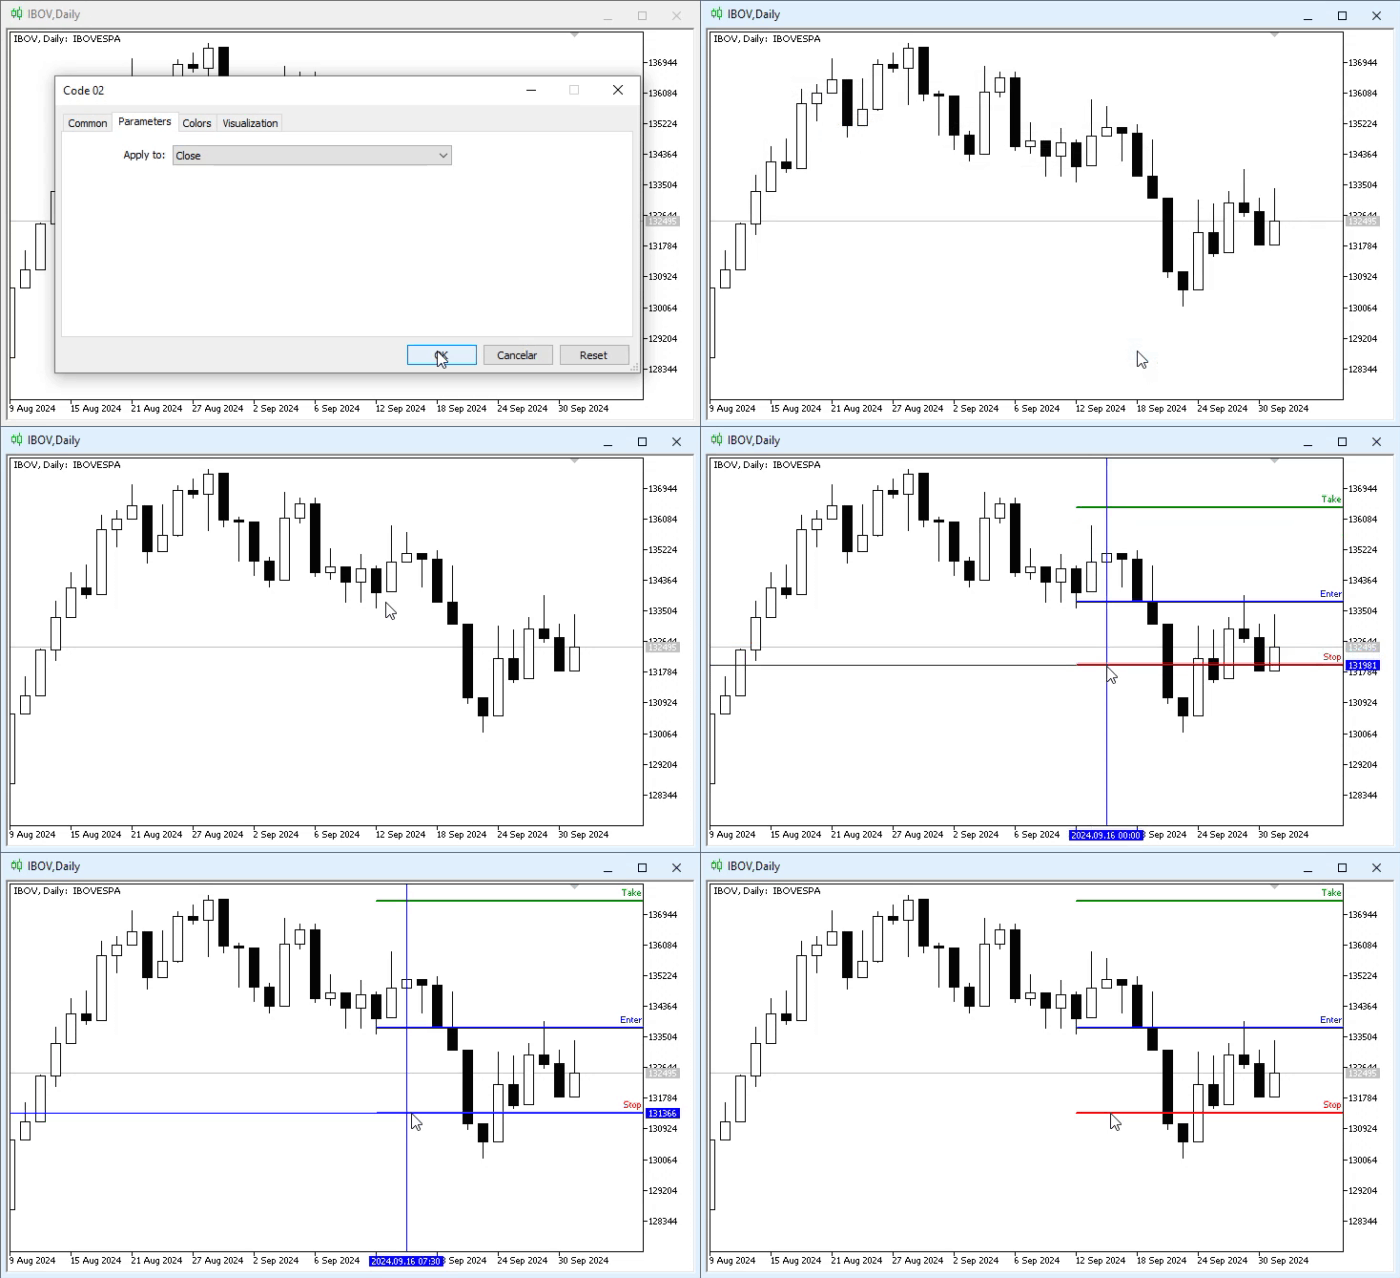
Animation 02
As you can see, the objective we want to implement is quite simple. What can this tool be used for? Many people use certain types of trading strategies in the market, and in many of these strategies the target and stop are very clearly defined. It is important to understand this in order to understand exactly what is being implemented and, above all, how to modify this implementation for specific purposes.
This modified OBJ_FIBO allows us to check exactly these kinds of conditions: before entering a trade, we can see where the entry order will be, where the stop should be, and where the target will be. With this, we can assess whether the trade is viable or not; an incorrectly placed stop will certainly be hit, just as an incorrectly calculated target will most likely not be reached.
Since some professional traders perform their analysis a few minutes before actually entering a trade, this tool proves very useful and indispensable, as it gives a precise idea of what to expect during the trade.
All right, but how was this tool created? And how can we improve it or adapt it to our working style? To understand this, let us now focus on the Modifier_OBJ_FIBO procedure, which starts on line 72 of Code 02.
There we can see that three arrays have been created. Each of them has its own purpose, and they are interconnected. Before looking at the purpose of each one, let us consider other aspects of the same procedure. On line 93, we changed a property of the OBJ_FIBO object so that the user cannot select it with a mouse click. This is important because we do not want the object to be moved after it has been placed.
However, this creates another problem: we will not be able to delete the object by clicking on it and then pressing the DELETE key. Nevertheless, it can be deleted from the window that displays the list of chart objects, or by removing the indicator from the chart.
Line 94 prevents the dotted line from being visible on the chart. This dotted line appears in Animation 01 in magenta, but when it is assigned the clrNONE color, it is no longer visible, although the object line itself still exists. The next two lines, 95 and 96, only change properties of the OBJ_FIBO object; there is nothing else to note here. Now we move on to the part that really interests us, namely line 98.
The OBJ_FIBO object consists of levels. It does not matter which Fibonacci object variant we use: in all cases, it is created from these levels. Since MetaTrader 5 does not know how many levels should be created, we use line 98 to tell it. At this point, the platform will know how many levels there should be. We can specify more or fewer levels; however, since here we are looking for the modification shown in Animation 02, we will use just a few levels, namely three.
Now pay attention. Each level has its own properties. Since these levels can be represented by trend lines or even curves with the same purpose, we can specify how each of these lines should be drawn on the chart and thus build the desired pattern.
And how is this pattern formed? This is where the object we are modifying becomes interesting. Please note that inside the loop we iterate through the arrays defined shortly before. Each of these arrays assigns a value to one of the properties of the line being created, which is fairly easy to understand. However, there is one detail that may be somewhat more difficult: the nLevels array defined on line 74.
The most difficult part of this array is precisely its values. "Why use these particular values? Could we not use other options?" To understand this, we first need to learn another aspect of Fibonacci numbers. In the Fibonacci object, we work with values from zero to one; everything within this range is displayed inside the standard Fibonacci grid familiar to everyone. However, we can assign values less than zero and greater than one, thereby creating an extended projection of the object itself. Note the following: when we start drawing the OBJ_FIBO object on the chart, the initial anchor point corresponds to the value one, and when we drag the object to create it, we get the position of the zero value.
This may seem strange, but that is how it works. Therefore, when we add the value 2.5, as shown on line 78, we are not telling it to create a projection two and a half times the distance between points one and zero, but one and a half times that distance.
In this way, we calculate the projection where the target of a possible trade will be located. If you want to use a 1:1 target ratio, you should specify the value two on line 78; thus, the same distance that exists between the entry point and the stop point will be projected as the target distance for the trade.
You may think this is crazy, and it really is, because it is very easy, for example, to include partial levels. You only need to add the corresponding values to the array declared on line 74. Remember that you will also need to adjust the other two arrays so that the display on the chart does not differ from what is expected when using the custom indicator in MetaTrader 5.
See? Not much is needed. All we really need is creativity and the desire to create something. Then, by applying the basic knowledge presented in the other articles of this series, we develop and implement our ideas. It is that simple.
What we are doing here is so interesting that we are not limited to what was shown above: we can go much further. To prove this, let us do the following: initially, the code presented as Code 02 generates something similar to what we saw in Animation 02; but if we replace only the contents of the Modifier_OBJ_FIBO procedure with something else, as in the code fragment below, what will happen?
                   .
                   .
                   .
71. //+------------------------------------------------------------------+
72. void Modifier_OBJ_FIBO(const string szNameObj)
73. {
74. #define macro_Mod_OBJ_FIBO(txt, pos, cor, width, style) {                       \
75.             ObjectSetDouble(0, szNameObj, OBJPROP_LEVELVALUE, levels, pos);     \
76.             ObjectSetInteger(0, szNameObj, OBJPROP_LEVELCOLOR, levels, cor);    \
77.             ObjectSetInteger(0, szNameObj, OBJPROP_LEVELWIDTH, levels, width);  \
78.             ObjectSetInteger(0, szNameObj, OBJPROP_LEVELSTYLE, levels, style);  \
79.             ObjectSetString(0, szNameObj, OBJPROP_LEVELTEXT, levels, txt);      \
80.             levels++;                                                           \
81.                                                         }
82.
83.     int levels = 0;
84.
85.     ObjectSetInteger(0, szNameObj, OBJPROP_SELECTABLE, false);
86.     ObjectSetInteger(0, szNameObj, OBJPROP_COLOR, clrNONE);
87.     ObjectSetInteger(0, szNameObj, OBJPROP_RAY_RIGHT, true);
88.
89.     macro_Mod_OBJ_FIBO("Stop", 0, clrRed, 2, STYLE_SOLID);
90.     macro_Mod_OBJ_FIBO("Enter", 1, clrBlue, 2, STYLE_DASH);
91.     macro_Mod_OBJ_FIBO("Partial", 1.5, clrYellowGreen, 1, STYLE_DASHDOTDOT);
92.     macro_Mod_OBJ_FIBO("Take", 2, clrGreen, 2, STYLE_SOLID);
93.     ObjectSetInteger(0, szNameObj, OBJPROP_LEVELS, levels);
94.
95. #undef macro_Mod_OBJ_FIBO
96. }
97. //+------------------------------------------------------------------+
Code 03
Since the rest of the code remains unchanged, in Code 03 we show only the part that really interests us. However, if we run the program with the changes made in Code 03, the result will be completely different, as can be seen in the following figure.
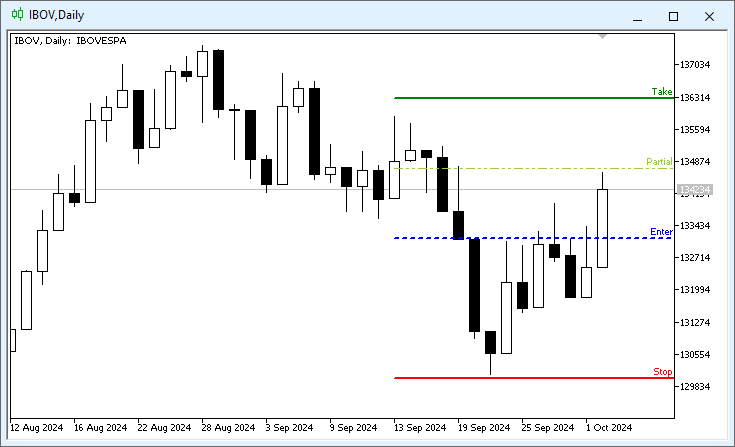
Figure 01
Please note that what we are doing, as shown in Figure 01, cannot be achieved by manipulating the Fibonacci object directly on the chart. In this case, the ratio between the stop point and the target is 1:1, with a partial exit at 50% of the distance.
The most difficult part is precisely the combination of colors and lines. If you do not believe it, try to reproduce this with a Fibonacci object inserted from the MetaTrader 5 menu, and you will see that it is impossible.
In this Code 03 scenario, the Modifier_OBJ_FIBO procedure is, in my view, much easier to modify and configure, because we use a macro that makes it very easy to create levels. Any new level can be added by placing it before line 93, so that MetaTrader 5 knows how many levels and which levels should be displayed on the chart.
"What you have shown is quite interesting, but I have a question. I understand that the goal of these articles is not to teach how to create a full-fledged application, but if we wanted the user to interact with this last indicator, how could we provide that? I ask because after compilation the set values can no longer be changed. How could we at least adjust the relationship between the stop and the target?" That is easy to explain; we have time to see how it can be done. To separate the topics, let us look at this in more detail.
Adjusting the Stop-Target Ratio
There are several ways to allow the user to specify the ratio between the stop and the target. One simple way is to use a double value, as shown below:
                   .
                   .
                   .
09. //+------------------------------------------------------------------+
10. input double user01 = 1.5;                  //Stop-Target Relationship
11. //+------------------------------------------------------------------+
                   .
                   .
                   .
73. //+------------------------------------------------------------------+
74. void Modifier_OBJ_FIBO(const string szNameObj)
75. {
76. #define macro_Mod_OBJ_FIBO(txt, pos, cor, width, style) {                       \
77.             ObjectSetDouble(0, szNameObj, OBJPROP_LEVELVALUE, levels, pos);     \
78.             ObjectSetInteger(0, szNameObj, OBJPROP_LEVELCOLOR, levels, cor);    \
79.             ObjectSetInteger(0, szNameObj, OBJPROP_LEVELWIDTH, levels, width);  \
80.             ObjectSetInteger(0, szNameObj, OBJPROP_LEVELSTYLE, levels, style);  \
81.             ObjectSetString(0, szNameObj, OBJPROP_LEVELTEXT, levels, txt);      \
82.             levels++;                                                           \
83.                                                         }
84.
85.     int levels = 0;
86.
87.     ObjectSetInteger(0, szNameObj, OBJPROP_SELECTABLE, false);
88.     ObjectSetInteger(0, szNameObj, OBJPROP_COLOR, clrNONE);
89.     ObjectSetInteger(0, szNameObj, OBJPROP_RAY_RIGHT, true);
90.
91.     macro_Mod_OBJ_FIBO("Stop", 0, clrRed, 2, STYLE_SOLID);
92.     macro_Mod_OBJ_FIBO("Enter", 1, clrBlue, 2, STYLE_DASH);
93.     macro_Mod_OBJ_FIBO("Partial", 1 + (user01 / 2), clrYellowGreen, 1, STYLE_DASHDOTDOT);
94.     macro_Mod_OBJ_FIBO("Take", 1 + user01, clrGreen, 2, STYLE_SOLID);
95.     ObjectSetInteger(0, szNameObj, OBJPROP_LEVELS, levels);
96.
97. #undef macro_Mod_OBJ_FIBO
98. }
99. //+------------------------------------------------------------------+
Code 04
This Code 04 fragment is the simplest way to establish a direct relationship between the stop and its target. All that was required was to add line 10 to the fragment and adjust lines 93 and 94 to generate the relationship. When we run Code 04, we get the result shown in the following figure:
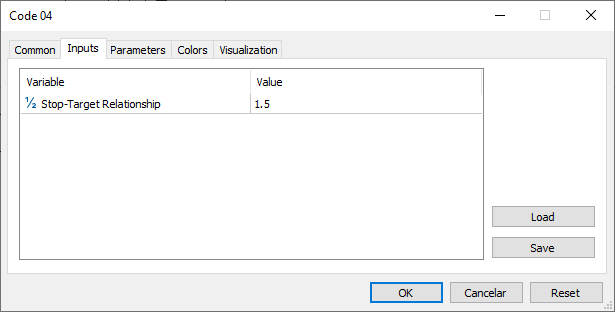
Figure 02
After adjusting the ratio shown in Figure 02, it can be used directly on the chart, and the result will be similar to what is shown in the figure below:
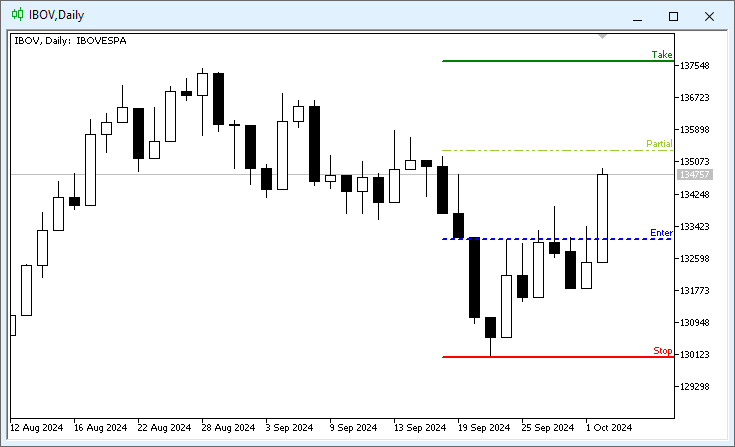
Figure 03
This is truly remarkable, considering how simple the approach is. You may be wondering what will happen if the user enters a ratio value below one; that is, if they want to trade in a context where the ratio between the stop and the target is unfavorable. What will happen, and what value should be specified for the indicator to work? I do not intend to encourage such a situation, but to obtain a ratio where the stop is greater than the final target, we can use something similar to what is shown in the figure below:
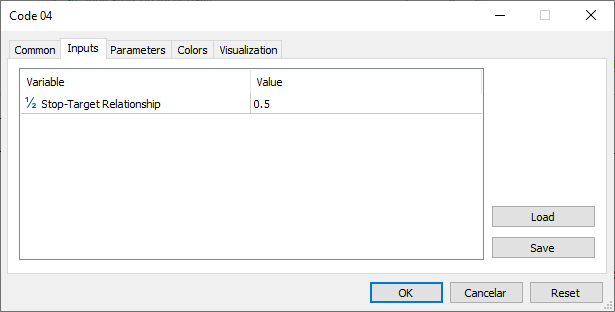
Figure 04
Since the value is less than one, the ratio is unfavorable. When applying the indicator to the chart, you will see a result similar to this:
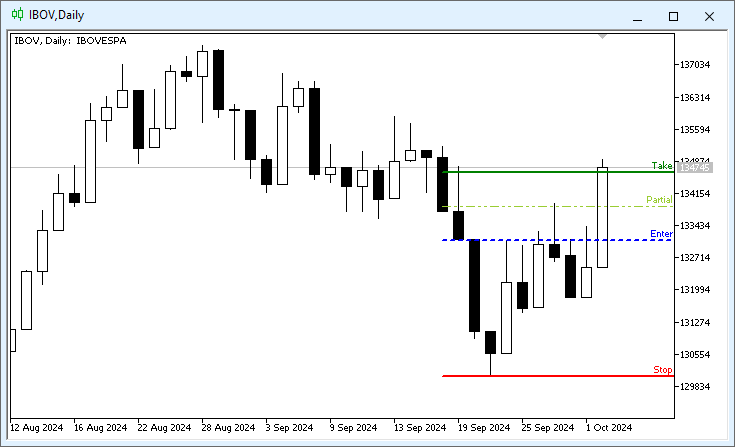
Figure 05
In this example, we used the same data as entry points; however, the resulting output is very different, as can be seen by comparing the figures. Thus, we get a practical and functional tool: we can place the application on the chart, perform an analysis, change the value (as in Figure 04), and repeat the analysis, which allows us to keep multiple analyses on the chart at the same time.
The only drawback may be that the lines intersect, but this is easily solved by allowing the user to draw, or not draw, the line extension to the right. To do this, it is enough to change the code as shown below:
                   .
                   .
                   .
09. //+------------------------------------------------------------------+
10. input double    user01 = 1.5;                   //Stop-Target Relationship
11. input bool      user02 = true;                  //Extend lines to the right
12. //+------------------------------------------------------------------+
                   .
                   .
                   .
73. //+------------------------------------------------------------------+
74. void Modifier_OBJ_FIBO(const string szNameObj)
75. {
76. #define macro_Mod_OBJ_FIBO(txt, pos, cor, width, style) {                       \
77.             ObjectSetDouble(0, szNameObj, OBJPROP_LEVELVALUE, levels, pos);     \
78.             ObjectSetInteger(0, szNameObj, OBJPROP_LEVELCOLOR, levels, cor);    \
79.             ObjectSetInteger(0, szNameObj, OBJPROP_LEVELWIDTH, levels, width);  \
80.             ObjectSetInteger(0, szNameObj, OBJPROP_LEVELSTYLE, levels, style);  \
81.             ObjectSetString(0, szNameObj, OBJPROP_LEVELTEXT, levels, txt);      \
82.             levels++;                                                           \
83.                                                         }
84.
85.     int levels = 0;
86.
87.     ObjectSetInteger(0, szNameObj, OBJPROP_SELECTABLE, false);
88.     ObjectSetInteger(0, szNameObj, OBJPROP_COLOR, clrNONE);
89.     ObjectSetInteger(0, szNameObj, OBJPROP_RAY_RIGHT, user02);
90.
91.     macro_Mod_OBJ_FIBO("Stop", 0, clrRed, 2, STYLE_SOLID);
92.     macro_Mod_OBJ_FIBO("Enter", 1, clrBlue, 2, STYLE_DASH);
93.     macro_Mod_OBJ_FIBO("Partial", 1 + (user01 / 2), clrYellowGreen, 1, STYLE_DASHDOTDOT);
94.     macro_Mod_OBJ_FIBO("Take", 1 + user01, clrGreen, 2, STYLE_SOLID);
95.     ObjectSetInteger(0, szNameObj, OBJPROP_LEVELS, levels);
96.
97. #undef macro_Mod_OBJ_FIBO
98. }
99. //+------------------------------------------------------------------+
Code 05
Again, this is a simple change in the Code 05 fragment; in this case, we add line 11. Its value is used on line 89 to control whether the line will be extended to the far right edge. The following figure shows a setting in which the line is not extended.
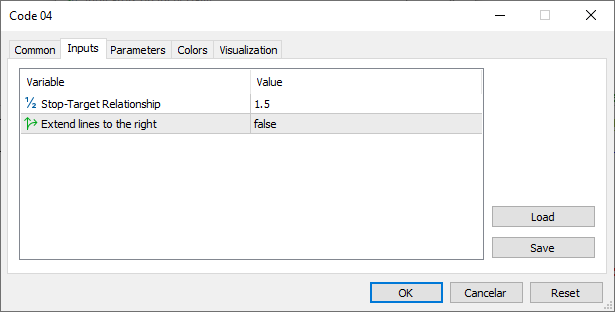
Figure 06
As a result, on the chart we get something like this:
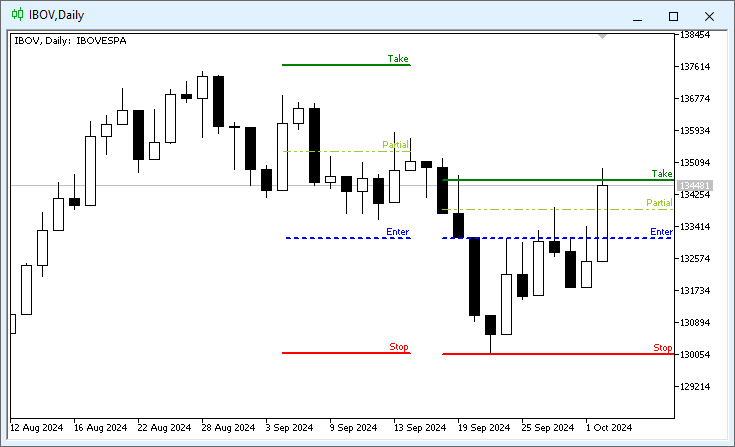
Figure 07
Please note: we add a new analysis in Figure 05, and although we changed the indicator settings (Figure 06) without removing it from the chart, this does not delete or affect what already existed. With just a little effort, we have created something truly interesting.
Although many people claim that some things are impossible in MetaTrader 5, we have just seen that almost anything can be done with minimal and basic knowledge, without using tricks or complex methods.
So, all of this has been very entertaining, but there is still one more issue that we will analyze in the next topic.
Using the Left Mouse Button to Create the Drawing
It may seem unnatural to use the middle mouse button to draw on the chart. Most users are used to interacting with the left button, so the middle button feels unfamiliar. Although everything works perfectly with the code we tested, it is not the most familiar option, and we, as programmers, need to fix this. However, there is one small nuance.
When the middle mouse button is pressed, all mouse events are routed to line 38, as shown in Code 02. While the button is held down, the crosshair remains visible, allowing the drawing to be created. When the middle button is released, line 52 of Code 02 removes the crosshair, indicating that we can no longer interact with the drawing system.
If you understand this, it becomes clear what we need to do: when the middle mouse button is pressed, an event is generated that must wait for a second event — either pressing the ESCAPE key or clicking the left mouse button — in order to create the drawing and position the object as before, but using the left button instead of the middle one.
That is the goal. There are many possible ways to do this, some more labor-intensive than others; since clarity for teaching purposes is the main priority here, we will choose the simplest path, even knowing that it is not ideal in all cases. This can be seen in the Code 06 fragment:
                   .
                   .
                   .
029. //+------------------------------------------------------------------+
030. void OnChartEvent(const int id, const long &lparam, const double &dparam, const string &sparam)
031. {
032. #define macro_CLEAN_EVENT   {                               \
033.             isPaint = "";                                   \
034.             gl_Cross.Hide();                                \
035.             bMouseL = false;                                \
036.                             }
037.
038.     st_TimePrice    tp;
039.     static string   isPaint = "";
040.     static bool     bMouseL = false;
041.
042.     switch (id)
043.     {
044.         case CHARTEVENT_KEYDOWN:
045.             if (TerminalInfoInteger(TERMINAL_KEYSTATE_ESCAPE)) macro_CLEAN_EVENT;
046.             break;
047.         case CHARTEVENT_MOUSE_MOVE:
048.             tp = gl_Cross.Move((ushort)lparam, (ushort)dparam);
049.             if (((uchar)sparam & MOUSE_LEFT) != 0)
050.             {
051.                 if (isPaint != "")
052.                 {
053.                     bMouseL = true;
054.                     if (!ObjectGetInteger(0, isPaint, OBJPROP_TIME)) ObjectMove(0, isPaint, 0, tp.Time, tp.Price);
055.                     ObjectMove(0, isPaint, 1, tp.Time, tp.Price);
056.                 }
057.             }else if (bMouseL) macro_CLEAN_EVENT;
058.             if ((((uchar)sparam & MOUSE_MIDDLE) != 0) && (isPaint == ""))
059.             {
060.                 ObjectCreate(0, isPaint = macro_NameObject, OBJ_FIBO, 0, 0, 0);
061.                 Modifier_OBJ_FIBO(isPaint);
062.                 gl_Cross.Show();
063.             }
064.             break;
065.         case CHARTEVENT_MOUSE_WHEEL:
066.             break;
067.     }
068.     ChartRedraw();
069.
070. #undef macro_CLEAN_EVENT
071. };
072. //+------------------------------------------------------------------+
                   .
                   .
                   .
Code 06
In it, we activate drawing with the middle button, but draw only when the left button is pressed. Not everything is perfect: the idea works, but it has a problem that can be seen in Animation 03:
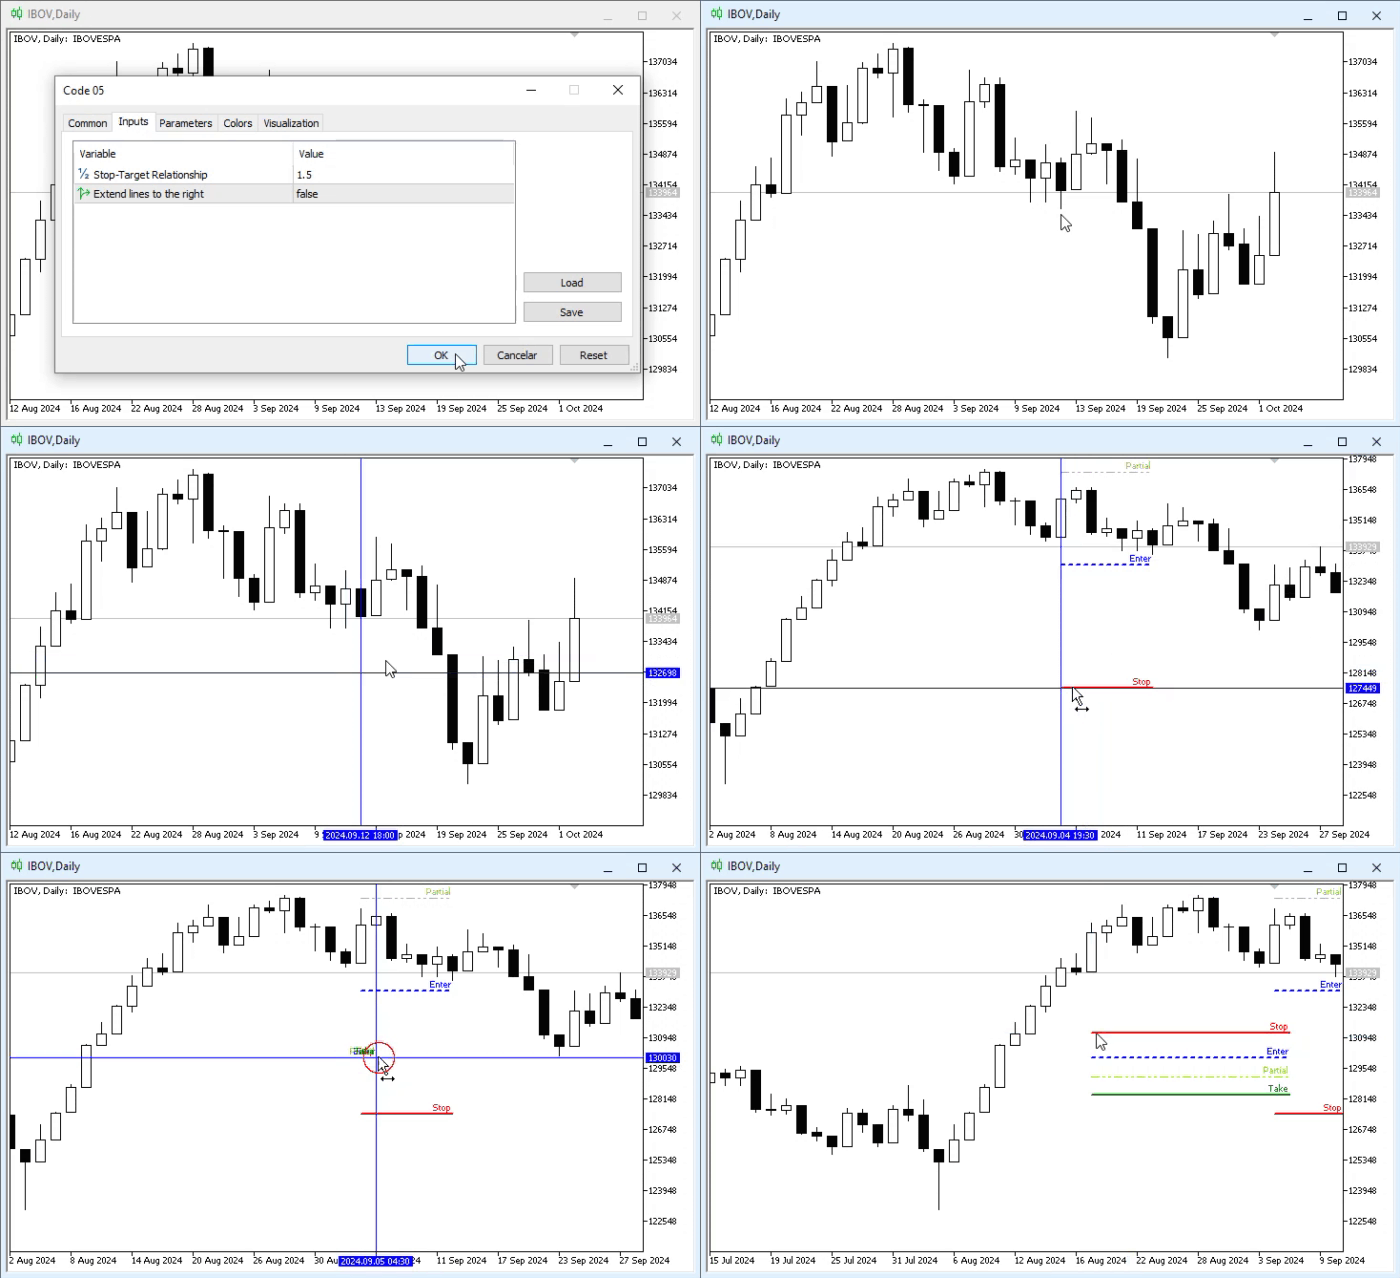
Animation 03
In this animation, the difficulty of drawing is noticeable because the chart shifts. Such movement is sometimes desirable, but in this case it hinders more than it helps. Before showing how to solve this, let us look at the changes needed to use the left button, as shown in Animation 03.
First, I added a macro on line 32 that allows the drawing creation event to be completed in its current state. Then, in mouse event handling, I changed the execution order so that events are processed correctly: first, the middle mouse button is pressed; at that moment, line 60 creates the OBJ_FIBO object, configures it as needed, and displays the crosshair.
At this point, if we press the left mouse button, the check on line 51 will be executed, and a new point will be marked on line 53; at the same time, lines 54 and 55 will place the OBJ_FIBO object on the chart. The marker created on line 53 allows line 57 to remove the crosshair from the chart immediately after the OBJ_FIBO object is drawn, that is, when the left button is released.
To fix what was shown in Animation 03, we need to modify the Code 06 fragment by adding two new lines. The changes are reflected in the following code fragment:
                   .
                   .
                   .
029. //+------------------------------------------------------------------+
030. void OnChartEvent(const int id, const long &lparam, const double &dparam, const string &sparam)
031. {
032. #define macro_CLEAN_EVENT   {                               \
033.             isPaint = "";                                   \
034.             gl_Cross.Hide();                                \
035.             bMouseL = false;                                \
036.             ChartSetInteger(0, CHART_MOUSE_SCROLL, true);   \
037.                             }
038.
039.     st_TimePrice    tp;
040.     static string   isPaint = "";
041.     static bool     bMouseL = false;
042.
043.     switch (id)
044.     {
045.         case CHARTEVENT_KEYDOWN:
046.             if (TerminalInfoInteger(TERMINAL_KEYSTATE_ESCAPE)) macro_CLEAN_EVENT;
047.             break;
048.         case CHARTEVENT_MOUSE_MOVE:
049.             tp = gl_Cross.Move((ushort)lparam, (ushort)dparam);
050.             if (((uchar)sparam & MOUSE_LEFT) != 0)
051.             {
052.                 if (isPaint != "")
053.                 {
054.                     bMouseL = true;
055.                     if (!ObjectGetInteger(0, isPaint, OBJPROP_TIME)) ObjectMove(0, isPaint, 0, tp.Time, tp.Price);
056.                     ObjectMove(0, isPaint, 1, tp.Time, tp.Price);
057.                 }
058.             }else if (bMouseL) macro_CLEAN_EVENT;
059.             if ((((uchar)sparam & MOUSE_MIDDLE) != 0) && (isPaint == ""))
060.             {
061.                 ObjectCreate(0, isPaint = macro_NameObject, OBJ_FIBO, 0, 0, 0);
062.                 ChartSetInteger(0, CHART_MOUSE_SCROLL, false);
063.                 Modifier_OBJ_FIBO(isPaint);
064.                 gl_Cross.Show();
065.             }
066.             break;
067.         case CHARTEVENT_MOUSE_WHEEL:
068.             break;
069.     }
070.     ChartRedraw();
071.
072. #undef macro_CLEAN_EVENT
073. };
074. //+------------------------------------------------------------------+
                   .
                   .
                   .
Code 07
When using Code 07, we get the result shown in the following animation:
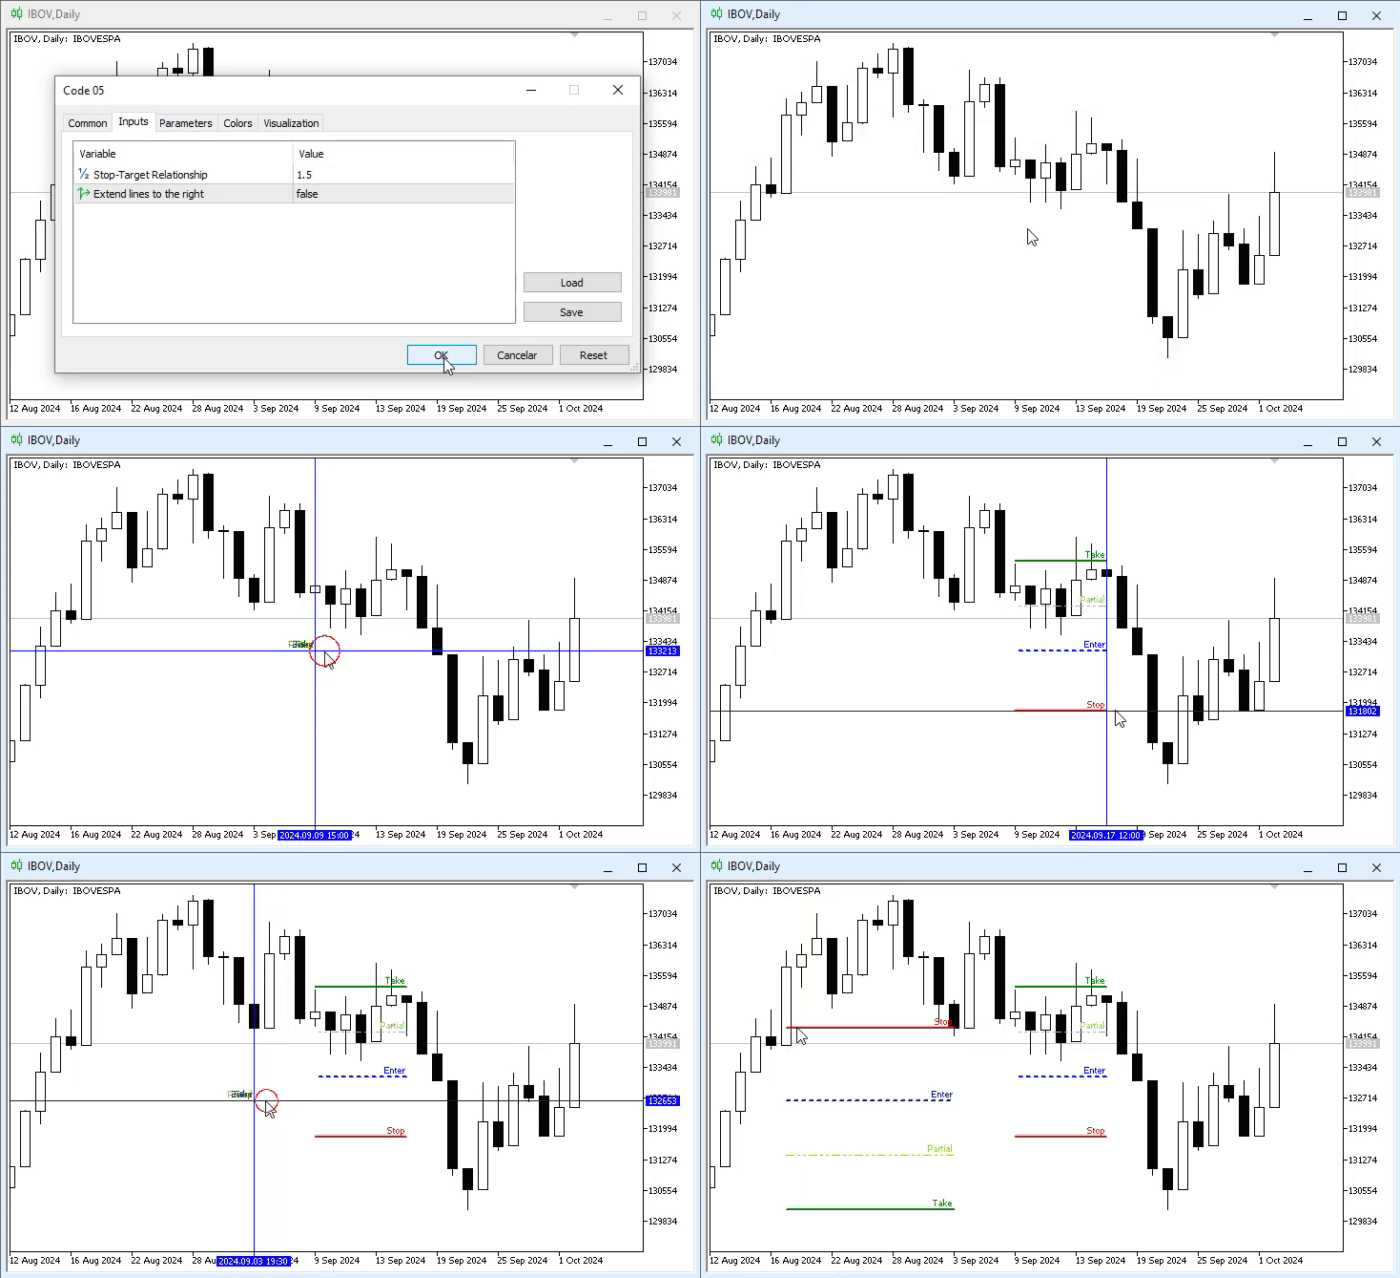
Animation 04
It may seem curious that the simple use of lines 36 and 62 in the Code 07 fragment solves the problem from Animation 03. If you think so, it is probably because you may not have tried what was presented in previous articles, where I already showed these very functions, among others. However, at that time we had not yet enabled and disabled the standard MetaTrader 5 configuration to provide interaction like the current one.
Final Thoughts
Perhaps this article has been the most entertaining one so far. Using only a small part of what has been seen and explained, we managed to implement something that is not available in MetaTrader 5 by default, which allowed us to create a very impressive indicator by modifying an existing object on the platform for other purposes.
I know that many people thought they would need to learn much more before programming something so interesting and, at the same time, so enjoyable. However, the work does not end here: the indicator we have presented still contains a small flaw. We left it this way intentionally so that you can practice fixing errors. We will explain what the problem is, but the solution will be up to you.
In the Code 07 fragment, line 61 creates the OBJ_FIBO object before the crosshair is displayed on line 64. The problem is that if the user, or you, presses the ESCAPE key, line 46 is executed and the crosshair is removed from the chart, but the OBJ_FIBO object created on line 61 remains in the object list, even though it is not visible because it has not been positioned.
Your task is to solve this so that the OBJ_FIBO object is added to the object list only if the left button is pressed after the middle mouse button has been pressed. Remember the problem that arose when creating the object after generating the crosshair, and how we showed a way to solve it?
The solution to this problem is very similar: it is enough to change the execution order of certain operations in the Code 07 fragment; there is no need to create any subroutines or add new functions or procedures. If the operations are reordered correctly, the crosshair can be removed and unnecessary creation of the OBJ_FIBO object can be prevented. Thus, the user can press the ESCAPE key, and the object list will not contain an invisible object that is not displayed on the chart.
The code used in this article can be found in the attachment. Practice solving this task, and we will see each other in the next article.
| MQ5 file | Description |
|---|---|
| Code 01 | Object demonstration |
| Code 02 | Object demonstration |
| Code 03 | Object demonstration |
| Code 04 | Object demonstration |
| Code 05 | Object demonstration |
Translated from Portuguese by MetaQuotes Ltd.
Original article: https://www.mql5.com/pt/articles/16026
Warning: All rights to these materials are reserved by MetaQuotes Ltd. Copying or reprinting of these materials in whole or in part is prohibited.
This article was written by a user of the site and reflects their personal views. MetaQuotes Ltd is not responsible for the accuracy of the information presented, nor for any consequences resulting from the use of the solutions, strategies or recommendations described.

 Market Simulation (Part 23): Position View (I)
 How to Connect AI Agents to MQL5 Algo Forge via MCP
 Custom Indicator Workshop (Part 3): Building the UT Bot Alerts Indicator in MQL5
 MQL5 Bootstrap (II): Essential Validators for Robust Trading Systems

- Free trading apps
- Over 8,000 signals for copying
- Economic news for exploring financial markets
You agree to website policy and terms of use