

Market Simulation (Part 23): Position View (I)
 3 075
3 075
 0
0

Introduction
Hello and welcome to another article in the series on how to create a replay/simulation system.
In the previous article, Market Simulation (Part 22): Getting Started with SQL (V), we completed the explanations of everything needed so that you can understand the material in the next articles. I know that the whole topic we discussed in the last articles is not so easy to understand the first time. And I think many of you did not even imagine that certain things could be done here in MQL5. Nevertheless, everything seen so far was only the tip of a huge iceberg. This is because I have talked only a little about sockets and a little about SQL.
In my opinion, the knowledge gained during this period will be useful to you in the next stages. From this point on, we will begin to address an even more complex topic. Even so, I will do my best not to make your life difficult, dear reader. At the same time, I truly want to motivate you to study and dive even deeper into what I will be showing from now on.
Take a deep breath and get ready, because now we are about to dive headfirst into the replay/simulation system. What I planned to show regarding the development of this system is already nearing its climax. In other words, there is very little left to show. But since the content is much more complex in terms of theory, I will try to present it as simply as possible. The programming part itself is quite simple and straightforward. But if you do not understand the theory behind it, you will be left with no practical basis at all for refining or adapting the replay/simulation system to tasks different from the ones I am going to show.
I do not want you merely to compile and use the code I present. I want you to learn, understand and, if possible, be able to create something better. I will not show how to do a number of things. This is because those things are models that I use in practice and that were specially developed to create, or rather implement, a trading system, the so-called Expert Advisor, which learns over time. It also develops its own trading approach, approaching what a human operator would do in practice.
In the last article, Market Simulation (Part 5): Creating the C_Orders Class (II), in the section that dealt with the replay/simulation system, we created a small Expert Advisor capable of interacting with the previously developed Chart Trade program. That was quite a long time ago. So, if you do not remember what the code looked like, let us quickly recall how everything turned out in the end. Let us start from this point. Everything developed from that moment until now will be used very soon. But let us remember how things were done before.
Recalling what has already been developed in the replay/simulation system
This is an important point, because without knowledge of what has already been developed, you will end up going back to parts that are already fully functional and do not need to be reviewed. Even so, I still plan to show how to do something specific. But we will talk about that another time. For now, let us look at what is already fully functioning.
The replay/simulation system consists of several separate applications. However, when combined, they allow you to interact with MetaTrader 5 almost as if you were connected to a demo or real account. Among these elements we can highlight the mouse pointer, which allows us to create analytical drawings on the chart or interact with chart elements, as well as Chart Trade, which can send market orders or requests for market execution through the Expert Advisor. This is because, when using the mouse pointer and Chart Trade, which is also an indicator, we can communicate through a messaging protocol with the Expert Advisor that is also on the chart.
These three applications, considered separately, are not very practical. But once they are on the chart, you can easily interact with MetaTrader 5 by sending market orders. However, when a position is opened or closed, this is still not displayed on the chart. Although that is not entirely true. We can rely on the visual indication shown by MetaTrader 5. But if you want to use a cross-order system—where orders are placed for a symbol other than the one currently displayed—you will be left with no adequate visual indication at all. This is because, when using cross-orders, we are looking at the chart of the symbol we are observing. However, the order or trade request is placed on another symbol whose chart is not open. At that moment, MetaTrader 5 can no longer help us with its built-in visual indication system.
The same happens when using the replay/simulation service. Although we can, and soon will, implement a way to visualize operations in the replay/simulation system, we do not yet have a suitable way to do this. The reason is simple: we do not have a visual indication system that would allow us to interact with orders or positions that may exist for this specific symbol, whether it is a real symbol or a simulated one, that is, a symbol through which we replay data.
Thus, although the replay/simulation system is already capable of performing its task, we first need to implement some way to visualize and interact with any position or order that may exist for this trading instrument. This is because, without this, creating an order system to support analysis within the replay/simulation system is completely useless. We would not be able to interact with orders or positions that exist for this symbol.
Therefore, creating this part becomes our top priority. Do not worry: first we will create a fairly simple system. A simple enough solution that will allow us to control the process while working on the replay/simulation system. So let us get started right now. To do this, let us create a new topic.
Creating a simple position indicator
We will start with the following: since our Chart Trade indicator is not focused on pending orders, but only on immediate order placement, we will begin by creating a basic indicator that shows open positions. So at this point we will not look at pending orders. We will focus only on open positions and on how to display them on the chart. It is worth emphasizing once again that the goal here is not to show what MetaTrader 5 already does. The idea is to show what MetaTrader 5 does not show us. Especially when using the cross-order system.
Before we start looking at the code we will implement, I would like to clarify that, at this stage, the goal is only to implement a function that allows price lines to be displayed. I am not creating a production-ready tool right now. That is, first we need to make the lines appear when there is only one open position. For now, we will not focus on managing many open positions. So I ask the most impatient readers to be patient for a while. The goal here will be to explain to beginners or enthusiasts how to make things work.
First, we will create a new file. You may think that it should be an Expert Advisor file, since we will be working with positions that may be present on the trading server. But no, we will not create an Expert Advisor. Let us create an indicator. The source code can be seen below:
01. //+------------------------------------------------------------------+
02. #property copyright "Daniel Jose"
03. #property description "Indicator for tracking an open position on the server."
04. #property version   "1.00"
05. #property indicator_chart_window
06. #property indicator_plots 0
07. //+------------------------------------------------------------------+
08. int OnInit()
09. {
10.     return INIT_SUCCEEDED;
11. }
12. //+------------------------------------------------------------------+
13. int OnCalculate(const int rates_total, const int prev_calculated, const int begin, const double &price[])
14. {
15.     return rates_total;
16. }
17. //+------------------------------------------------------------------+
18. void OnDeinit(const int reason)
19. {
20. }
21. //+------------------------------------------------------------------+
Source code
Looking at this, you may think: "have you gone crazy or completely lost your mind? There is no way to use an indicator for something like this." Calm down, dear reader, have a little patience. Please. The fact that you have never seen something does not mean it cannot be done or that it does not exist. Using an indicator for this task has a number of advantages, although few people would recommend it. But as you see how the code is built, you will eventually understand why we will use an indicator for this, not an Expert Advisor. As we have been saying for some time, the material in this series of articles on the replay/simulation system will become increasingly complex. But I try, whenever possible, to keep everything as simple and accessible as I can.
The problem with using an indicator is that, if we implement the code incorrectly, we may end up completely disrupting the chart's operation. This happens because MetaTrader 5 places all indicators in the same execution thread. Therefore, if one indicator freezes or becomes unresponsive for a while, the chart on which it is located will also face the same problem. Many people sometimes fill a chart with indicators. Although this may seem acceptable, it is not recommended, because they all run in the same thread. One indicator can harm the others, putting the overall platform performance at risk.
However, our idea here is precisely to place the indicator on the chart and leave it alone. In other words, it will not undergo any updates. Even if you manually change the take-profit or stop-loss price, at this point the indicator will not display that change. This will be done later, when I explain in detail exactly how this update will be performed. So let us not rush. The first thing is to display the price lines; forget everything else for now, because we will implement this in the simplest and most educational way. I want you to learn this so that you can create the changes needed for your personal projects, rather than simply using what I teach you to create and becoming completely limited later, not knowing where to go next.
Excellent. Now we are going to modify the code we saw earlier so that we can test a few things. Our new code can be seen below:
01. //+------------------------------------------------------------------+
02. #property copyright "Daniel Jose"
03. #property description "Indicator for tracking an open position on the server."
04. #property version   "1.00"
05. #property indicator_chart_window
06. #property indicator_plots 0
07. //+------------------------------------------------------------------+
08. #include <Market Replay\Auxiliar\C_Terminal.mqh>
09. //+------------------------------------------------------------------+
10. C_Terminal *Terminal;
11. //+------------------------------------------------------------------+
12. int OnInit()
13. {
14.     Terminal = new C_Terminal();
15.     if (!PositionSelect((*Terminal).GetInfoTerminal().szSymbol)) return INIT_FAILED;
16.     Print (
17.             "Position Ticket: ", PositionGetInteger(POSITION_TICKET), "   ",
18.             "Opening Price: ",PositionGetDouble(POSITION_PRICE_OPEN), "   ",
19.             "Stop Position: ", PositionGetDouble(POSITION_SL), "   ",
20.             "Take Position: ", PositionGetDouble(POSITION_TP)
21.           );
22.
23.     return INIT_SUCCEEDED;
24. }
25. //+------------------------------------------------------------------+
26. int OnCalculate(const int rates_total, const int prev_calculated, const int begin, const double &price[])
27. {
28.     return rates_total;
29. }
30. //+------------------------------------------------------------------+
31. void OnDeinit(const int reason)
32. {
33.     delete Terminal;
34. }
35. //+------------------------------------------------------------------+
Source code of the basic position indicator
Since this code is quite simple, I will quickly go through it so that you understand how it works. I assume you will not understand it just by looking at the code. In line 08, we add a file already present in the replay/simulation system. This file has not undergone any changes since its last update shown here in this series. In line 10, we indicate that we will access the class present in the header file through a pointer. In line 14, we initialize the class. In line 15, we ask MetaTrader 5 to tell us whether a position is open for this symbol. If it does not exist, we will terminate the indicator by reporting an error.
Now pay attention! When line 15 does its job and returns true, the data related to the position for the requested trading instrument becomes available for use. Until that moment, no reliable data will be provided to us. Note this detail. If line 15 executes successfully, line 16 will run. In that line, we print to the terminal the position data obtained by the call in line 15. Finally, in line 23, we return a value indicating that the indicator has initialized successfully.
Nothing else will happen inside this indicator until it is removed from the chart for some reason. When that happens, in line 33 we destroy the class and return the allocated memory to the system.
Everything is simple. As a result, the terminal will display the following data, starting from the position shown in the next image:
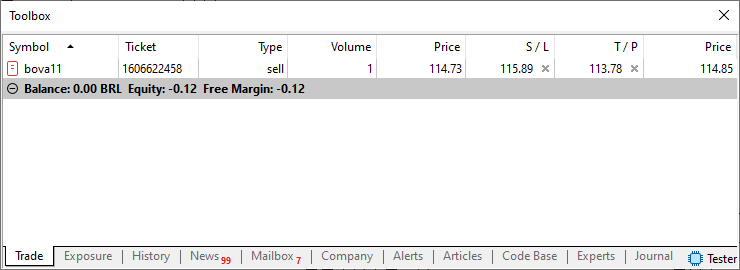
After the indicator performs its task, you can check the result of its operation, as shown in the next image.
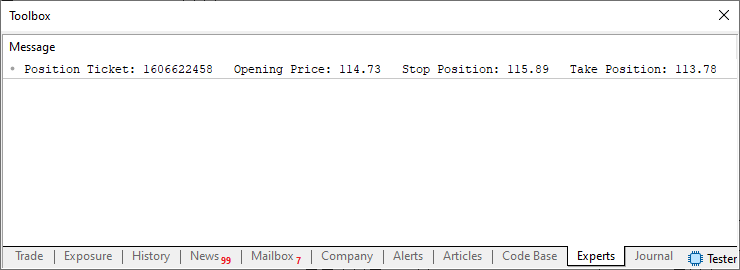
Please note that we managed to obtain this data. Contrary to popular belief, we can indeed obtain data about positions or pending orders directly from an indicator. We do not necessarily need to use an Expert Advisor for this. However, the fact that we can obtain data about a position or pending order does not mean that we can use an indicator to send or modify a position or pending order. Please do not confuse these concepts. The component responsible for this, that is, for sending or modifying a position or pending order, is the Expert Advisor. Do not try to do this through an indicator, because it will not work.
All right. Everything is fine, even excellent, but we are still far from what we really need to implement. However, as many people say:
A word to the wise is sufficient.
Therefore, anyone who already knows how to add objects to a chart will probably understand the idea. But if that was not the case for you, dear reader, do not despair. We are now moving on to the next step we need to implement. This next step is a bit more extensive. Even so, we will try to make the development process at least enjoyable. This is because of the possibilities that open up from this point on. However, we will not jump straight to the final result. We will proceed gradually, because there are a number of points that must be considered in order to keep the programming to a minimum. Remember: we already have several ready-made applications, such as Chart Trade, the mouse indicator and the basic Expert Advisor.
Now we will need to create the position indicator. Ideally, it should be placed on the chart when the other three applications are also there. But for now, we will not worry about that. First, let us create some objects to place on the chart so that we can see the same information we would see if MetaTrader 5 natively supported cross-orders. So let us get to work.
Placing objects on the chart
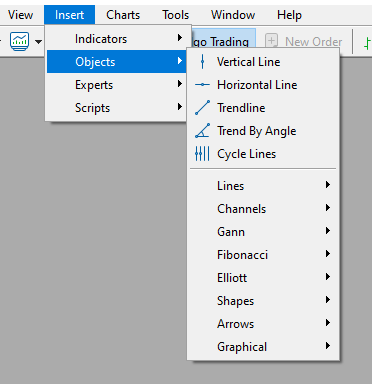
You may think that placing objects directly on the chart using MQL5 is either very difficult or very simple. In a sense, everything will depend on how we want to work and what you expect from the functionality. However, placing objects on a chart in the MetaTrader 5 terminal is not difficult. It is actually quite simple, either using MQL5 code or directly from MetaTrader 5, where the menu contains the Insert item with the Objects submenu, which allows us to place some objects directly on the chart in a very simple and straightforward way. You can see this in the next image:
However, there is a problem. I am not entirely sure whether I mentioned this before. In any case, from this point on, dear reader, you should begin to understand that we cannot do things at random. You should not add objects to the chart simply because this will make the chart look nicer or even display data or information that we consider necessary. Doing this without proper care is a huge mistake. Please do not misunderstand me, because there is something many people are not even aware of. Sooner or later, they run into a serious problem that literally ruins the experience of using MetaTrader 5.
However, the problem is not really in MetaTrader 5, but in the various applications that create objects on the chart without any control. Even if these objects do not overload the image and do not interfere with reading the chart normally, they can become a real nightmare. It is like a stone stuck in the ground: we think it is a small pebble, but when we try to pull it out, we discover that it is actually a huge boulder, much larger than we could have imagined.
Perhaps you are thinking: "All right, but how does this affect me, or why should I care?" Well, if you think that way, I have nothing more to say to you except to wish you good luck. But if you are really interested and want to get the best experience from using applications that work with objects on the chart, this topic may interest you a lot. The problem is not difficult to notice; quite the opposite, it stands out clearly. And if you really want to see how this problem arises, it will be enough to use the code I published some time ago. At that time, I did not understand how MetaTrader 5 handled certain situations. But for what we are going to do, it is extremely important to know how MetaTrader 5 handles some of them.
If you add an image to the chart so that it covers the entire graphical area, the result will be a wallpaper that can serve as a way to quickly identify which symbol is on the screen. In addition, using an image on the chart looks much more appealing than a monochrome background. Simply put, there is no accounting for taste; at worst, we may regret our choice. All right. This can be done by placing an object directly on the chart, or by using a dedicated application for this purpose. In the first case, we will not be able to control certain things. In the second case, we will have full control over the process.
All right. Those who follow my articles know that, within what has already been shown, at one point we created a class called C_DrawImage. Its purpose is to allow the placement of objects whose contents are bitmap images. At least for now, since we have not yet shown how to work with other image formats. But that is not what interests us here; another fact does. Thus, using the entire set of code we have shown, we can create the following file, presented below:
01. //+------------------------------------------------------------------+
02. #property copyright "Daniel Jose"
03. #property description "This indicator allows you to add"
04. #property description "a wallpaper to the chart."
05. #property version   "1.00"
06. #property indicator_chart_window
07. #property indicator_plots 0
08. //+------------------------------------------------------------------+
09. #include <Market Replay\Auxiliar\C_DrawImage.mqh>
10. //+------------------------------------------------------------------+
11. input string    user00 = "WallPaper_1";         //WallPaper
12. input uchar     user01 = 60;                    //Transparency
13. //+------------------------------------------------------------------+
14. C_DrawImage *Draw;
15. C_Terminal *Terminal;
16. //+------------------------------------------------------------------+
17. int OnInit()
18. {
19.     Terminal = new C_Terminal();
20.     if (!Terminal.IndicatorCheckPass("Indicator WallPaper")) return INIT_FAILED;
21.     Draw = new C_DrawImage(Terminal, "WallPaper", 0, "WallPapers\\" + user00 + ".bmp", NULL);
22.
23.     return INIT_SUCCEEDED;
24. }
25. //+------------------------------------------------------------------+
26. int OnCalculate(const int rates_total, const int prev_calculated, const int begin, const double &price[])
27. {
28.     return rates_total;
29. }
30. //+------------------------------------------------------------------+
31. void OnChartEvent(const int id, const long &lparam, const double &dparam, const string &sparam)
32. {
33.     switch (id)
34.     {
35.         case CHARTEVENT_CHART_CHANGE:
36.             (*Terminal).DispatchMessage(id, lparam, dparam, sparam);
37.             (*Draw).Paint(0, 0, (*Terminal).GetInfoTerminal().Width, (*Terminal).GetInfoTerminal().Height, user01, 0);
38.             break;
39.     }
40.     ChartRedraw((*Terminal).GetInfoTerminal().ID);
41. }
42. //+------------------------------------------------------------------+
43. void OnDeinit(const int reason)
44. {
45.     delete Draw;
46.     delete Terminal;
47. }
48. //+------------------------------------------------------------------+
Source code of Wallpaper.mq5
Note that this is just an indicator. But what does this file actually do? Well, it is simple. This small and modest file is actually an update of another file from one of my earlier articles. As I mentioned, at that time I did not know certain things about MetaTrader 5.
This is the article How to make the chart more interesting: adding a background, for those who are interested in the motivation and more detailed information about the idea behind the whole work. If you compare the codes, you can see that they are completely different. And yes, they are, but not to the extent you might imagine. The code presented in that article has a problem whose solution is extremely simple. After compiling this code and loading it onto the chart as a MetaTrader 5 application, a background image will appear on the chart. In fact, the image should serve as a background.
However, although this is clearly visible in the code, when the timeframe is changed this is not exactly what happens. Even if we tell MetaTrader 5 that the bars should be in the foreground, this wallpaper will still cover them and may completely hide the chart. But it gets even worse. The object created there initially has the default priority for receiving click events, unlike the updated code I am showing here.
But what is the problem? There is no problem if there are few objects on the chart and they are isolated from each other. But what happens if we place an object, such as a wallpaper, that covers the entire chart? And what if it has the same priority for receiving events as other objects that are also present on the chart? The situation starts to get a little complicated, does it not? This is because MetaTrader 5 will not know which object to send the events to.
Now think about the following: we already have several necessary objects on the chart. They are in the mouse indicator and in the Chart Trade indicator. However, the priority of the mouse indicator objects has been reduced to -1. The objects of the Chart Trade indicator have zero priority. That is, even if we try to send a click event to an object created in the mouse indicator, we will not be able to receive that event if the mouse pointer is over any object of the Chart Trade panel. We already saw this during the implementation of the Chart Trade panel. However, I do not know whether this is still fresh in your memory, dear reader.
And now a new complicating factor appears. We will create and place even more objects on the chart. This is because we are going to create the order and position indicator. However, the question remains the same. What should we do when creating objects in the Order and Position indicator? If they have the same event-receiving priority as the Chart Trade panel, we may run into problems when one object overlaps another.
You might think: "But this is simple. The object in front will have priority." Yes, but I repeat: which object are we talking about? This is because if two objects are created with the same priority and both are in the same position, MetaTrader 5 will draw them in the order in which they were placed. In other words, the object placed last will cover the objects created earlier. But that is not the problem. The problem is what happens when an event occurs that requires the chart to be redrawn, as happens when we change the timeframe. At that moment, the order in which the objects are created may be different from before, making everything very difficult to manage. If all objects were created by a single application, the problem would be solved. However, we decided not to concentrate everything in one huge file. That is why we need a little more control over how things are created.
Final thoughts
For those who simply expected events to develop quickly and chaotically, this article may have been a rude awakening. Here we began to outline the direction we will follow regarding the implementation of the order system. First, we need to create some kind of indicator in order to interact with the system. Second, creation, or rather implementation, must not be done chaotically. If that happens, we may completely lose control over the objects present on the chart. Third, since the indicator we will implement will add even more objects to the chart, we need to find some way to avoid possible interaction failures. Because if two objects are in the same place, one of them may receive events even if it is covered, simply because it has a higher priority.
However, I do not want to run into problems when we work with more than one order or position on the chart. This is because, if the implementation is done incorrectly, we may end up closing what we wanted to keep open and keeping open what we wanted to close. I want to show you how to eliminate this type of failure. Therefore, I hope that you, dear reader, really want to learn, because we will see many new things before the replay/simulation system is completed.
| File | Description |
|---|---|
| Experts\Expert Advisor.mq5 | Demonstrates the interaction between Chart Trade and the Expert Advisor (Mouse Study is required for interaction). |
| Indicators\Chart Trade.mq5 | Creates a window for configuring the order to be sent (Mouse Study is required for interaction). |
| Indicators\Market Replay.mq5 | Creates controls for interacting with the replay/simulation service (Mouse Study is required for interaction). |
| Indicators\Mouse Study.mq5 | Provides interaction between graphical controls and the user (required both for the replay/simulation system and in the real market). |
| Indicators\Order Indicator.mq5 | Responsible for displaying market orders, allowing interaction with and management of them. |
| Indicators\Position View.mq5 | Responsible for displaying market positions, allowing interaction with and management of them. |
| Services\Market Replay.mq5 | Creates and maintains the market replay/simulation service (the main file of the entire system). |
Translated from Portuguese by MetaQuotes Ltd.
Original article: https://www.mql5.com/pt/articles/13133
Warning: All rights to these materials are reserved by MetaQuotes Ltd. Copying or reprinting of these materials in whole or in part is prohibited.
This article was written by a user of the site and reflects their personal views. MetaQuotes Ltd is not responsible for the accuracy of the information presented, nor for any consequences resulting from the use of the solutions, strategies or recommendations described.

 Custom Indicator Workshop (Part 3): Building the UT Bot Alerts Indicator in MQL5
 From Basic to Intermediate: Objects (IV)
 Extreme Value Theory in MQL5: Building a Tail-Risk Crash Gauge Beyond Monte Carlo VaR
 How to Connect AI Agents to MQL5 Algo Forge via MCP

- Free trading apps
- Over 8,000 signals for copying
- Economic news for exploring financial markets
You agree to website policy and terms of use