
From Basic to Intermediate: Indicator (V)

Introduction
In the previous article “From Beginner to Intermediate: Inheritance” we discussed how inheritance can be applied in a structured-programming context. To avoid overloading you with information, in today’s article we will look at something simpler, or at least material that can be studied and practiced in parallel with the material from the previous articles.
I understand that at first this topic may be somewhat difficult to grasp, and considering that before this there were six consecutive articles with quite extensive material, I suggest relaxing and looking at something simpler and more practical.
In the articles about indicators, the latest article in the series being From Beginner to Intermediate: Indicator (IV), we looked at how something can be displayed directly on the chart using an entirely static and very simple implementation, as well as a direct way of creating an indicator. And although the format shown in those articles turned out to be ideal for virtually any indicator you may create, we are essentially not limited to it alone. We also have the option of creating dynamic indicators, if we can classify them as such.
But in order for you to understand why I consider the previous format static and how it differs from a dynamically created format, I need to explain a few points. To do this properly, let us move on to a new topic.
The difference between a static and a dynamic indicator
Most likely, many other programmers will disagree with what I am about to say, but this is a minor detail, since everyone has the right to their own opinion. And one opinion does not necessarily refute others, provided the reason is clearly established and explained.
To understand why I call the previously discussed indicators “static”, we need to examine their code. Indeed, at that time I did not go into the details, partly because such an implementation is quite easy to understand. But in order to understand what we will see today, we first need to understand those previous pieces of code.
Let us use one of these pieces of code as an example. Below you can see the example that we will use to begin our explanations.
01. //+------------------------------------------------------------------+
02. #property copyright "Daniel Jose"
03. //+------------------------------------------------------------------+
04. #property indicator_type1       DRAW_COLOR_CANDLES
05. #property indicator_color1      clrRed, clrRoyalBlue, clrGreen
06. //+----------------+
07. #property indicator_buffers     5
08. #property indicator_plots       1
09. //+----------------+
10. double  gl_Buff_High[],
11.         gl_Buff_Open[],
12.         gl_Buff_Close[],
13.         gl_Buff_Low[],
14.         gl_Buff_Color[];
15. //+------------------------------------------------------------------+
16. int OnInit()
17. {
18.    SetIndexBuffer(1, gl_Buff_High, INDICATOR_DATA);
19.    SetIndexBuffer(0, gl_Buff_Open, INDICATOR_DATA);
20.    SetIndexBuffer(3, gl_Buff_Close, INDICATOR_DATA);
21.    SetIndexBuffer(2, gl_Buff_Low, INDICATOR_DATA);
22.    SetIndexBuffer(4, gl_Buff_Color, INDICATOR_COLOR_INDEX);
23.
24.    return INIT_SUCCEEDED;
25. };
26. //+------------------------------------------------------------------+
27. int OnCalculate(const int rates_total, const int prev_calculated, const datetime &Time[], const double &Open[], const double &High[], const double &Low[], const double &Close[], const long &TickVolume[], const long &Volume[], const int &Spread[])
28. {
29.    static double  high = DBL_MIN,
30.                   low = DBL_MAX;
31.
32.    for (int c = (prev_calculated > 0 ? prev_calculated - 1 : 0); c < rates_total; c++)
33.    {
34.       gl_Buff_High[c] = High[c];
35.       gl_Buff_Open[c] = Open[c];
36.       gl_Buff_Close[c] = Close[c];
37.       gl_Buff_Low[c] = Low[c];
38.
39.       gl_Buff_Color[c] = (Open[c] > Close[c] ? 0 : 2);
40.       if ((c - 1) > 0)
41.       {
42.          high = (High[c - 1] > high ? High[c - 1] : high);
43.          low = (Low[c - 1] < low ? Low[c - 1] : low);
44.          gl_Buff_Color[c] = ((high > High[c]) && (low < Low[c]) ? 1 : gl_Buff_Color[c]);
45.          if (gl_Buff_Color[c] != 1)
46.          {
47.             high = DBL_MIN;
48.             low = DBL_MAX;
49.          }
50.       }
51.    }
52.
53.    return rates_total;
54. };
55. //+------------------------------------------------------------------+
Code 01
When run, code 01 turns the chart display into an indicator-style rendering. In this case, it is an Inside Bar indicator, as can be seen in the image below.

Image 01
So, we know how code 01 works, at least in its basic part, precisely because when it was introduced, it was explained how to declare certain parameters. However, this indicator, labeled as code 01, as I understand it, is a static indicator. And the reason lies precisely in the declarations made on lines 04 and 05. And please, dear readers, do not misunderstand me. I am saying that the indicator in code 01 is static because after compilation we cannot change the indicator itself, since it was declared using MQL5 compilation directives, which include the lines just mentioned.
However, what truly matters is whether the indicator works and whether it performs the task for which it was designed. Since this is achieved in a fairly simple way, there is no problem with using this static implementation. Nevertheless, we can create the very same code, or rather, create a very similar indicator (but with dynamic properties), at least from the point of view of implementation and presentation.
How does a dynamic indicator work? What are the advantages of implementing it? Let us proceed step by step. First, a dynamic indicator should not contain lines 04 and 05 in its code, which are visible in code 01. This is the first and most significant difference. The advantage would be precisely the absence of these two lines. This may look odd at first, but it will become clearer later, when we move on to more complex models.
But precisely because we have not declared these lines of code, we can change the way the indicator displays information without having to compile the code to change that presentation method. However, perhaps the greatest advantage is that we do not need to create a real logical scheme in the indicator code in order to choose how information is displayed on the chart.
Now pay attention. What we will do here will not change the operating principle of the indicator from code 01. We will simply create a way to implement these actions through code. In other words, part of the actions that are usually performed by directives will be carried out through calls to the MQL5 standard library. The first thing to do is remove the lines that turn the indicator from code 01 into a static indicator. After removing the static part, we get the following:
01. //+------------------------------------------------------------------+
02. #property copyright "Daniel Jose"
03. //+------------------------------------------------------------------+
04. #property indicator_buffers     5
05. #property indicator_plots       1
06. //+----------------+
07. double  gl_Buff_High[],
08.         gl_Buff_Open[],
09.         gl_Buff_Close[],
10.         gl_Buff_Low[],
11.         gl_Buff_Color[];
12. //+------------------------------------------------------------------+
13. int OnInit()
14. {
15.    SetIndexBuffer(1, gl_Buff_High, INDICATOR_DATA);
16.    SetIndexBuffer(0, gl_Buff_Open, INDICATOR_DATA);
17.    SetIndexBuffer(3, gl_Buff_Close, INDICATOR_DATA);
18.    SetIndexBuffer(2, gl_Buff_Low, INDICATOR_DATA);
19.    SetIndexBuffer(4, gl_Buff_Color, INDICATOR_COLOR_INDEX);
20.
21.    return INIT_SUCCEEDED;
22. };
23. //+------------------------------------------------------------------+
24. int OnCalculate(const int rates_total, const int prev_calculated, const datetime &Time[], const double &Open[], const double &High[], const double &Low[], const double &Close[], const long &TickVolume[], const long &Volume[], const int &Spread[])
25. {
26.    static double  high = DBL_MIN,
27.                   low = DBL_MAX;
28.
29.    for (int c = (prev_calculated > 0 ? prev_calculated - 1 : 0); c < rates_total; c++)
30.    {
31.       gl_Buff_High[c] = High[c];
32.       gl_Buff_Open[c] = Open[c];
33.       gl_Buff_Close[c] = Close[c];
34.       gl_Buff_Low[c] = Low[c];
35.
36.       gl_Buff_Color[c] = (Open[c] > Close[c] ? 0 : 2);
37.       if ((c - 1) > 0)
38.       {
39.          high = (High[c - 1] > high ? High[c - 1] : high);
40.          low = (Low[c - 1] < low ? Low[c - 1] : low);
41.          gl_Buff_Color[c] = ((high > High[c]) && (low < Low[c]) ? 1 : gl_Buff_Color[c]);
42.          if (gl_Buff_Color[c] != 1)
43.          {
44.             high = DBL_MIN;
45.             low = DBL_MAX;
46.          }
47.       }
48.    }
49.
50.    return rates_total;
51. };
52. //+------------------------------------------------------------------+
Code 02
Code 02, although it compiles, DOES NOT WORK. At least, it will not affect the chart on which it is placed in any way. However, this is not really a problem. This happened because we removed the part that tells MetaTrader 5 exactly how the indicator will be used. Thus, MetaTrader 5 only knows that we have four data buffers and one color buffer, and that only one plot will be drawn. But MetaTrader 5 DOES NOT KNOW how to use these buffers, even though they are configured to display some information. Therefore, nothing happens on the chart.
All right, how do we solve this problem? How can we tell MetaTrader 5 how to use the buffers declared in code 02? Well, this is the most interesting part, because at this point we will configure buffer usage dynamically in MetaTrader 5. This is done by adding several new lines to the code, as shown below.
01. //+------------------------------------------------------------------+
02. #property copyright "Daniel Jose"
03. //+------------------------------------------------------------------+
04. #property indicator_buffers     5
05. #property indicator_plots       1
06. //+----------------+
07. double  gl_Buff_High[],
08.         gl_Buff_Open[],
09.         gl_Buff_Close[],
10.         gl_Buff_Low[],
11.         gl_Buff_Color[];
12. //+------------------------------------------------------------------+
13. int OnInit()
14. {
15.    const color cor[] = {clrRed, clrRoyalBlue, clrGreen};
16.
17.    PlotIndexSetInteger(0, PLOT_DRAW_TYPE, DRAW_COLOR_CANDLES);
18.    PlotIndexSetInteger(0, PLOT_COLOR_INDEXES, cor.Size());
19.    for (uint c = 0; c < cor.Size(); c++)
20.       PlotIndexSetInteger(c, PLOT_LINE_COLOR, c, cor[c]);
21.
22.    SetIndexBuffer(1, gl_Buff_High, INDICATOR_DATA);
23.    SetIndexBuffer(0, gl_Buff_Open, INDICATOR_DATA);
24.    SetIndexBuffer(3, gl_Buff_Close, INDICATOR_DATA);
25.    SetIndexBuffer(2, gl_Buff_Low, INDICATOR_DATA);
26.    SetIndexBuffer(4, gl_Buff_Color, INDICATOR_COLOR_INDEX);
27.
28.    return INIT_SUCCEEDED;
29. };
30. //+------------------------------------------------------------------+
                   .
                   .
                   .
Code 03
Since the final result matches what is shown in image 01, I will not repeat it. However, when using the dynamic indicator that we see in the code 03 fragment, everything will work somewhat differently than when using the static indicator in code 01.
But before continuing, let us understand what was done in the code 03 fragment, where only the part that interests us is shown. As a reminder, the full code will be in the attachment. Note that on line 15 an array of constant colors is defined. The color sequence is the same as in code 01, on line 05. It is important that you understand this in order to understand how the code actually works. Now, when line 17 is executed in code 03, we will get the same effect as when the compiler reads line 04 in code 01. Notice the subtle difference that is present here. Unlike code 01, where during compilation we specified how everything would look, here we do not do that. We simply tell the compiler: create the code and use this value. But this has serious consequences, as we will see later.
Immediately after that, on line 18 of code 03, we tell MetaTrader 5 how many colors are in the color buffer. Note: specifying the number of colors on line 18 does not tell us what value each color will have. Thus, if we do not initialize them, MetaTrader 5 will do this somehow, and the color scheme may end up completely disordered. That is why we use the loop on line 19 to initialize the colors by calling the function on line 20. All of this is equivalent to line 05 in code 01.
However, even with this, the similarity ends. Because, by applying this indicator from the code 03 fragment, we will find ourselves in a situation that is, at the very least, quite unusual. This can be seen in the image below.
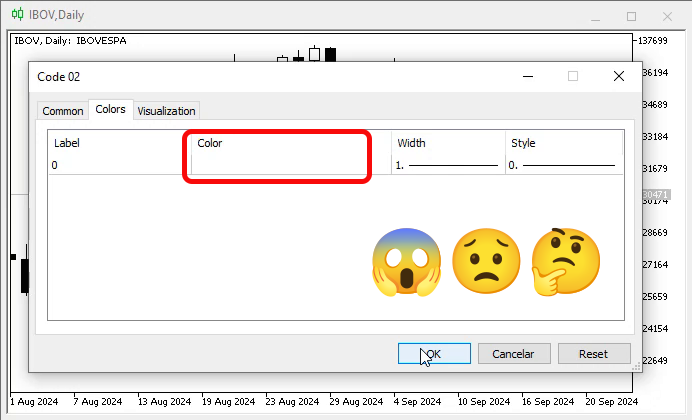
Image 02
“Hey! Wait a minute. Where are the colors that will be applied to the indicator?” I think both you and the user who sees image 02 will be very surprised by this, and the user who sees this image will be completely confused. But let us see what happens if we apply this indicator to the chart. This can be seen in the animation below.
Animation 01
“What a frightening thing. I do not understand. Why, despite the impossibility of adjusting the colors, as shown in image 02, did the indicator still produce the same result as in image 01? This is quite strange.”
In fact, this behavior does not seem so strange. It happens because we define the parameters dynamically. And since MetaTrader 5 does not yet know how to create the colors, it cannot use them, or rather, it cannot present them for configuration, because it still does not know how many colors and exactly which colors will be used. This is indeed quite interesting, and in the future we will be able to study this issue in different ways. For now, let us focus on the main points.
Given that the color scheme matched the one we saw in image 01, we know that the indicator works. We can also show the user which template we defined at the code-writing stage. “But can’t this be changed by allowing the user to choose the desired colors?” As for this, dear reader, there is essentially no problem, because once the indicator appears on the chart, the user can open its properties and change them. In this case, look at what happens in animation 02.
Animation 02
Hmm, intriguing; now we can see which colors are defined for use in the indicator. “But wait a second. You said that we can change the colors. However, I remembered something. On line 15 of the fragment from code 03, we define exactly the colors that are visible in animation 02, and yet they are defined as constants. There seems to be some contradiction. If they are defined as constants, how can the user change the color scheme?”
In this regard, we have the advantage that MetaTrader 5 understands what is being done, because we are simply changing some argument or parameter of the indicator. MetaTrader 5 will not remove it completely from the chart. This will, in a sense, keep it on the chart while changing only what is necessary. An example is shown in the animation below.
Animation 03
Note that this really does work. However, this approach has a small drawback. When the user removes the indicator from the chart, or more precisely, when the user asks MetaTrader 5 to rebuild the chart, the values declared on line 15 will be used again, as a result of which any configuration changes made by the user will be lost and will have to be made again.
An example of a chart refresh request could be a simple request to change the chart period. As absurd as it may seem, for many users simply changing the settings for, say, 5 minutes, and then immediately asking MetaTrader 5 to use a period of, for example, 10 minutes, will cause the settings defined when the indicator was created to be used again and, consequently, the changes made to be lost. In another article, we have already explained how to solve or overcome such situations. Therefore, we will not repeat it here.
After this simple demonstration, I think you have already understood the difference between a static and a dynamic implementation. However, for those who want to learn more about how far we can go, the MQL5 documentation contains a table that illustrates such things. See: Relationship between indicator properties and corresponding functions, which allows you to determine which directives or properties can be implemented dynamically and which cannot.
“Excellent, but between us, I still could not understand what the advantage is of using this dynamic system. Nevertheless, I do not understand how it can help me in any way.” All right, I understand your lack of enthusiasm for such an implementation. Indeed, it seems insignificant, especially considering some of the difficulties that often arise when using this kind of indicator implementation.
However, in some very specific cases focused on personal use, you may be interested in exactly this approach. To demonstrate this, let us consider a very specific implementation example. This will be discussed in the next topic.
The Inside Bar indicator on different chart types
The indicator we discussed in the previous topic is mainly intended for use on a candlestick chart. But, as is known, MetaTrader 5 allows you to use not only a candlestick chart, but also a bar chart and, of course, a line chart. If the user accidentally switches to another display type different from the candlestick chart, they will encounter very unpleasant chart behavior. Let us look below:

Image 03
Image 03 shows the Inside Bar indicator used on a bar chart. Please note that the way the information is displayed is completely unusual, as shown in the next image.
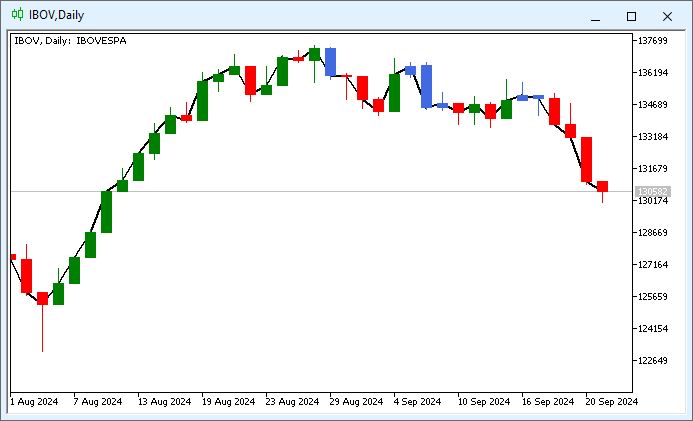
Image 04
Here we are dealing with a problem very similar to the problem in image 03. However, in the case of image 04, we are asking to use a line chart as well as the Inside Bar indicator. Perhaps for most people, in reality, such a situation makes no sense, because when using a line chart, we seek to obtain information from only one of the OHLC values, and almost always the final value will be important to us. But this is not so. The problem is that even if we ask to show the chart in another format, we will still see candles being displayed. And this must be fixed.
In principle, there are two ways to do this. And I say “two” because there was also a third, which involved creating an indicator for each chart mode. But this would make its use extremely confusing for users. Let us focus on the other two ways. One is to create an execution scheme, basing the code on what will be created by the compiler. The other is to create a dynamic system for processing the information that will be monitored.
To avoid unnecessary complexity, we will modify code 03 (discussed in the previous topic) into a version in which the indicator colors can be specified from the very beginning. However, we will not define the type of indicator that will be displayed on the chart. Thus, the same fragment of code 03 will look as shown below.
01. //+------------------------------------------------------------------+
02. #property copyright "Daniel Jose"
03. //+------------------------------------------------------------------+
04. #property indicator_color1      clrRed, clrRoyalBlue, clrGreen
05. //+----------------+
06. #property indicator_buffers     5
07. #property indicator_plots       1
08. //+----------------+
09. double  gl_Buff_High[],
10.         gl_Buff_Open[],
11.         gl_Buff_Close[],
12.         gl_Buff_Low[],
13.         gl_Buff_Color[];
14. //+------------------------------------------------------------------+
15. int OnInit()
16. {
17.    PlotIndexSetInteger(0, PLOT_DRAW_TYPE, DRAW_COLOR_CANDLES);
18.
19.    SetIndexBuffer(1, gl_Buff_High, INDICATOR_DATA);
20.    SetIndexBuffer(0, gl_Buff_Open, INDICATOR_DATA);
21.    SetIndexBuffer(3, gl_Buff_Close, INDICATOR_DATA);
22.    SetIndexBuffer(2, gl_Buff_Low, INDICATOR_DATA);
23.    SetIndexBuffer(4, gl_Buff_Color, INDICATOR_COLOR_INDEX);
24.
25.    return INIT_SUCCEEDED;
26. };
27. //+------------------------------------------------------------------+
28. int OnCalculate(const int rates_total, const int prev_calculated, const datetime &Time[], const double &Open[], const double &High[], const double &Low[], const double &Close[], const long &TickVolume[], const long &Volume[], const int &Spread[])
29. {
30.    static double  high = DBL_MIN,
31.                   low = DBL_MAX;
32.
33.    for (int c = (prev_calculated > 0 ? prev_calculated - 1 : 0); c < rates_total; c++)
34.    {
35.       gl_Buff_High[c] = High[c];
36.       gl_Buff_Open[c] = Open[c];
37.       gl_Buff_Close[c] = Close[c];
38.       gl_Buff_Low[c] = Low[c];
39.
40.       gl_Buff_Color[c] = (Open[c] > Close[c] ? 0 : 2);
41.       if ((c - 1) > 0)
42.       {
43.          high = (High[c - 1] > high ? High[c - 1] : high);
44.          low = (Low[c - 1] < low ? Low[c - 1] : low);
45.          gl_Buff_Color[c] = ((high > High[c]) && (low < Low[c]) ? 1 : gl_Buff_Color[c]);
46.          if (gl_Buff_Color[c] != 1)
47.          {
48.             high = DBL_MIN;
49.             low = DBL_MAX;
50.          }
51.       }
52.    }
53.
54.    return rates_total;
55. };
56. //+------------------------------------------------------------------+
Code 04
Now code 04 works in a more convenient way for any indicator user, because we can specify the colors from the very beginning. And all of this is so because on line 04 of code 04 we define the indicator property. Note that this is why we removed the part of the code responsible for loading the colors from the OnInit event handling block. Thus, we get a base indicator that we will need to manipulate.
Now we come to the most interesting part: If this indicator, which we see in code 04, works dynamically and at the same time has a certain static part that allows the color template to be displayed, how can we make it work and adapt to the type of chart being viewed?
This is where many people who look at my code usually get goosebumps. Please note that on line 17 we specify that the indicator will be drawn as candlesticks. However, when switching the chart to a bar chart, problems will arise, as shown in the previous images. But if we study the documentation, we discover a rather interesting feature of the standard library. It allows us to know which chart type is currently being used. This refers to the function ChartGetInteger. When we request information from this function about the type of chart being used, it returns an enumeration, in this case ENUM_CHART_MODE.
This is exactly what we need to know. But before applying this in practice, let us see how the indicator will behave at the initial stage. To do this, we modified the code; it now looks like this:
                   .
                   .
                   .
14. //+------------------------------------------------------------------+
15. #define PrintX(X) Print(__FUNCTION__, " => ",#X, " :: ",X);
16. //+------------------------------------------------------------------+
17. int OnInit()
18. {
19.     PrintX(EnumToString((ENUM_CHART_MODE)ChartGetInteger(0, CHART_MODE)));
20.     PlotIndexSetInteger(0, PLOT_DRAW_TYPE, DRAW_COLOR_CANDLES);
21.
22.     SetIndexBuffer(1, gl_Buff_High, INDICATOR_DATA);
23.     SetIndexBuffer(0, gl_Buff_Open, INDICATOR_DATA);
24.     SetIndexBuffer(3, gl_Buff_Close, INDICATOR_DATA);
25.     SetIndexBuffer(2, gl_Buff_Low, INDICATOR_DATA);
26.     SetIndexBuffer(4, gl_Buff_Color, INDICATOR_COLOR_INDEX);
27.
28.     return INIT_SUCCEEDED;
29. };
30. //+------------------------------------------------------------------+
                   .
                   .
                   .
Code 05
Now pay attention, otherwise you will get confused in the description of what will be done. This fragment of code 05 shows the changes that had to be made to code 04 in order to determine which chart type is being used at the current moment. Then, on line 19, we make a call that ultimately, according to the definition given on line 15, is converted into information that will be displayed in the MetaTrader 5 terminal. This information can be seen in the images below.

Image 05
Image 05 shows that we are using a CHART_CANDLES chart.
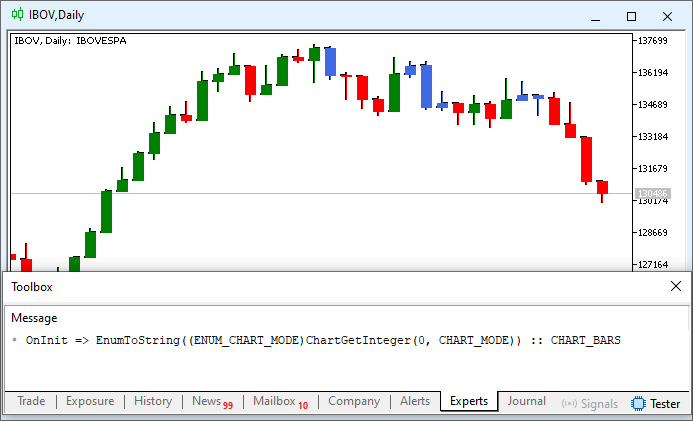
Image 06
In image 06 we clearly see that the chart is called CHART_BARS.

Image 07
And finally, in image 07 we see that the chart is called CHART_LINE. All right, but how can we use this to our advantage? Well, everything is very simple, except for the CHART_LINE chart, whose solution we will look at later. For the indicator to use the correct chart plotting mode, we only need the function call on line 20 (shown in this code 05 fragment) to specify the DRAW_COLOR_CANDLES type when we are on a candlestick chart, and DRAW_COLOR_BARS when we are on a bar chart.
The rest is history. This is very easy for anyone to do, and it works perfectly if MetaTrader 5 applies the indicator from the Init event. In other words, if we want to use it in the simplest way, the code should look as shown below.
                   .
                   .
                   .
14. //+------------------------------------------------------------------+
15. int OnInit()
16. {
17.     switch ((ENUM_CHART_MODE)ChartGetInteger(0, CHART_MODE))
18.     {
19.         case CHART_BARS:
20.             PlotIndexSetInteger(0, PLOT_DRAW_TYPE, DRAW_COLOR_BARS);
21.             break;
22.         case CHART_CANDLES:
23.             PlotIndexSetInteger(0, PLOT_DRAW_TYPE, DRAW_COLOR_CANDLES);
24.             break;
25.         case CHART_LINE:
26.             break;
27.     }
28.
29.     SetIndexBuffer(1, gl_Buff_High, INDICATOR_DATA);
30.     SetIndexBuffer(0, gl_Buff_Open, INDICATOR_DATA);
31.     SetIndexBuffer(3, gl_Buff_Close, INDICATOR_DATA);
32.     SetIndexBuffer(2, gl_Buff_Low, INDICATOR_DATA);
33.     SetIndexBuffer(4, gl_Buff_Color, INDICATOR_COLOR_INDEX);
34.
35.     return INIT_SUCCEEDED;
36. };
37. //+------------------------------------------------------------------+
                   .
                   .
                   .
Code 06
Please note that in this fragment of code 06 we do not consider the line chart plotting mode. This will become clear later. But note how we display the other modes. And what we see in code 06 works, but it has a small problem. In the animation below, you can see what this problem is.
Animation 04
In animation 04, we see that when the chart is switched to another plotting mode, the indicator can no longer keep up with MetaTrader 5’s actions. Many would give up, saying that it is impossible to create the indicator correctly. However, they do not know how MetaTrader 5 actually works. Whenever something happens, and as a rule on the chart, MetaTrader 5 triggers a very specific event that contains some information that helps us determine what happened. Some events can be enabled or disabled, while others cannot. Every event that we enable or disable affects the overall performance of MetaTrader 5, because the system becomes overloaded and is forced to process events that it normally does not monitor.
And for those seeking a high-performance system, this is trivial. Many traders, when planning to use MetaTrader 5, do not use anything with it at all, such as indicators or Expert Advisors. This is because such applications often slow down MetaTrader 5 during periods of high volatility. It is precisely at such moments that these traders want to profit; therefore, they use the basic version of MetaTrader 5, only it and nothing extra.
All right, but here we will not focus on trading with MetaTrader 5 in its most basic format. Yes, we want to add applications to the chart so that they can help us with something. Therefore, we need to capture a specific event that MetaTrader 5 triggers every time something is done on the chart, regardless of the nature of that event.
The event we want to capture is ChartEvent. In our code, it is handled by the OnChartEvent procedure. Now pay attention, dear readers. The ChartEvent event occurs whenever anything happens on the chart. However, we can enable and disable certain parameters so as not to capture every single change made to the chart. Nevertheless, when an indicator is added to the chart, MetaTrader 5 triggers two events one after another. In some cases a third one is also triggered, but we will focus only on the first two.
The first event that fires is initialization (Init), which is intercepted and handled by the OnInit function, which we have been considering since the beginning of the topic devoted to indicators. Immediately after the Init event is processed, a new event is triggered, even if we have not done anything yet. This event is ChartEvent, and it is precisely at this moment that the indicator is actually placed on the chart.
All right, but to understand what will happen next, we need to look at the declaration of the procedure that intercepts this ChartEvent. This statement can be seen just below.
void OnChartEvent(const int id,         // Event ID
                  const long& lparam,   // Parameter of type long event
                  const double& dparam, // Parameter of type double event
                  const string& sparam  // Parameter of type string events
  );
Code 07
Now, if we look at the documentation for OnChartEvent, we will see a small table. From this table, we are interested in the following value: CHARTEVENT_CHART_CHANGE — an event that occurs when the chart changes. Thus, this is exactly the value that appears when the ChartEvent fires for the first time. Now, knowing this, we can do something quite interesting in our code. So, after the update, the code will look as shown below.
01. //+------------------------------------------------------------------+
02. #property copyright "Daniel Jose"
03. //+------------------------------------------------------------------+
04. #property indicator_color1      clrRed, clrRoyalBlue, clrGreen
05. //+----------------+
06. #property indicator_buffers     5
07. #property indicator_plots       1
08. //+----------------+
09. double  gl_Buff_High[],
10.         gl_Buff_Open[],
11.         gl_Buff_Close[],
12.         gl_Buff_Low[],
13.         gl_Buff_Color[];
14. //+------------------------------------------------------------------+
15. int OnInit()
16. {
17.     SetIndexBuffer(0, gl_Buff_Open, INDICATOR_DATA);
18.     SetIndexBuffer(1, gl_Buff_High, INDICATOR_DATA);
19.     SetIndexBuffer(2, gl_Buff_Low, INDICATOR_DATA);
20.     SetIndexBuffer(3, gl_Buff_Close, INDICATOR_DATA);
21.     SetIndexBuffer(4, gl_Buff_Color, INDICATOR_COLOR_INDEX);
22.
23.     return INIT_SUCCEEDED;
24. };
25. //+------------------------------------------------------------------+
26. int OnCalculate(const int rates_total, const int prev_calculated, const datetime &Time[], const double &Open[], const double &High[], const double &Low[], const double &Close[], const long &TickVolume[], const long &Volume[], const int &Spread[])
27. {
28.    static double  high = DBL_MIN,
29.                   low = DBL_MAX;
30.
31.    for (int c = (prev_calculated > 0 ? prev_calculated - 1 : 0); c < rates_total; c++)
32.    {
33.       gl_Buff_High[c] = High[c];
34.       gl_Buff_Open[c] = Open[c];
35.       gl_Buff_Close[c] = Close[c];
36.       gl_Buff_Low[c] = Low[c];
37.
38.       gl_Buff_Color[c] = (Open[c] > Close[c] ? 0 : 2);
39.       if ((c - 1) > 0)
40.       {
41.          high = (High[c - 1] > high ? High[c - 1] : high);
42.          low = (Low[c - 1] < low ? Low[c - 1] : low);
43.          gl_Buff_Color[c] = ((high > High[c]) && (low < Low[c]) ? 1 : gl_Buff_Color[c]);
44.          if (gl_Buff_Color[c] != 1)
45.          {
46.             high = DBL_MIN;
47.             low = DBL_MAX;
48.          }
49.       }
50.    }
51.
52.    return rates_total;
53. };
54. //+------------------------------------------------------------------+
55. void OnChartEvent(const int id, const long &lparam, const double &dparam, const string &sparam)
56. {
57.     switch (id)
58.     {
59.         case CHARTEVENT_CHART_CHANGE:
60.             switch ((ENUM_CHART_MODE)ChartGetInteger(0, CHART_MODE))
61.             {
62.                 case CHART_BARS:
63.                     PlotIndexSetInteger(0, PLOT_DRAW_TYPE, DRAW_COLOR_BARS);
64.                     break;
65.                 case CHART_CANDLES:
66.                     PlotIndexSetInteger(0, PLOT_DRAW_TYPE, DRAW_COLOR_CANDLES);
67.                     break;
68.                 case CHART_LINE:
69.                     break;
70.             }
71.             break;
72.     }
73.     ChartRedraw();
74. };
75. //+------------------------------------------------------------------+
Code 08
Hmm. “I don’t know. I think this code will not work because we do not tell MetaTrader 5 which chart plotting system to use when the OnInit function is executed. I don’t know. I am almost sure that the result will be the same as with the error in code 02.”
Well, we have found a skeptic among us. Therefore, we are going to show him that the world is much bigger than he imagines. To prove that code 08 really works, let us look at the animation below.
Animation 05
Please note that the only thing that does not match MetaTrader 5’s actions on the chart is switching to CHART_LINE mode. In this case, our indicator, not using a chart plotting model, cannot keep up with the user’s actions in MetaTrader 5.
Final thoughts
In today’s article, we demonstrated a basic but very interesting principle for working with indicators. Although we did not show how to solve the problem of using an indicator to plot charts and comply with all MetaTrader 5 requirements, we managed to make a simple indicator execute a command that corresponds to the chart plotting mode. This is partly because we have not yet shown how to make the indicator display a line plot according to the user’s choice on the platform.
However, since the transition from drawing candlestick charts or bar charts (which require four data buffers and one color buffer) to drawing colored line charts (which require one data buffer and one color buffer) is quite difficult to demonstrate at the moment, we will leave this for later. To do this, we will need to use a somewhat different approach, loading and unloading the indicator through calls to the standard library. This is something that right now would be somewhat difficult for me to explain and difficult for you, dear readers, to understand.
In any case, as we move on to even more complex material, at some point I will show how to solve the problem that was discussed here. For now, I suggest that you study the material presented in this article and, most importantly, do not forget to reread what was covered in the previous ones. Because in the next article we are going to connect some concepts with this topic of indicators, which will be really interesting to see. So do not miss it.
Translated from Portuguese by MetaQuotes Ltd.
Original article: https://www.mql5.com/pt/articles/15932
Warning: All rights to these materials are reserved by MetaQuotes Ltd. Copying or reprinting of these materials in whole or in part is prohibited.
This article was written by a user of the site and reflects their personal views. MetaQuotes Ltd is not responsible for the accuracy of the information presented, nor for any consequences resulting from the use of the solutions, strategies or recommendations described.

- Free trading apps
- Over 8,000 signals for copying
- Economic news for exploring financial markets
You agree to website policy and terms of use