
From Basic to Intermediate: Indicator (IV)

Introduction
In the previous article "From Basic to Intermediate: Indicator (III)", we discussed how to create any type of indicator in a simple and practical way using compilation directives. However, we cannot or should not always do it this way. This approach is called static implementation because once the indicator type is defined, we cannot (or rather, do not allow) the user to change the type of rendering performed.
However, the number of indicators can be far greater than what has been shown up to this point. Indeed, for a wide range of activities, this type of implementation is already more than sufficient. However, there are situations where trading or market analysis may require somewhat different indicators.
In this article, we will learn how to create several different indicators. These indicators are very useful for communicating with other traders and for automated analysis of certain types of price movements, if you will.
So, let's start with something very simple and, in my opinion, quite interesting. We can create many other indicators using a very simple and understandable concept.
Inner bar indicator
There is a type of indicator, or rather an trading methodology, that uses what is called an inner bar. An inner bar is literally a bar or candle that is located inside the one immediately preceding it. However, depending on the trader and the symbol, any bar located inside another bar—not necessarily the immediately preceding one—can be considered an inner bar if the price movement did not break out of that bar and it can be located at some distance. But this latter way of viewing something as an inner bar is not a principle accepted by most traders.
In any case, this trading setup exists and at different times proves to be very convincing. Although constantly analyzing a chart to understand whether we are seeing an inner bar or not is, to put it mildly, quite difficult for many people, especially beginners. Therefore, we can use an indicator that follows the chart and shows us whether such a formation is present when the chart is open and active.
Important point: an inner bar is NOT necessarily a Doji.
«Okay, but why did you decide to show how to create this indicator?» The reason is very simple, my friend. Many novice traders try to create indicators to add color patterns to candles or bars, as they are often called. And these beginner programmers eventually give up because of how the indicator should be declared. It's not that creating a color pattern on candles is a difficult task. The problem lies elsewhere: Creating the indicator itself is a fairly simple task, as one might imagine.
However, as with other indicators shown in previous articles, caution must be exercised when declaring buffers. If you have already tried to create a color pattern on candles, you well know that it can be a challenging task for any beginner. Therefore, if we do this in the wrong order or enter the buffer indices in the wrong sequence, MetaTrader 5 will display something on the chart different from what we expected to see. You cannot blame either MetaTrader 5 or the programmer, because, depending on what we want to implement, for some it will be an error, and for others it will turn out to be exactly what is needed.
So, we will start by declaring the indicator itself, even before creating the inner bar indicator. Typically, everything can be declared in different ways, as shown in the code below:
01. //+------------------------------------------------------------------+
02. #property copyright "Daniel Jose"
03. //+------------------------------------------------------------------+
04. #property indicator_type1       DRAW_COLOR_CANDLES
05. #property indicator_color1      clrRed, clrRoyalBlue, clrGreen
06. //+----------------+
07. #property indicator_buffers     5
08. #property indicator_plots       1
09. //+----------------+
10. double  gl_Buff_High[],
11.         gl_Buff_Open[],
12.         gl_Buff_Close[],
13.         gl_Buff_Low[],
14.         gl_Buff_Color[];
15. //+------------------------------------------------------------------+
16. int OnInit()
17. {
18.     SetIndexBuffer(0, gl_Buff_High, INDICATOR_DATA);
19.     SetIndexBuffer(1, gl_Buff_Open, INDICATOR_DATA);
20.     SetIndexBuffer(2, gl_Buff_Close, INDICATOR_DATA);
21.     SetIndexBuffer(3, gl_Buff_Low, INDICATOR_DATA);
22.     SetIndexBuffer(4, gl_Buff_Color, INDICATOR_COLOR_INDEX);
23.
24.     return INIT_SUCCEEDED;
25. };
26. //+------------------------------------------------------------------+
27. int OnCalculate(const int rates_total, const int prev_calculated, const datetime &Time[], const double &Open[], const double &High[], const double &Low[], const double &Close[], const long &TickVolume[], const long &Volume[], const int &Spread[])
28. {
29.     for (int c = (prev_calculated > 0 ? prev_calculated - 1 : 0); c < rates_total; c++)
30.     {
31.         gl_Buff_High[c] = High[c];
32.         gl_Buff_Open[c] = Open[c];
33.         gl_Buff_Close[c] = Close[c];
34.         gl_Buff_Low[c] = Low[c];
35.
36.         gl_Buff_Color[c] = (Open[c] > Close[c] ? 0 : 2);
37.     }
38.
39.     return rates_total;
40. };
41. //+------------------------------------------------------------------+
Code 01
Now I ask you, dear readers: is what we see in code 01 correct or not? The correct answer to this question is: it all depends on the goal we are pursuing. In any case, such an implementation of code 01 is not entirely wrong, as the code will be compiled and can be useful. But depending on the intended goal, this code may be incorrect. Therefore, pay attention to what will happen when you use this code on any chart. This can be seen in the animation that follows:

Animation 01
In other words, the result was not quite as expected. Why? «I don't understand. The code seems correct. I didn't do anything wrong when declaring the buffers. However, the result was expected: the bars changed not only in color but also in format. I can't figure out what's wrong. Is there some trick to make everything work and get the desired result?» In this case, yes, dear readers.
Although the code is correct because it changed the color of the bars as expected, the same cannot be said about the formatting change. If the goal was to change the colors and simultaneously modify the bars, then yes. However, that is not what we intended. The reason lies precisely in the incorrect order of buffer declaration. Thus, when MetaTrader 5 uses the buffers, it will do so in a specific order. With the wrong order, the bar format was altered. Knowing this, all we have to do is change this order to a suitable one. This simple change can be seen in the code below:
                   .
                   .
                   .
18.     SetIndexBuffer(1, gl_Buff_High, INDICATOR_DATA);
19.     SetIndexBuffer(0, gl_Buff_Open, INDICATOR_DATA);
20.     SetIndexBuffer(3, gl_Buff_Close, INDICATOR_DATA);
21.     SetIndexBuffer(2, gl_Buff_Low, INDICATOR_DATA);
                   .
                   .
                   .
Code 02
Please note that in code snippet 02, the only thing that changed is the index value of each buffer. By using this buffer sequence (Open, High, Low, and Close), the result generated by code 01 can be seen just below:

Animation 02
Did you notice how MetaTrader 5 now understands how each bar or candle should be drawn? This is a very simple task for those who already know how to solve it. However, for those who don't understand, it may seem extremely difficult. In any case, now you know how to do it and can proceed to build color patterns to create indicators and model the desired trading system. To demonstrate how this can be done, let's consider solving the problem and indicating the inner bar directly on the chart.
To resolve this issue, look at line 36, which describes how we calculate the color index. This will be index zero for a Sell bar or index two for a Buy bar. But what use is this index to us? We leave this index for what will become the inner bar.
Now comes the key moment. The loop starting at line 29 begins from an old point, which may (or may not) be the first bar on the chart, and proceeds to search for the very last bar present on the chart. This is important to know and understand because an inner bar can only be marked if there is a previous bar with specific characteristics. Otherwise, the current bar cannot be considered and displayed on the chart as an inner bar.
So, everything is clear; all that remains is to implement the verification criteria. To do this, we must modify the code above so that it can assign colors to bars and candles, and additionally, check for the presence or absence of an inner bar. This enhancement is shown in code snippet 03:
                   .
                   .
                   .
36.         gl_Buff_Color[c] = (Open[c] > Close[c] ? 0 : 2);
37.         if ((c - 1) > 0)
38.             gl_Buff_Color[c] = ((High[c - 1] > High[c]) && (Low[c - 1] < Low[c]) ? 1 : gl_Buff_Color[c]);
39.     }
40.
41.     return rates_total;
42. };
43. //+------------------------------------------------------------------+
Code 03
Now, with each Calculate event that our indicator receives, we will check if there is an inner bar on the chart. But wait, why should we attempt to do this on every step? The reason is simple: during the trading phase, an inner bar may appear on the chart. However, it is not uncommon for it to become incorrectly configured. This is because we can only consider the presence or absence of an inner bar after the bar or candle has closed. Until that moment, it is premature to claim that there is an inner bar on the chart.
However, since line 38 periodically checks whether the inner bar condition can be applied or not, it turns out that in the end, if the inner bar becomes deconfigured, the test fails. Therefore, since we have already updated the color in line 36, the aforementioned indication is no longer displayed on the chart.
Although it is known that this works, ideally we should see how it happens in practice to understand why we implemented it this way. However, in the animation below, we can observe the initial process. But showing the second step—the deconfiguration of what should be an inner bar—is not so straightforward, as it requires a very specific moment, and capturing the exact point would take a great deal of time.
Animation 03
Excellent, here we can see what an inner bar should look like. However, as mentioned above, there are traders who consider multiple bars and regard all these new bars as inner bars as long as the new bars remain inside the previous one. This raises the question: how could we implement the same type of indicator by simply modifying the previous one?
There can be different answers to this question, or more precisely, different ways to implement the involved mechanism. The real problem is not the precise implementation of the code, but figuring out how to preserve a value over an extended period of time. A possible suggestion is provided below. Of course, depending on the case, you might use a different approach that you find more interesting or suitable.
Since we want to simplify the process as much as possible, we will make only one change to the implementation of the OnCalculate event handler. Thus, the source code that created animation 03 will be modified as follows:
                   .
                   .
                   .
26. //+------------------------------------------------------------------+
27. int OnCalculate(const int rates_total, const int prev_calculated, const datetime &Time[], const double &Open[], const double &High[], const double &Low[], const double &Close[], const long &TickVolume[], const long &Volume[], const int &Spread[])
28. {
29.    static double  high = DBL_MIN,
30.                   low = DBL_MAX;
31.
32.    for (int c = (prev_calculated > 0 ? prev_calculated - 1 : 0); c < rates_total; c++)
33.    {
34.       gl_Buff_High[c] = High[c];
35.       gl_Buff_Open[c] = Open[c];
36.       gl_Buff_Close[c] = Close[c];
37.       gl_Buff_Low[c] = Low[c];
38.
39.       gl_Buff_Color[c] = (Open[c] > Close[c] ? 0 : 2);
40.       if ((c - 1) > 0)
41.       {
42.          high = (High[c - 1] > high ? High[c - 1] : high);
43.          low = (Low[c - 1] < low ? Low[c - 1] : low);
44.          gl_Buff_Color[c] = ((high > High[c]) && (low < Low[c]) ? 1 : gl_Buff_Color[c]);
45.          if (gl_Buff_Color[c] != 1)
46.          {
47.             high = DBL_MIN;
48.             low = DBL_MAX;
49.          }
50.       }
51.    }
52.
53.    return rates_total;
54. };
55. //+------------------------------------------------------------------+
Code 04
Now pay attention. If the fragment shown in code 04 is placed into the code that generated animation 03, the result will differ from the previous animation. To confirm this, let's look carefully and compare the animation below with the animation above.
Animation 04
In animation 04, we are doing exactly what many traders consider an inner bar. That is, as long as there is no «breach» of the high or low of the previous bar or candle, we will consider the analyzed bar to be an inner bar. I know this may seem very confusing, especially if you are not accustomed to trading or observing inner bars. But code snippet 04 is able to recognize the pattern, even if multiple bars appear and all of them are inside a much older bar.
But how then does this code snippet work, and how does it manage to detect inner bars as shown in animation 04? To understand this, you first need to grasp how the earlier, simpler indicator operates. Only then can you comprehend this matter. Additionally, you must understand how static variables work. Since this topic has already been covered in a separate article, I will assume you are already familiar with static variables.
If you haven't read that article yet, here it is: "From Basic to Intermediate: Variables (II)". Now, looking at code 04, it becomes clear that the necessary change was made precisely in the inner bar test. The test is still conducted there. However, it has changed its position because now, before that happens, we perform two more tests. The first is at line 42, where we check if the high has been breached. At line 43, we perform a similar check, but in this case, we verify the low breach. Thus, we account for the boundary within which an inner bar can exist across several different bars, not just the immediately preceding one. Only by knowing these boundaries can we check whether the analyzed bar is a continuation bar. This is done at line 44.
Another important point is line 45. Here we check whether the test at line 44 indicates the presence of an inner bar. If there is no inner bar, the imposed boundaries must be destroyed to search for the formation of a new inner bar. If this check at line 45 were not performed, false readings would constantly be generated.
To help you understand what the inner bar indicator we have shown here is, let's look at the animation below.

Animation 05
In animation 05, we can observe something very interesting: the existence of an inner bar at a specific moment in time. However, since a breach occurred—in this case, the low was broken—what was once an inner bar ceased to be an inner bar and became just like any other bar. And even if the price returns to the point where we might think we have an inner bar again, the indicator will not show it, as can be seen in the image below.
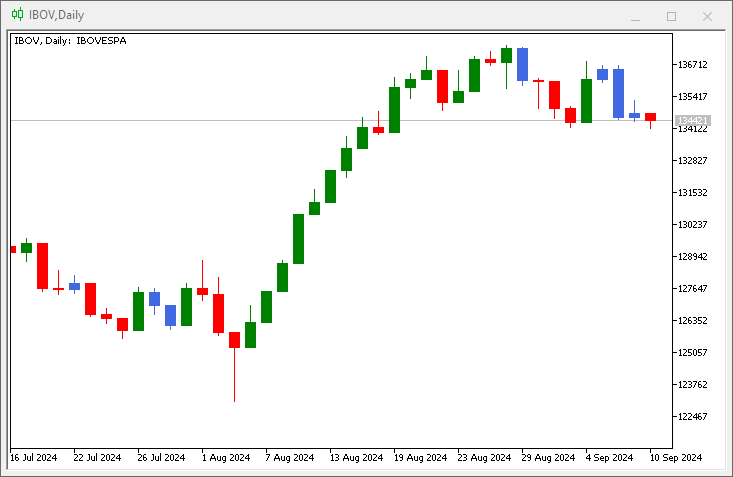
Figure 01
Please note that the symbol is trading back into the bar or candle that generated the three previous inner bar indications. However, according to the criteria implemented in the indicator, the last bar could no longer be considered an inner bar. In short, the indicator works, but we need to define and clearly formulate the accepted criteria to provide us with appropriate and desired information.
Very well, it has already been explained in detail how to apply color indicators to candles. Now we can address other issues that may (or may not) be related to indicators. However, due to the nature of the very concept of what an indicator is, I consider it appropriate to show other things within this same type of scenario.
What to display and what not to display
It is not uncommon for us to use different profiles for the same trading methodology in the market. Many traders prefer to have various types of information constantly displayed on the chart. Others prefer minimal information. The decision of what to display depends on each trader or working profile. However, for us as programmers, this is completely irrelevant. We don’t care how we prefer to set up our own chart. All we care about is providing simple and convenient tools so that everyone can customize the chart to their liking.
MetaTrader 5 allows us to configure much of this without the need for external applications. Yet there are elements that cannot be removed or changed using the options offered by MetaTrader 5—this is where programming comes to the rescue. You, as programmers, must understand that THERE ARE NO LIMITATIONS on what we can or cannot do. What actually exists is the greater or lesser technical capability of each programmer. Some will manage with simpler methods, while others will require more sophisticated tools.
In any case, the goal is to develop an application that can transform the chart into what we need, even if for other traders it might seem like complete chaos. But if you understand what you’ve created and profit from trading, that is what truly matters.
So, using MQL5 we can define and control various chart elements. To start, we’ll make a few simple changes that may be of interest at certain times. The aim is to show that when using MQL5, we have complete freedom and control over any chart element. For example, did you know that we can remove from the chart the area where quotes and the time zone are displayed? If we try to do this directly from MetaTrader 5, we won’t succeed. However, one way to achieve this is through code. Incidentally, the code we need to implement is quite simple. So let's start here. The initial code is shown below:
01. //+------------------------------------------------------------------+
02. #property copyright "Daniel Jose"
03. //+------------------------------------------------------------------+
04. int OnInit()
05. {
06.     ChartSetInteger(0, CHART_SHOW_DATE_SCALE, false);
07.     ChartSetInteger(0, CHART_SHOW_PRICE_SCALE, false);
08.
09.     return INIT_SUCCEEDED;
10. };
11. //+------------------------------------------------------------------+
12. int OnCalculate(const int rates_total, const int prev_calculated, const int begin, const double &price[])
13. {
14.     return rates_total;
15. };
16. //+------------------------------------------------------------------+
Code 05
Notice how simple the code 05 is. We don't need to explain anything; it is clearly understandable what we are doing. In fact, if we run this code on a chart, we will get the following result:
Animation 06
Indeed, we are being quite rough, as by removing the price and time scales without the user's permission, we do not restore them on the chart even when the indicator is removed. While many may consider this appropriate, others view such actions as disrespectful to the application, since restoring the time and price scales requires closing and reopening the chart, which most users are unwilling to do.
But the question arises: how can we return the chart to its original state? And if possible, when is the best time to do this? Well, there is actually a way to achieve this by intercepting the Deinit event. However, we must understand the following: there is no "best" time, only the "appropriate" time. I say this because it might happen that our application does something that forces MetaTrader 5 to remove it from the chart. If this occurs, the Deinit event will not be triggered, as the removal will be forced. Consequently, all changes made by our application will remain on the chart, and we will have to close and reopen it to restore everything to its original state.
Therefore, such changes should always be made cautiously. And whenever possible, give the user the option to choose what to remove from the chart, especially if your application aims to facilitate their work.
Alright, let's create a more polite way to implement what was shown in animation 06. To do this, we will modify code 05 as follows:
01. //+------------------------------------------------------------------+
02. #property copyright "Daniel Jose"
03. //+------------------------------------------------------------------+
04. input bool user01 = true;       //Show time scale
05. input bool user02 = true;       //Show price scale
06. //+----------------+
07. struct st_Mem
08. {
09.     long    View_DateScale,
10.             View_PriceScale;
11. }gl_StyleGraphic;
12. //+------------------------------------------------------------------+
13. int OnInit()
14. {
15.     gl_StyleGraphic.View_DateScale = ChartGetInteger(0, CHART_SHOW_DATE_SCALE);
16.     gl_StyleGraphic.View_PriceScale = ChartGetInteger(0, CHART_SHOW_PRICE_SCALE);
17.
18.     ChartSetInteger(0, CHART_SHOW_DATE_SCALE, user01);
19.     ChartSetInteger(0, CHART_SHOW_PRICE_SCALE, user02);
20.
21.     return INIT_SUCCEEDED;
22. };
23. //+------------------------------------------------------------------+
24. int OnCalculate(const int rates_total, const int prev_calculated, const int begin, const double &price[])
25. {
26.     return rates_total;
27. };
28. //+------------------------------------------------------------------+
29. void OnDeinit(const int reason)
30. {
31.     ChartSetInteger(0, CHART_SHOW_DATE_SCALE, gl_StyleGraphic.View_DateScale);
32.     ChartSetInteger(0, CHART_SHOW_PRICE_SCALE, gl_StyleGraphic.View_PriceScale);
33. };
34. //+------------------------------------------------------------------+
Code 06
Now, note that we have become much more polite. This happens because in lines 04 and 05, we ask the user for permission to remove both the price and time scales. In line 07, we use a structure to store the original values so that we can restore the chart to the state it was in before applying the indicator, regardless of any changes made by the user.
Here, we are acting similarly to code 05, which was simple and clear. However, I would like to draw your attention to something else: the Deinit event handler. It's on line 29. The issue is that even after removing the indicator from the chart, MetaTrader 5 takes some time to update the chart where the indicator was located—sometimes seconds, sometimes a bit longer. During this short interval, some information may be missing, while other information has not yet been removed. This can create the impression that the platform is running slowly or that the user's hardware is outdated. However, the problem actually lies in the fact that MetaTrader 5 is busy with other tasks.
To make the process smoother, I suggest using a call to the MQL5 standard library at specific moments to force MetaTrader 5 to update the chart as quickly as possible. At different times, this may be completely unnecessary. But if you notice a delay between events, you can use this call to skip the event queue that MetaTrader 5 is currently processing.
The changes that need to be made can be seen in the code snippet below:
                   .
                   .
                   .
28. //+------------------------------------------------------------------+
29. void OnDeinit(const int reason)
30. {
31.     ChartSetInteger(0, CHART_SHOW_DATE_SCALE, gl_StyleGraphic.View_DateScale);
32.     ChartSetInteger(0, CHART_SHOW_PRICE_SCALE, gl_StyleGraphic.View_PriceScale);
33.     ChartRedraw();
34. };
35. //+------------------------------------------------------------------+
Code 07
Simply adding line 33, which can be seen in code 07, will be enough for the user—and for you as well—to perceive a noticeable improvement in MetaTrader 5’s performance.However, it is important to remember that this improvement is only apparent. There is no actual performance enhancement. The call on line 33 informs MetaTrader 5 that we want to skip the event queue so the chart is updated as quickly as possible. Nevertheless, keep in mind: by skipping the queue, we postpone an event that may be important and could trigger at another time. Therefore, be cautious when altering the execution order.
Concluding thoughts
In this article, we have seen how easy it is to create and implement an operational approach for coloring candles—a concept highly valued by many traders. When implementing such things, care must be taken to ensure that the bars or candles retain their original appearance and do not hinder reading candle by candle.
Furthermore, we have demonstrated how various chart elements can be modified, although the article only showed how to do this with two properties: the time and price scales. These scales, in turn, cannot be removed using any resource directly available to the average user. However, this is entirely possible and achievable through code. It is important to remember that whenever possible, the chart should be restored to its original state, as this enhances the user experience and indicates that the application is well-designed.
Since there are several attributes and properties that can be modified, and it would be cumbersome to address them one by one, I encourage you to practice and experiment with using and changing these properties through MQL5 code. To make this easier, you can refer to the list of chart properties, as many displayed elements and values are only accessible through MQL5 code. Keep in mind that the application should only include codes that are genuinely necessary for practicing and learning what is demonstrated in the article.
Translated from Portuguese by MetaQuotes Ltd.
Original article: https://www.mql5.com/pt/articles/15833
Warning: All rights to these materials are reserved by MetaQuotes Ltd. Copying or reprinting of these materials in whole or in part is prohibited.
This article was written by a user of the site and reflects their personal views. MetaQuotes Ltd is not responsible for the accuracy of the information presented, nor for any consequences resulting from the use of the solutions, strategies or recommendations described.

- Free trading apps
- Over 8,000 signals for copying
- Economic news for exploring financial markets
You agree to website policy and terms of use