Nine Lives of DeMarker MT5
- Indikatoren
- Version: 4.4
- Aktualisiert: 18 November 2021
- Aktivierungen: 5

Der DeMarker (DeM)-Indikator ist ein weiteres Mitglied der Oszillator-Familie der technischen Indikatoren. Händler verwenden den Index, um überkaufte und überverkaufte Bedingungen zu bestimmen, Risikoniveaus einzuschätzen und festzustellen, wann eine Preiserschöpfung unmittelbar bevorsteht.
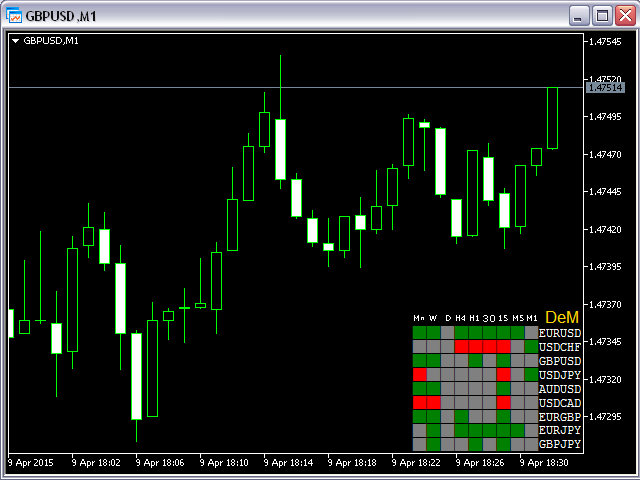
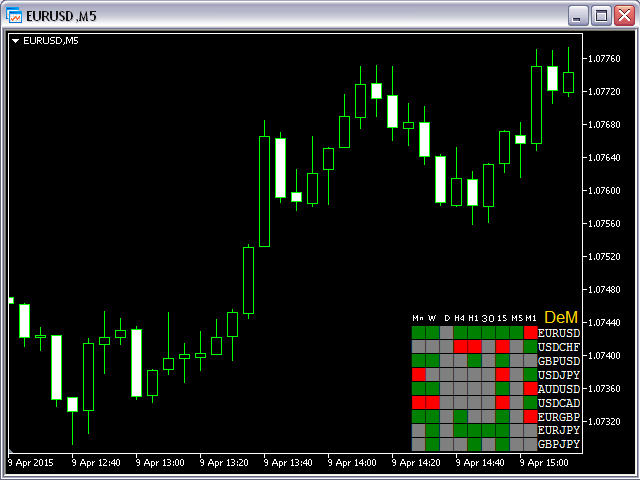
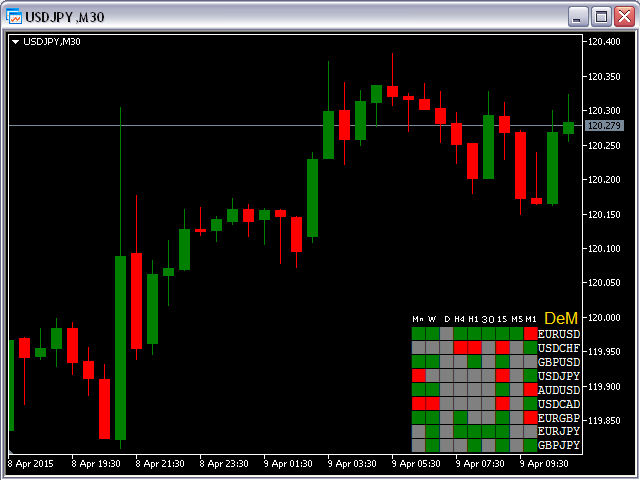
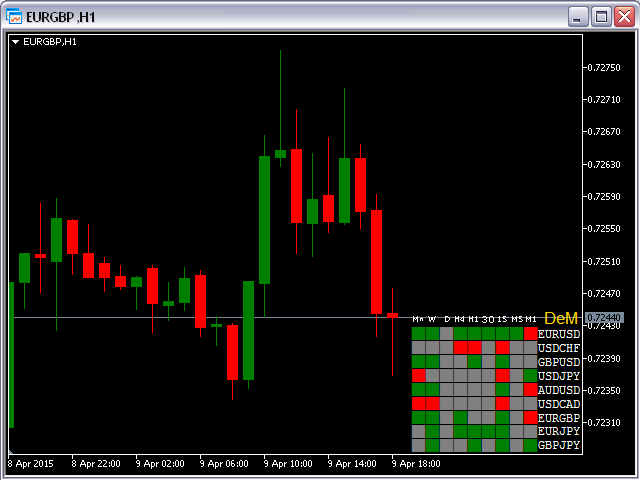
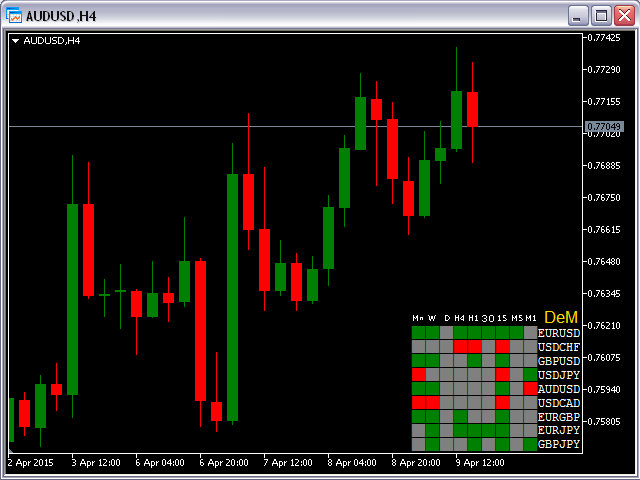
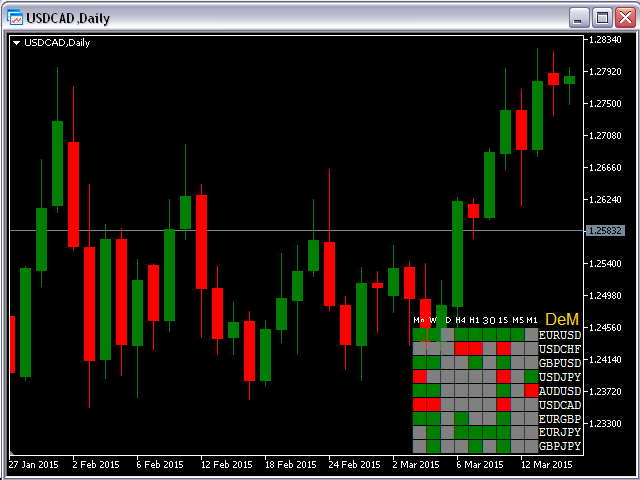
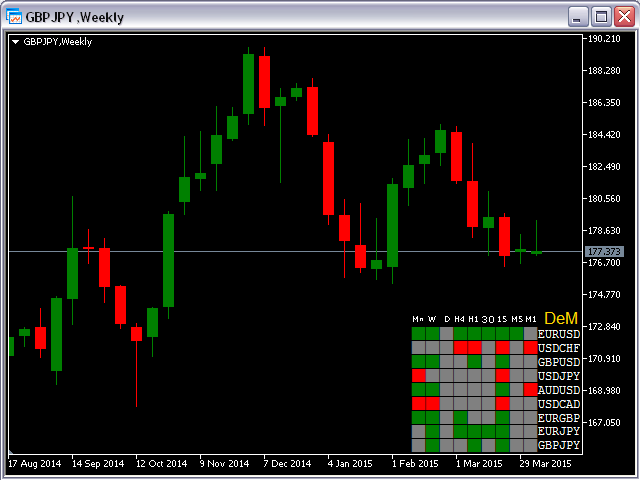
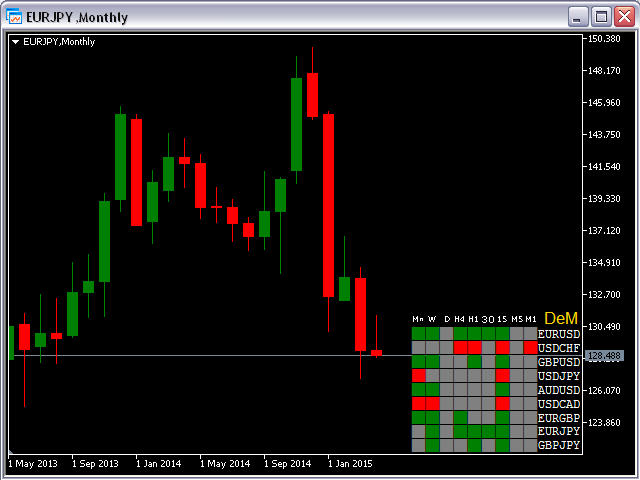
Dieser Indikator zeigt DeMarker-Daten von 9 Währungspaaren Ihrer Wahl für alle 9 Zeitrahmen an.
Wenn ein digitaler Wert von DeM kleiner oder gleich DnLevel = 0,3 (oder eine von Ihnen festgelegte Zahl) ist, erscheint ein grünes Quadrat. Dies ist ein potenziell überverkaufter Zustand und könnte ein guter Zeitpunkt sein, um Long zu gehen .
Wenn ein digitaler Wert von DeM größer oder gleich UpLevel = 0,7 (oder der von Ihnen gewählten Zahl) ist, erscheint ein rotes Quadrat. Dies ist möglicherweise ein überkaufter Zustand und ein guter Zeitpunkt, um zu verkaufen.
Wenn ein digitaler Wert von DeM zwischen UpLevel und DnLevel liegt, erscheint ein graues Quadrat.
Eingabe-Parameter
- Von Symb1 bis Symb9 - Sie können jeden dieser Parameter auf ein beliebiges legales Währungspaar ändern, das auf Ihrer Plattform vorhanden ist.
- dPeriod = 14 - Mittelungszeitraum für den DeM.
- UpLevel = 0.7 - überkauftes Niveau.
- DnLevel = 0,3 - überverkauftes Niveau.
- SymbColor = clrWhite - Sie können die Farbe aller Labels ändern.