Pipsurfer
- Indikatoren
- Version: 2.0
- Aktualisiert: 22 Juni 2023
- Aktivierungen: 11
Überblick:
Bei so viel Lärm und Ablenkung auf den Märkten wollte ich Klarheit schaffen, damit Händler eine einfache, effiziente und unterhaltsame Handelserfahrung machen können. Aus diesem Grund habe ich Pipsurfer entwickelt. Pipsurfer ist ein Trendfolge-Indikator, der Ihnen wichtige Institutional Smart Money-Levels auf dem Markt visuell anzeigt und Ihnen hilft, die Marktstruktur auf den Märkten zu verfolgen. Die meisten Trader finden es schwierig, Handelselemente wie Trend, Struktur und Momentum visuell zu erkennen, die für das Verständnis eines potenziellen Einstiegs entscheidend sind.
Nachdem ich Hunderten von Menschen das Handeln beigebracht habe und derzeit über 2000 Schüler habe, habe ich gesehen, warum so viele Händler damit kämpfen, effektive Ergebnisse in der Handelswelt zu erzielen, und ich wollte den kämpfenden Händlern eine Antwort geben, um endlich diese Ebene des Verständnisses und des Könnens im Handel zu erreichen. Jede Komponente von Pipsurfer wurde sorgfältig kalibriert und entwickelt, um Händlern eine einzigartige, aber effektive Handelserfahrung zu ermöglichen.
Pipsurfer Eigenschaften:
- Ein sehr einfach zu verstehendes Handelsfenster, das Ihnen zeigt, worauf Sie im Markt achten sollten
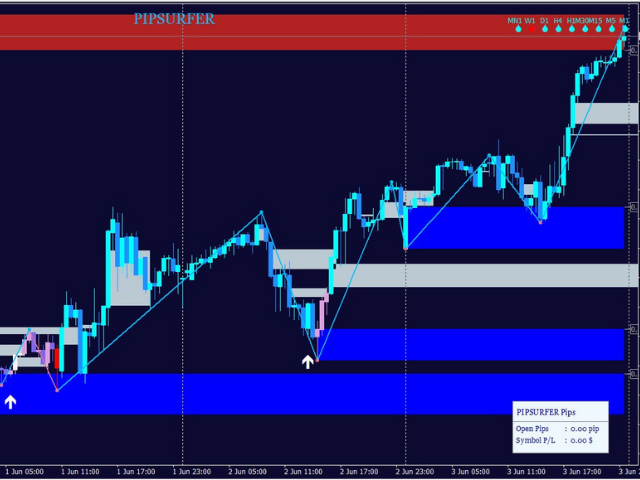
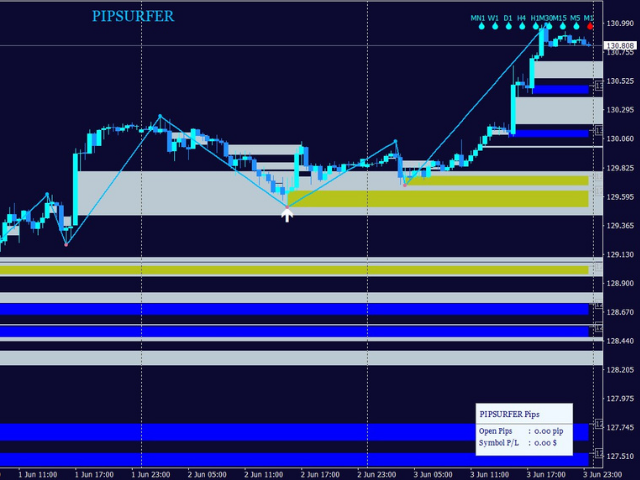
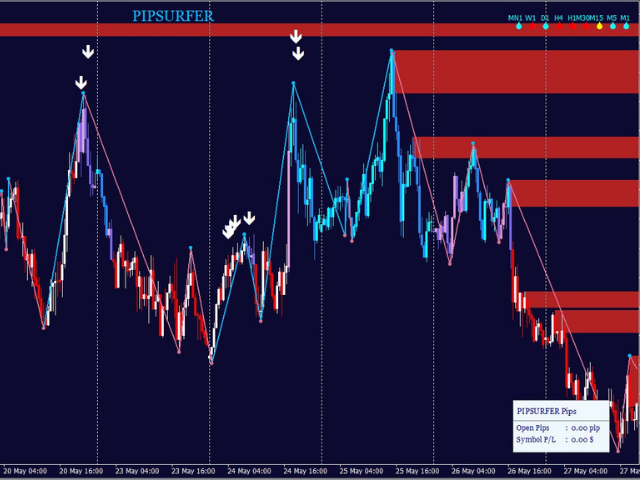
- Einstiegssignalpfeile basierend auf vielen verschiedenen Marktstrukturen, Trends und institutionellen Niveaus
- 2 eingebaute Trendindikatoren für den langfristigen und kurzfristigen Trend, das Multi-Zeitrahmen-Dashboard, das Ihnen den langfristigen Trend auf jedem Zeitrahmen für dieses Paar anzeigt, und die Trendkerzen, die ihre Farbe je nach dem unmittelbaren und kurzfristigen Trend ändern.
- Automatisierte institutionelle Angebots- und Nachfragezonen (blaue und rote Zonen), die sich von den einfachen Unterstützungs- und Widerstandszonen für Einzelhändler unterscheiden, zeigen die tatsächlichen, effektiveren Preisniveaus.
- Ungleichgewichtszonen (graue Zonen), die Ihnen helfen, die oft versteckten Smart-Money-Levels auf dem Markt zu erkennen, damit Händler wissen, auf welche Levels sie achten müssen, damit der Handel reibungslos verläuft.
- Marktstruktur-Indikator, der Ihnen anzeigt, wann die Märkte eine bullische oder bearische Struktur aufweisen
- Pip-Zähler und Profit-Tracker
- Zugang zu einem Setup- und Pipsurfer-Strategiekurs
- Zugang zu meinen wöchentlichen Live-Calls
- Freier Zugang zum Tide Meter Indikator (aufgeführt in MQL5), der entwickelt wurde, um mit dem Pipsurfer Indikator zu arbeiten und Händlern zu helfen, Schwankungen im Momentum in Echtzeit zu bestimmen.
Haftungsausschluss:
*Pipsurfer garantiert keine Gewinne und der Handel beinhaltet ein finanzielles Risiko. Handeln Sie nicht mit Geld, das Sie sich nicht leisten können zu verlieren. Lassen Sie sich von einem lizenzierten Finanzfachmann beraten, um festzustellen, ob der Handel das Richtige für Sie ist.