PipTick Pairs Spread MT5
- Indikatoren
-
Michal Jurnik
 "Talent is cheaper than table salt. What separates the talented individual from the successful one is a lot of hard work." - Stephen King. Those few words reflect myself very well. I am probably not the most talented developer in the world but I truly believe in hard work, professional attitude and
 - Version: 1.5
- Aktualisiert: 1 Dezember 2021
- Aktivierungen: 5
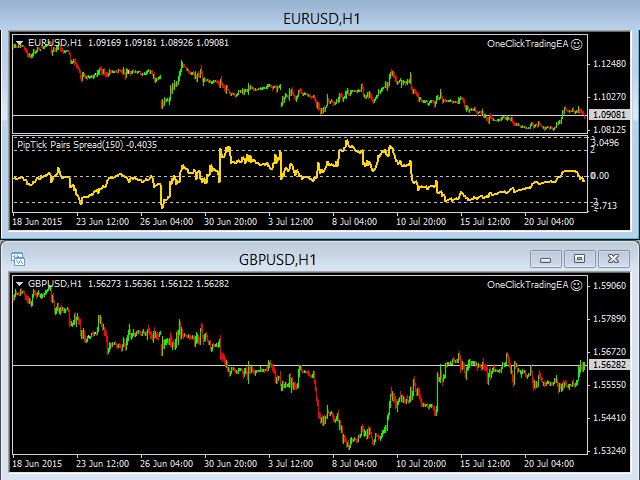
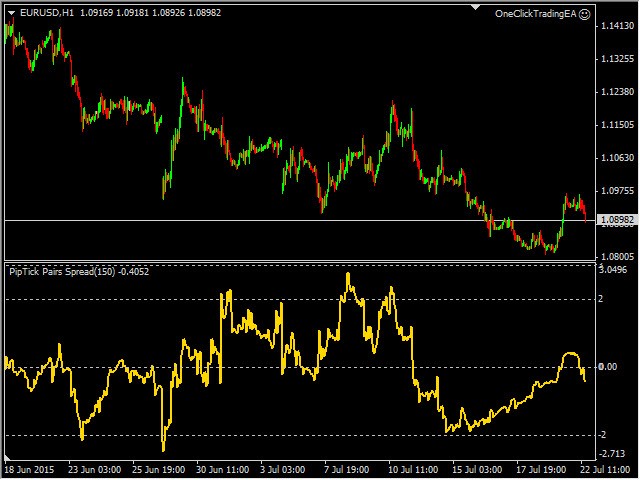
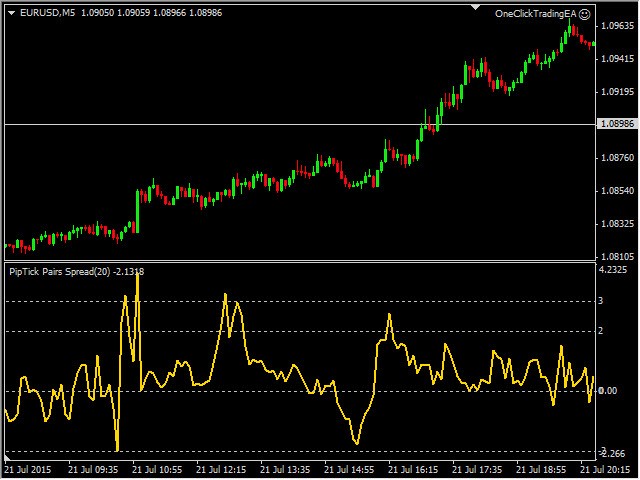
DerPairs Spread Indikator wurde für die beliebte Strategie des Pairs Trading, Spread Trading oder der statistischen Arbitrage entwickelt. Dieser Indikator misst den Abstand (Spread) zwischen den Preisen von zwei direkt (positiv) korrelierten Instrumenten und zeigt das Ergebnis als Kurve mit Standardabweichungen an. So können Händler schnell erkennen, wann die Instrumente zu weit auseinander liegen und diese Information für Handelsmöglichkeiten nutzen.
So verwenden Sie den Pairs Spread Indikator
Die besten Ergebnisse werden erzielt, wenn der Handel zwischen der zweiten und der dritten Standardabweichung eröffnet wird.
- Der Indikator liegt zwischen der 2. und 3. Standardabweichung - SELL Pair 1, BUY Pair 2.
- Der Indikator liegt zwischen der 2. und 3. Standardabweichung - KAUFEN Paar 1, VERKAUFEN Paar 2.
Geeignete Währungspaare
- EURUSD vs. GBPUSD
- EURUSD vs. NZDUSD
- USDCHF vs. USDJPY
- AUDUSD vs. GBPUSD
- AUDUSD vs. EURUSD
Wichtigste Merkmale
- Der Indikator zeigt die Abweichungen vom Normalzustand an.
- Ein einfacher Vergleich der tatsächlichen Korrelation zwischen zwei Währungspaaren.
- Der Bereich der zweiten und dritten Standardabweichung für den Einstieg in die Trades.
- Funktioniert auf jedem Zeitrahmen (M1, M5, M15, M30, H1, H4, D1, W1, MN).
- Der Indikator ist nicht nachbildend.
- Bereit für Backtesting (anpassbare Rückblicksperiode).
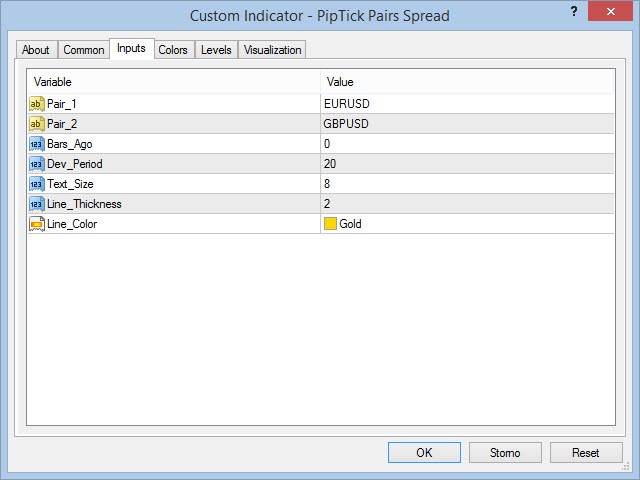
- Anpassbare Parameter (Farben, Liniendicke, Abweichungsperiode...).
- Hochgeschwindigkeitsberechnung.
- Der Indikator arbeitet auch mit Präfixen und Suffixen von Symbolen (EURUSD.m, EURUSD-pro...).
- Verfügbar für MT4 und MT5.
Bitte besuchen Sie die Produktseite PairsSpread Indikator für die Einstellungen der Eingabe- und Ausgabeparameter.

Der Benutzer hat keinen Kommentar hinterlassen