Currency Barometer MT5 Indicator by PipTick
- Indicadores
-
Michal Jurnik
 "Talent is cheaper than table salt. What separates the talented individual from the successful one is a lot of hard work." - Stephen King. Those few words reflect myself very well. I am probably not the most talented developer in the world but I truly believe in hard work, professional attitude and
 - Versión: 2.1
- Actualizado: 3 diciembre 2021
- Activaciones: 5
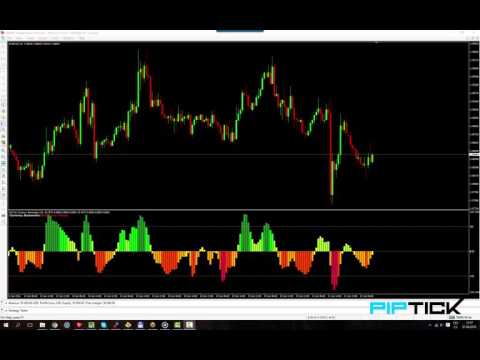
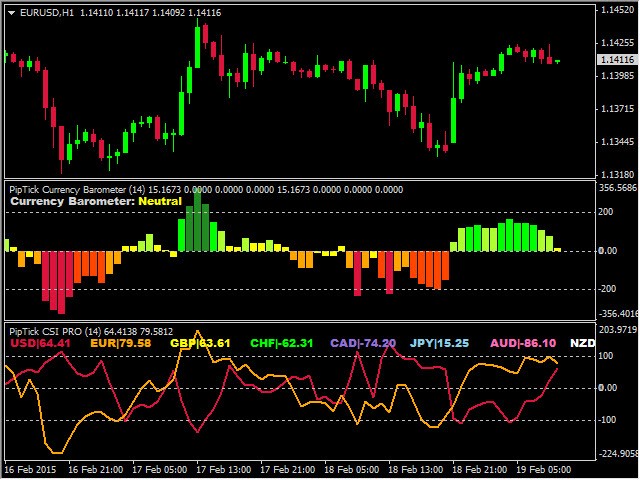
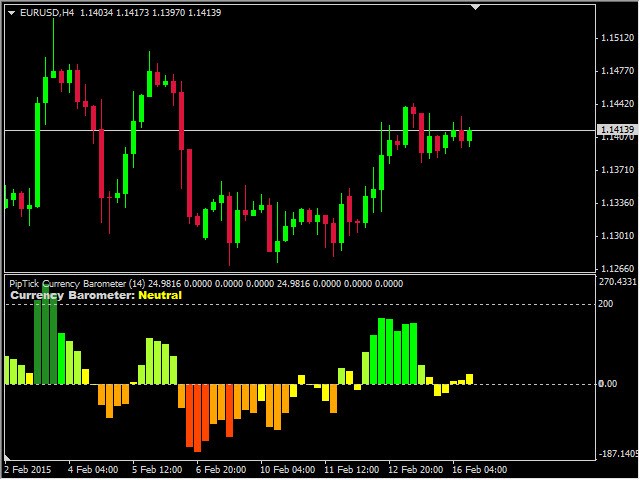
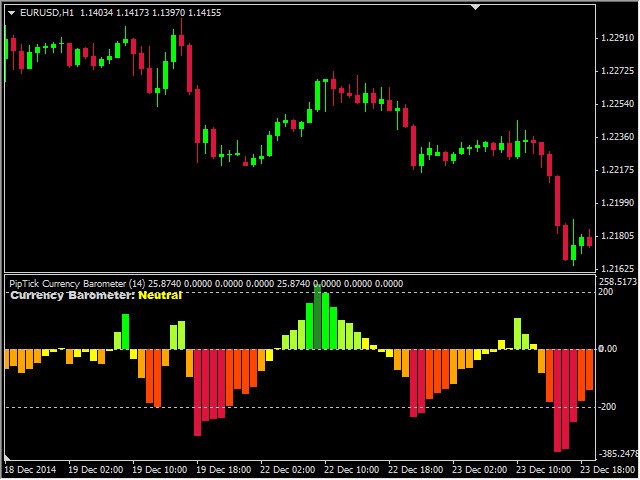
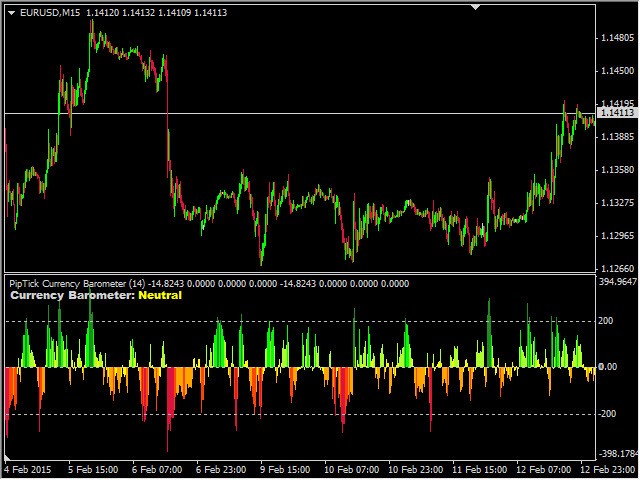
Elindicador Barómetro de divisas es una herramienta única que mide la fuerza de dos divisas representadas en el par y compara la diferencia entre ellas. El resultado se muestra como un histograma en el que puede identificar de forma sencilla qué divisa es la más fuerte. Este indicador está diseñado para medir las fortalezas y debilidades de ocho divisas principales (USD, EUR, GBP, CHF, CAD, JPY, AUD y NZD) y funciona en 28 pares de divisas. El indicador utiliza el método CI (Commodity Channel Index) para calcular la fuerza y la debilidad de las divisas.
Interpretación
El indicador se divide en tres zonas.
- Zona de sobrecompra - por encima de la línea de 200.
- Zona normal - entre las líneas de 200 y -200.
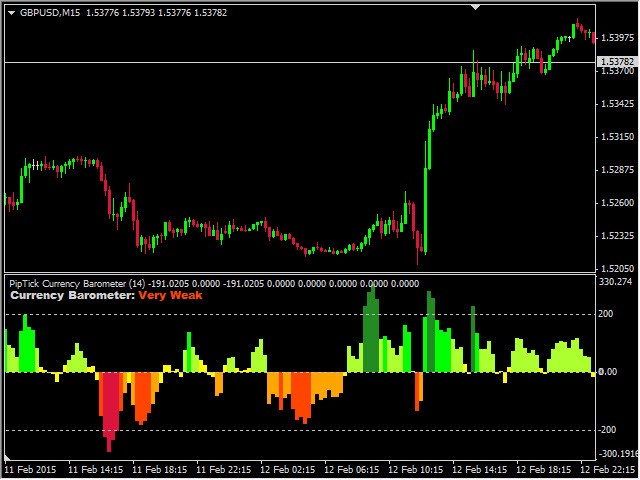
- Zona de sobreventa - por debajo de la línea de -200.
Dado que el Barómetro de divisas compara la primera divisa del par con la segunda, es mejor utilizar una escala sofisticada.
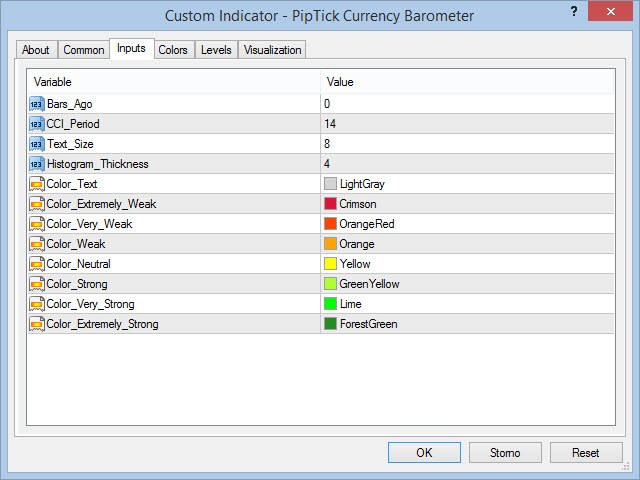
- Extremadamente fuerte - ForestGreen.
- Muy fuerte - Verde lima.
- Fuerte - VerdeBajo.
- Neutral - Amarillo.
- Débil - Naranja.
- Muy débil - NaranjaRojo.
- Extremadamente débil - Carmesí.
¿Cómo utilizar el barómetro de divisas?
Estamos seguros de que hay muchas maneras de utilizar nuestro Barómetro de Divisas. Por ejemplo, puede operar con divergencias entre el precio y el indicador. Por supuesto, también puede operar con la estrategia de tendencia clásica: comprar una divisa fuerte y vender una débil. Sin embargo, nunca utilice esta estrategia si el Barómetro de Divisas se encuentra en la zona extrema. Por el contrario, esto suele ser una oportunidad para operar en la dirección opuesta (estrategia inversa).
Características principales
- Una simple comparación de la fuerza de dos divisas.
- El indicador funciona con 28 pares.
- Reconocimiento automático del par de divisas.
- Zonas de sobrecompra y sobreventa para entrar o salir de las operaciones.
- Funciona en todos los marcos temporales (M1, M5, M15, M30, H1, H4, D1, W1 y MN).
- No repinta.
- Preparado para backtesting (periodo de retrospectiva personalizable).
- Parámetros personalizables (colores, grosor de línea, periodo...).
- Alta velocidad de cálculo.
- El indicador funciona también con prefijos y sufijos de símbolos (EURUSD.m, EURUSD-pro...).
- Se puede utilizar para crear un EA (Expert Advisor).
- Disponible para MT4 y MT5.