Chart Window ControlPanel MT4
- Indikatoren
- Version: 4.15
- Aktualisiert: 24 April 2020
- Aktivierungen: 5

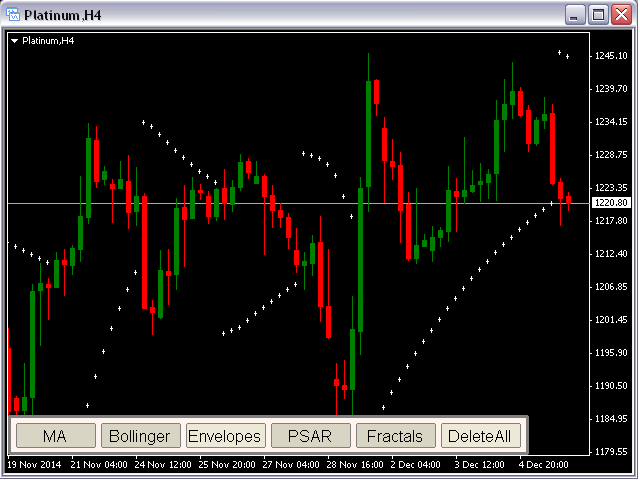
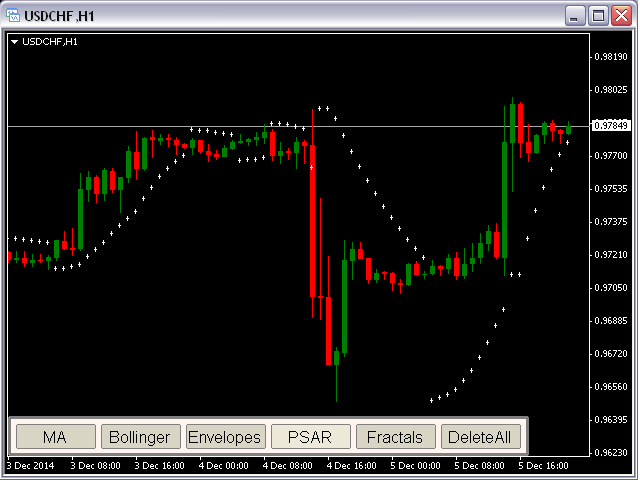
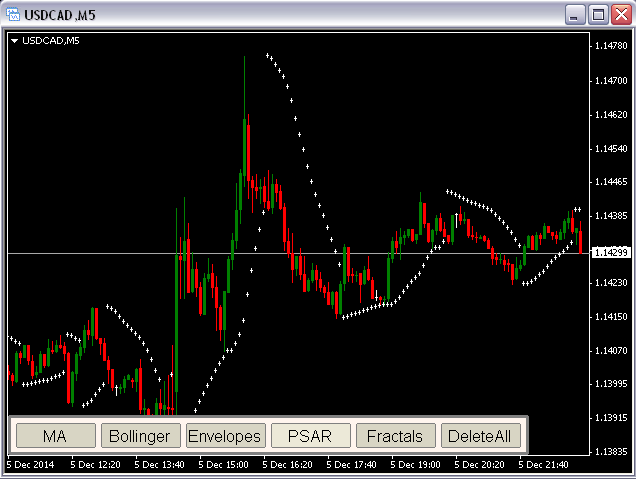
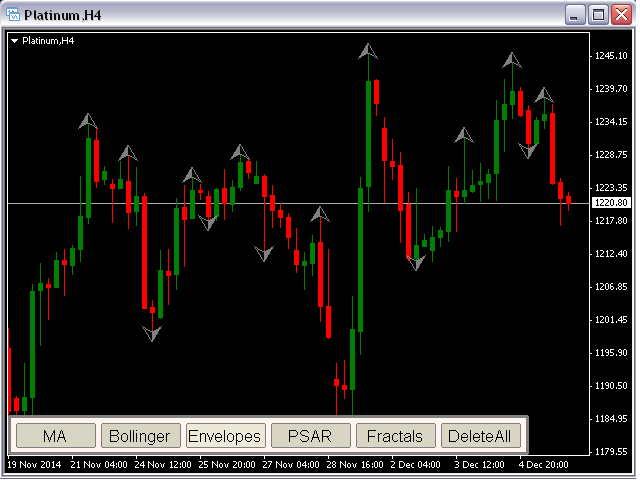
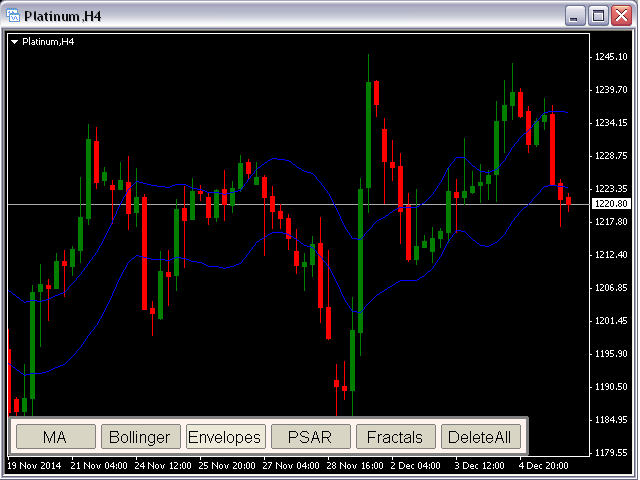
Dies ist ein Kontrollfeld für die wichtigsten Chart-Indikatoren: Gleitende Durchschnitte, Bollinger Bänder, Hüllkurven, PSAR und Fraktale.
Sie haben die Möglichkeit, alle Eingabeparameter für jeden Indikator zu ändern.
Zum Beispiel:
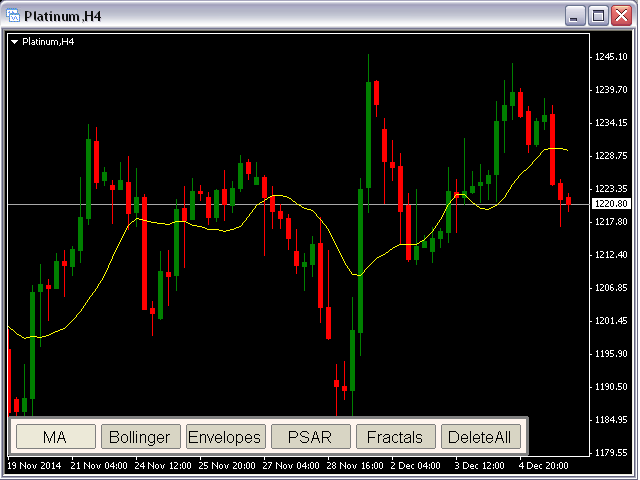
MA
- maPeriod = 13;
- ma_method = MODE_SMA;
- app_price = PRICE_CLOSE;
- maColor = Gelb;
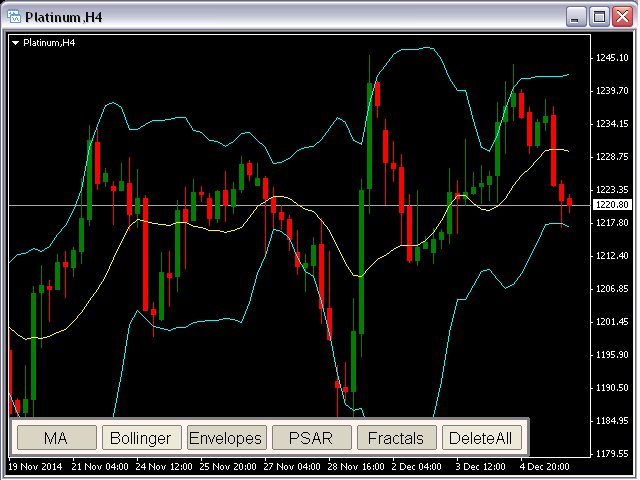
Bänder
- bbPeriod = 20;
- bb_dev = 2;
- bb_Price = PRICE_CLOSE;
- bbColor = Aqua;
Dieser Indikator ist hilfreich für diejenigen, die gerne viele Indikatoren verwenden, bevor sie eine Entscheidung treffen.