All TimeFrames CCI MT4
- Indikatoren
- Version: 2.8
- Aktualisiert: 24 April 2020
- Aktivierungen: 5

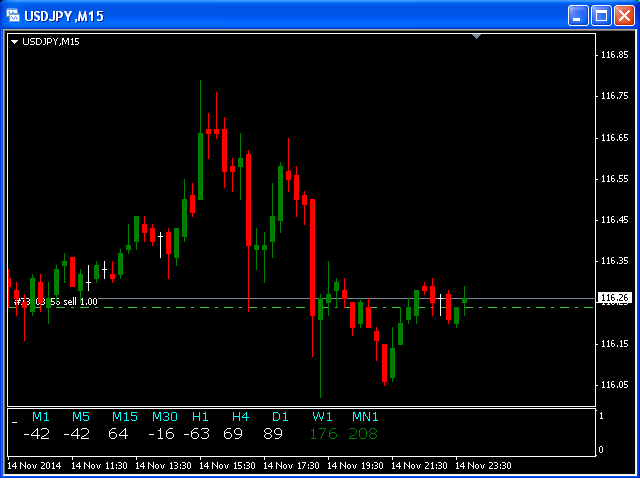
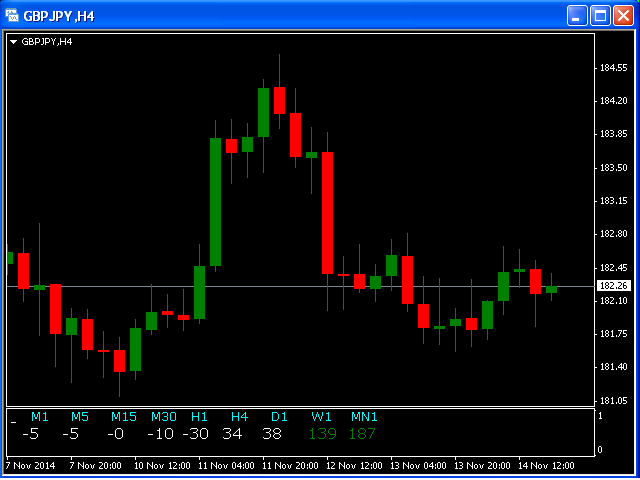
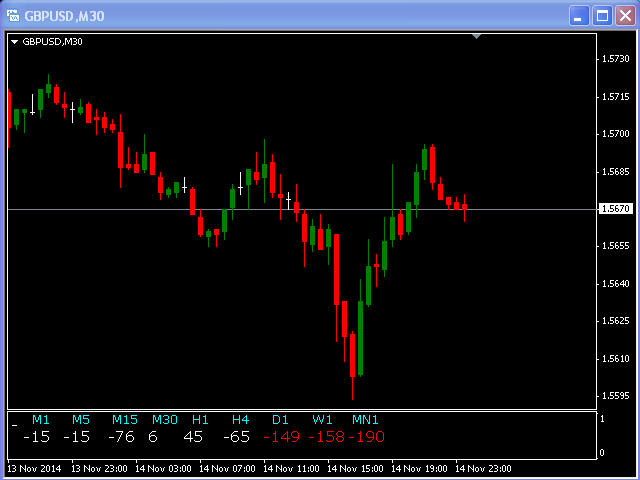
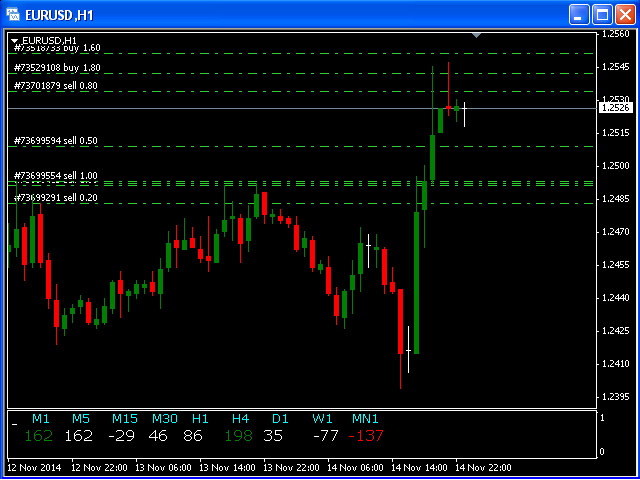
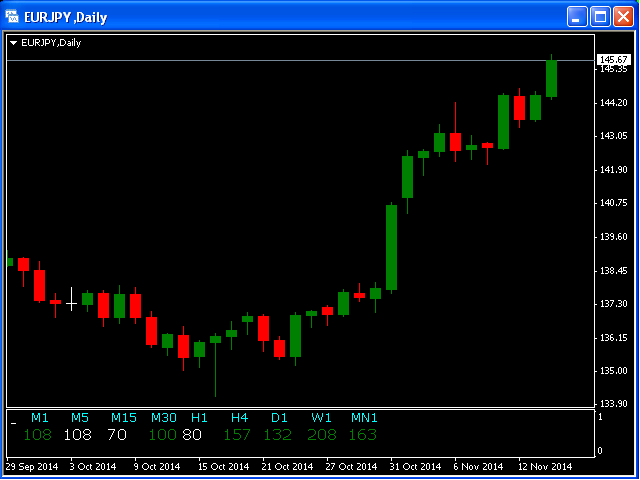
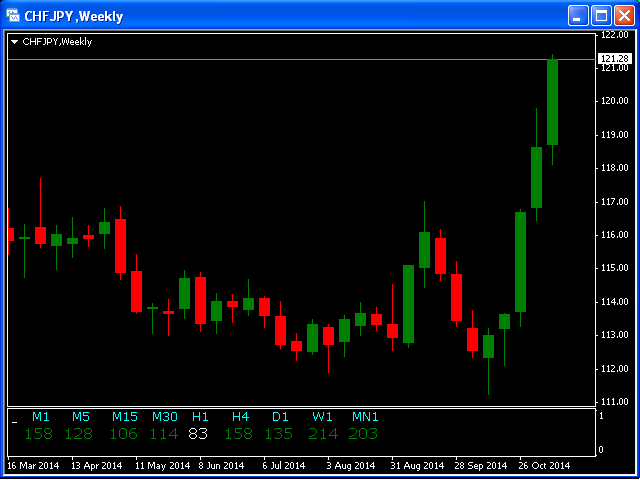
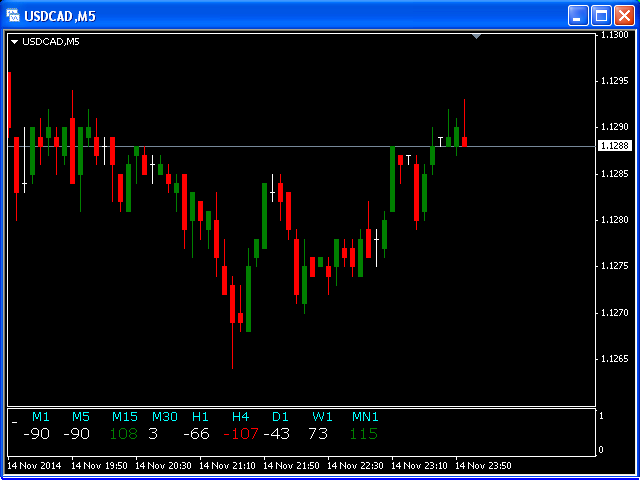
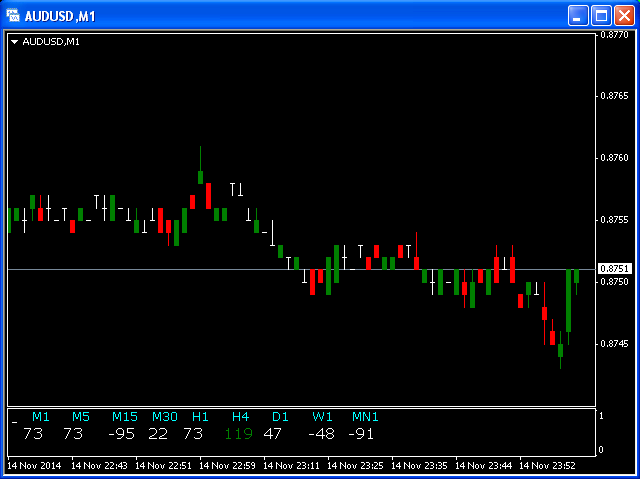
Dieser Indikator basiert auf dem klassischen Indikator CCI (Commodity Channel Index) und ist für diejenigen hilfreich, die nicht nur eine visuelle, sondern auch eine digitale Darstellung des Indikators lieben und zu nutzen wissen. All TimeFrames CCI MT4 Indikator zeigt Werte aus jedem Zeitrahmen.
Sie werden in der Lage sein, die wichtigsten Eingabeparameter für jeden CCI für jeden TF zu ändern.
Beispiel für M1:
- sTF1_____ = "M1";
- Periode1 = 13;
- Preis1 = PRICE_CLOSE.