All TimeFrames CCI MT4
- Indicadores
- Versión: 2.8
- Actualizado: 24 abril 2020
- Activaciones: 5

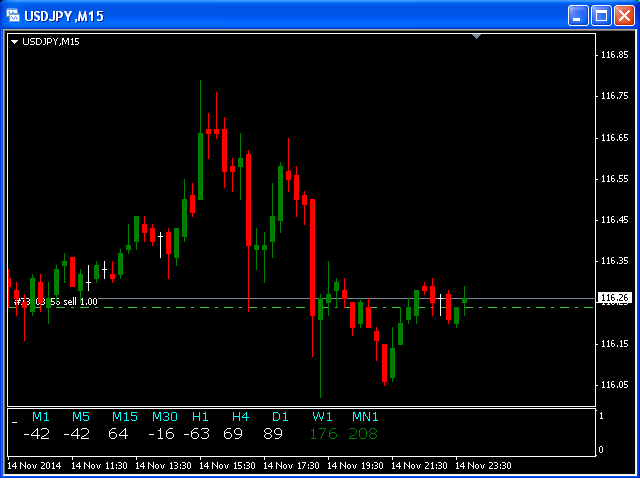
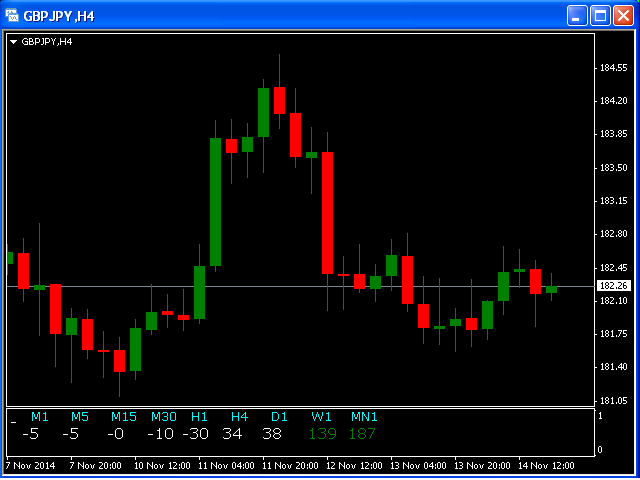
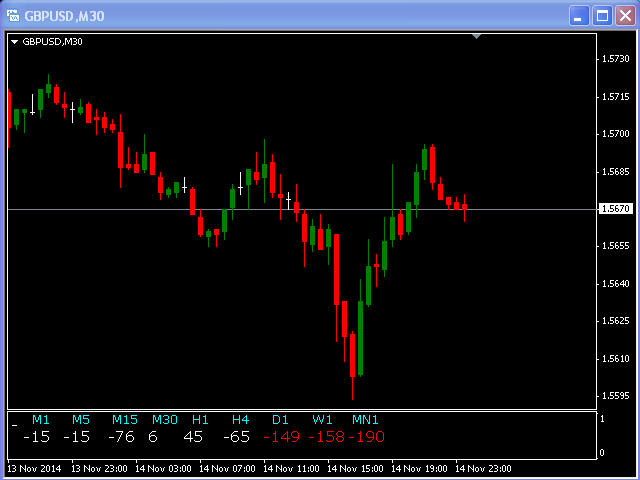
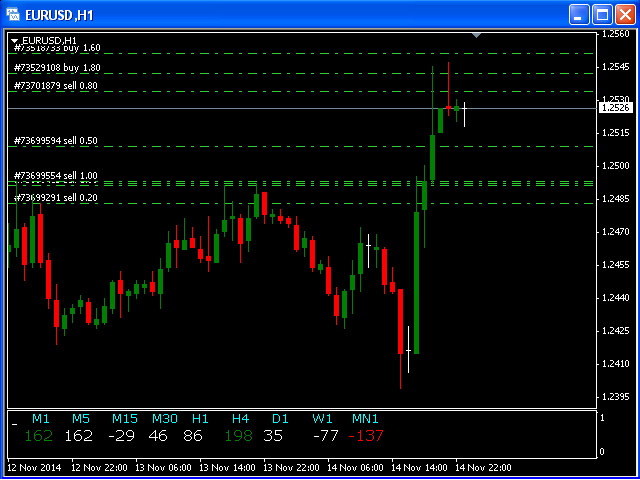
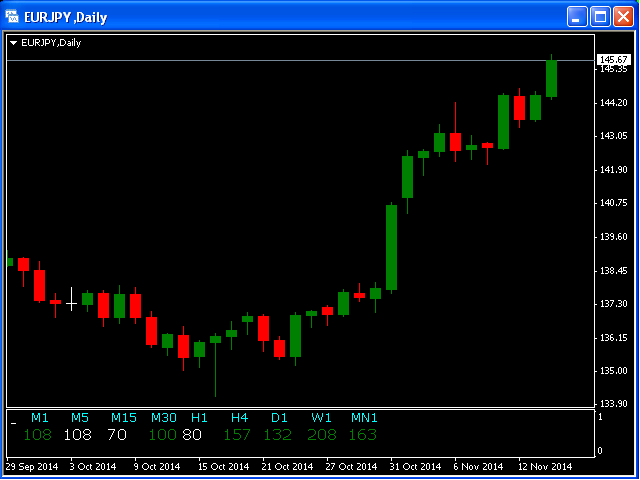
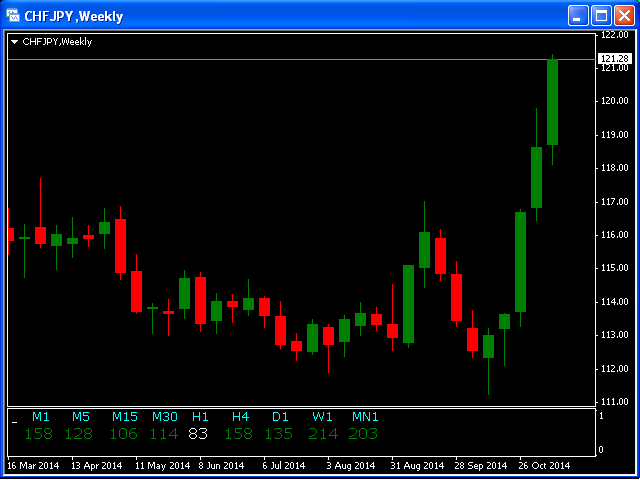
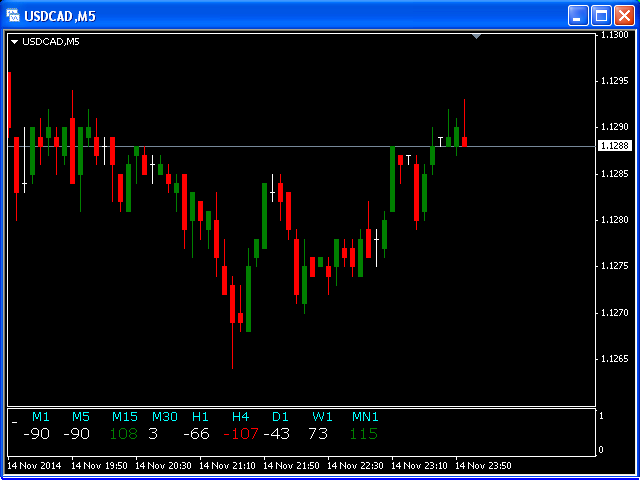
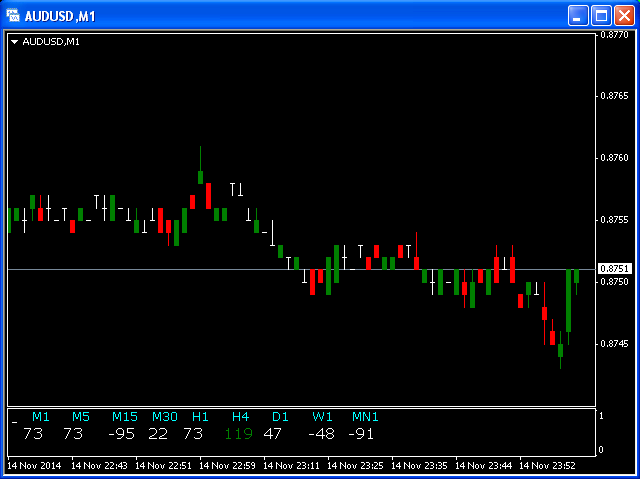
Este indicador se basa en el indicador clásico CCI (Commodity Channel Index) y será útil para aquellos que aman y saben cómo utilizar no una representación visual, sino digital del indicador. All TimeFrames CCI MT4 indicador muestra los valores de cada marco de tiempo.
Usted será capaz de cambiar los principales parámetros de entrada para cada CCI para cada TF.
Ejemplo para M1:
- sTF1_____ = "M1";
- Periodo1 = 13;
- Precio1 = PRECIO_CIERRE.