Fibo World
- Indikatoren
-
Pavel Verveyko
 Writing scripts, indicators, EAs on MQL5 and MQL4.
Fast, Reliable, And High-Quality.
For all questions, please contact personal messages. - Version: 1.1
- Aktivierungen: 5
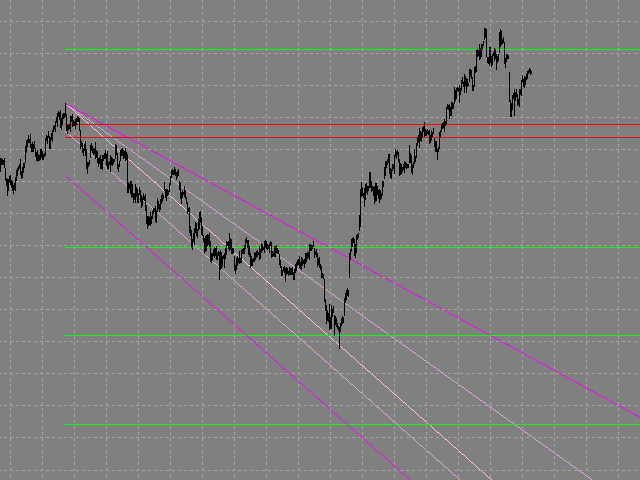
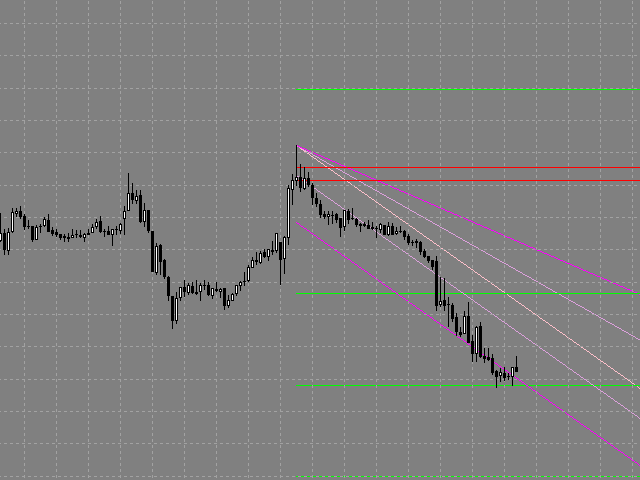
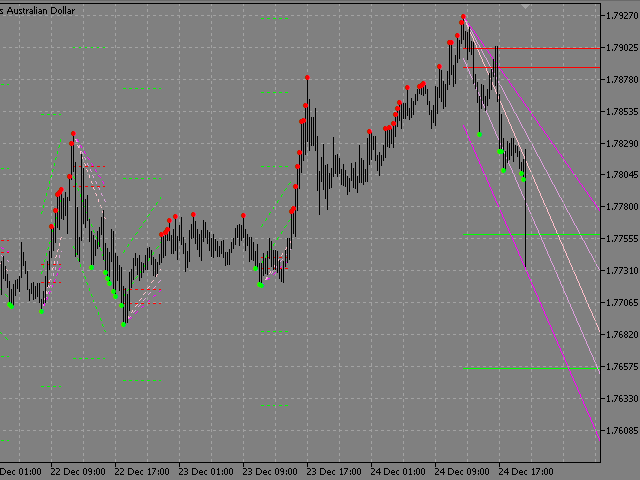
Der Indikator erstellt eine grafische Analyse, die auf der Fibonacci-Theorie basiert.
Der Fibo-Fächer wird für die Analyse der Impulse und Korrekturen der Bewegung verwendet.
Umkehrlinien (2 Linien an der Basis des Fibonacci-Fächers) werden verwendet, um die Richtung der Bewegungen zu analysieren.
Der Indikator zeigt die 4 Ziellinien in jeder Richtung an.
Der Indikator berücksichtigt die Marktvolatilität.
Wenn der Kurs über den Umkehrlinien liegt, ist es sinnvoll, einen Kauf in Betracht zu ziehen, wenn er darunter liegt, einen Verkauf.
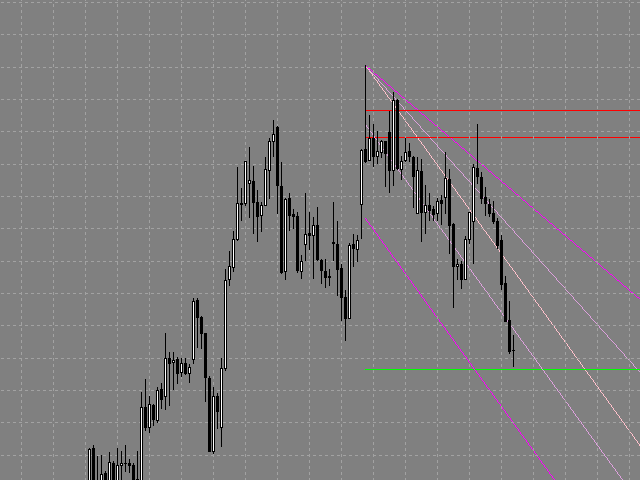
Sie können Positionen nach einem Ausbruch, einem Rebound oder einem Test auf der Rückseite einer Umkehr-, Ziel- oder Fächerlinie eröffnen.
Wenn sich die Marktsituation ändert, ändert der Fibo-Indikator seine Richtung.
Einstellungen:
- Show_History_Size - die Größe der angezeigten Historie.
- Fibo_Period - Anzahl der zu bildenden Kerzen.
- Fibo_Size_min - minimale Fibo-Fächergröße (in Kerzen).
- Show_Last_Fibo - Ausblenden/Anzeigen vergangener Fibo-Builds.
- Show_Extremum - Ausblenden/Einblenden des Extremums.
- Send_Sound - Tonalarm.
- Send_Mail - sendet eine E-Mail-Benachrichtigung.
- Send_Notification - sendet eine mobile Benachrichtigung.
- Send_Alert - Standard-Terminal-Benachrichtigung.
- Hier sind die wichtigsten Einstellungen. Sie können auch die folgenden Eigenschaften ändern: Farbe, Dicke, Stil.

Der Benutzer hat keinen Kommentar hinterlassen