Volatility Locator
- Indikatoren
-
Pavel Verveyko
 Writing scripts, indicators, EAs on MQL5 and MQL4.
Fast, Reliable, And High-Quality.
For all questions, please contact personal messages. - Version: 1.7
- Aktualisiert: 23 Januar 2023
- Aktivierungen: 5
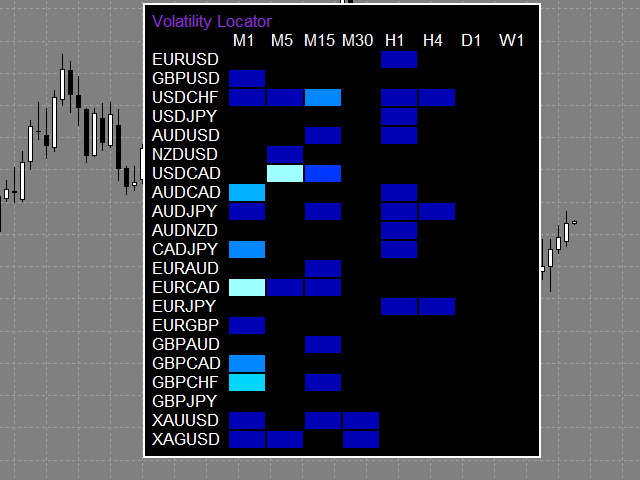
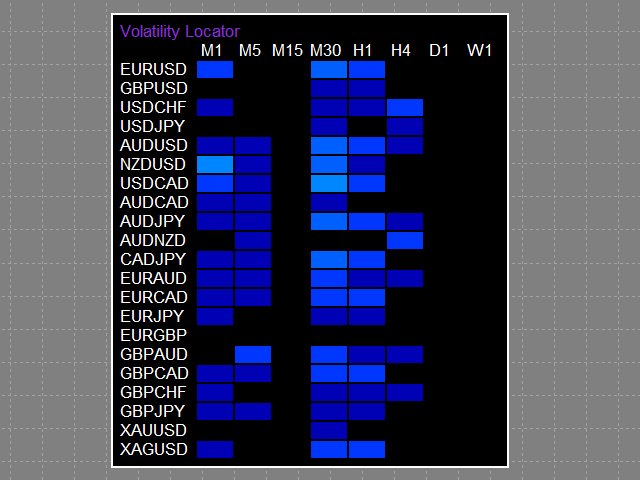
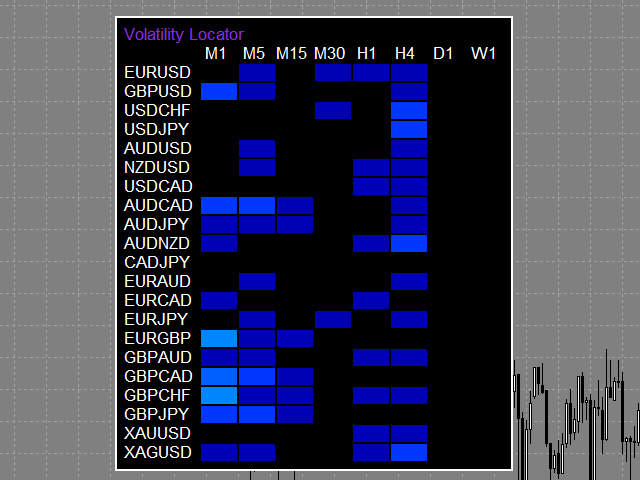
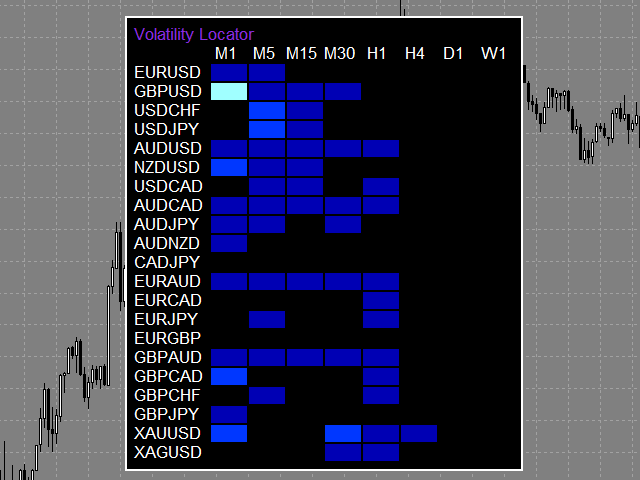
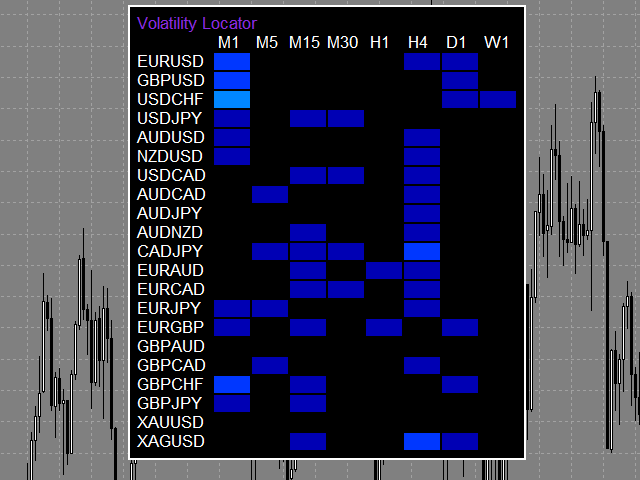
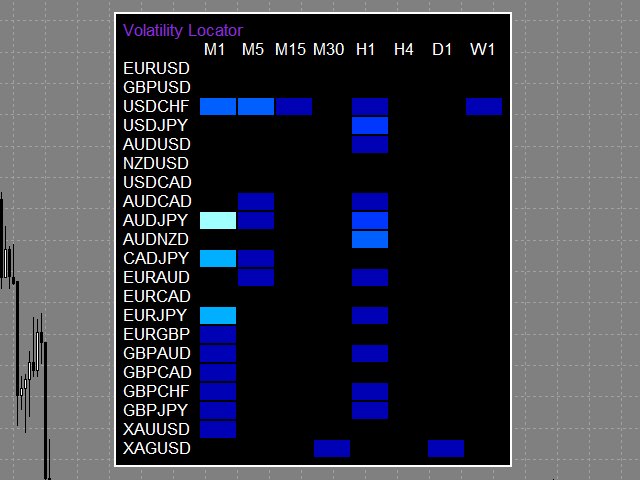
Der Indikator verfolgt die starke Volatilität (Momente, in denen der Markt eine erhöhte Aktivität aufweist und Bewegungen auftreten können) für die ausgewählten Instrumente und Zeiträume.
Die Informationen werden als farbige Rechtecke angezeigt. So lässt sich auf einen Blick erkennen, welches Instrument vorrangig behandelt werden sollte.
Der Indikator ist nützlich für Scalper, wenn sie eine schnelle Reaktion benötigen, oder für Händler, die mit einer großen Anzahl von Instrumenten arbeiten.
Der Indikator wird nicht neu gezeichnet.
Der Indikator zeigt 8 Volatilitätsgrade an.
Je stärker die Volatilität, desto heller ist das Signalrechteck in der Tabelle.
Die Tabelle kann mit der Maus gezogen werden.
Die Größe der Tabelle hängt von der in den Einstellungen gewählten Schriftgröße ab.
Wenn Sie den Mauszeiger über ein Rechteck bewegen, zeigt der Tooltip den Volatilitätsgrad sowie das Werkzeug und den Zeitraum an, dem dieses Rechteck entspricht.
Wenn Sie auf das ausgewählte Rechteck der Tabelle klicken, ändert sich das Werkzeug und/oder der Zeitraum oder es öffnet sich ein neues Chartfenster.
Wenn in der Einstellung Neues_Chart_oder_Aktuelles_Chart ausgewählt ist, werden der Zeitraum und das Werkzeug auf diejenigen geändert, die dem ausgewählten Rechteck entsprechen.
Wenn in der Einstellung Neues_Chart_oder_Aktuelles_Chart ausgewählt ist, wird ein neues Fenster mit einem Diagramm geöffnet, dessen Zeitraum und Werkzeug dem ausgewählten Rechteck entsprechen.
In der Einstellung Template_name_for_New_Chart können Sie eine Chartvorlage angeben, mit der ein neues Fenster geöffnet wird.
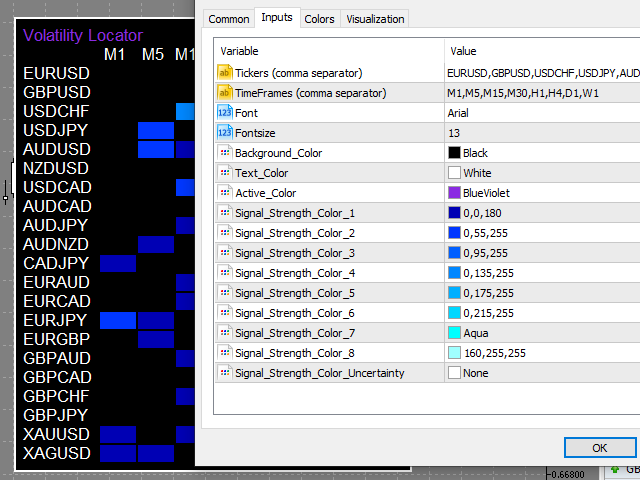
Einstellunge n
- Tickers - Werkzeuge, die in der Tabelle angezeigt werden sollen (durch Kommas getrennt).
- TimeFrames - Zeiträume , die in der Tabelle angezeigt werden sollen (durch Kommata getrennt).
- Table_Refresh_Rate (in Sekunden) - die Aktualisierungsrate der Tabelle wird in Sekunden gemessen.
- In anderen Indikatoreinstellungen können Sie die Farbe der Signalrechtecke, die Schriftart, die Schriftgröße, die Hintergrundfarbe der Tabelle und die Schriftfarbe der Tabelle ändern.
- Neuer_Chart_oder_aktueller_Chart - der Modus zum Öffnen eines neuen Charts: in einem neuen Fenster oder zum Ändern des Instruments und des Zeitraums in dem Fenster, in dem der Indikator läuft.
- Template_name_for_New_Chart - der Name des Templates, mit dem das neue Chart geöffnet wird.