Peaks and Troughs
- Indikatoren
-
Pavel Verveyko
 Writing scripts, indicators, EAs on MQL5 and MQL4.
Fast, Reliable, And High-Quality.
For all questions, please contact personal messages. - Version: 1.5
- Aktualisiert: 8 Dezember 2020
- Aktivierungen: 5
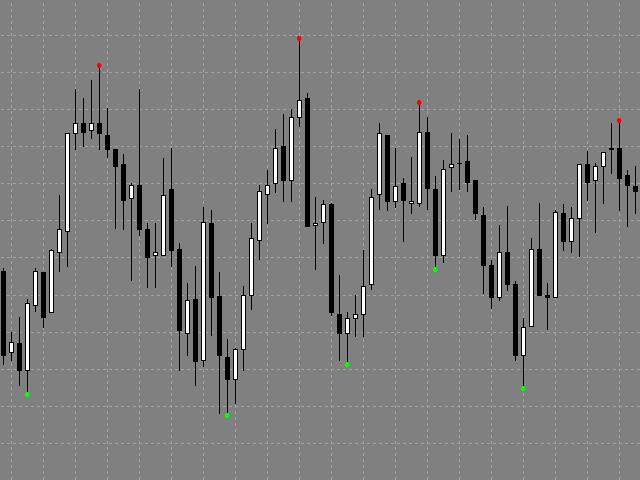
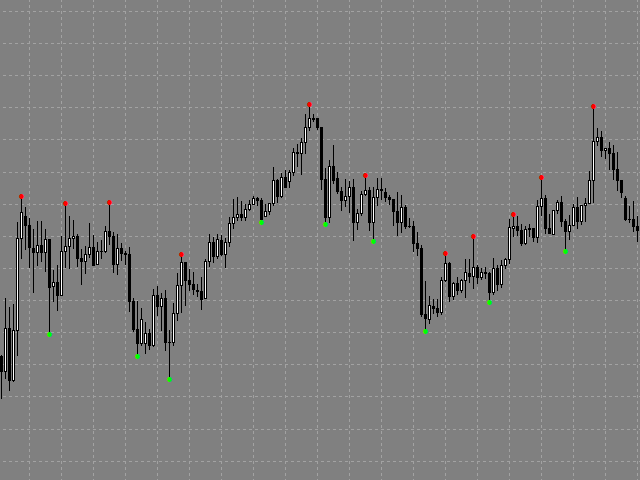
Der Indikator erkennt wichtige Höchst- und Tiefststände (Extreme) auf dem Chart.
Diese Punkte können zum Einzeichnen von Unterstützungs-/Widerstandsniveaus und Trendlinien sowie für jede andere grafische Analyse verwendet werden.
Diese Punkte können als Referenzpunkte für die Festlegung von Handelsaufträgen dienen.
Der Indikator wird nicht neu gezeichnet.
Einstellungen:
- Size_History - die Größe des berechneten Verlaufs.
- Num_Candles_Right - Anzahl der Kerzen rechts vom Hoch- oder Tiefpunkt.
- Num_Candles_Left - Anzahl der Kerzen links vom Hoch- oder Tiefpunkt.
- Type_Arrows_extremum - Beschriftungsstil.
- Send_Sound - Tonalarm .
- Send_Mail - sendet eine E-Mail-Benachrichtigung .
- Send_Notification - sendet eine mobile Benachrichtigung .
- Send_Alert - Standard-Terminal-Alarm.

Der Benutzer hat keinen Kommentar hinterlassen