Running along Lines MT5
- Indikatoren
-
Pavel Verveyko
 Writing scripts, indicators, EAs on MQL5 and MQL4.
Fast, Reliable, And High-Quality.
For all questions, please contact personal messages. - Version: 1.3
- Aktualisiert: 27 November 2020
- Aktivierungen: 5
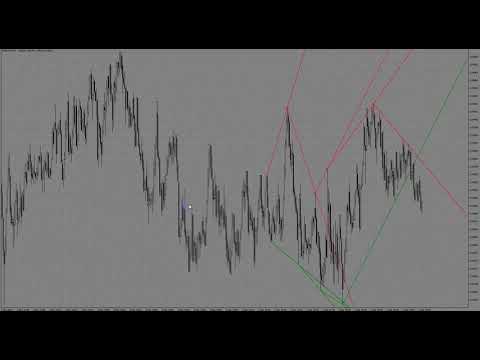
Der Indikator zeichnet Unterstützungs- und Widerstandslinien auf einem wichtigen Teil des Charts ein, um Entscheidungen zu treffen.
Nach dem Erscheinen der Trendlinie können Sie auf einen Ausbruch oder Abprall von ihr handeln und Aufträge in ihrer Nähe platzieren.
Überholte Trendlinien werden automatisch gelöscht. Wir handeln also immer mit den aktuellsten Linien.
Der Indikator wird nicht neu gezeichnet.
Einstellungen:
- Size_History - die Größe des berechneten Verlaufs.
- Num_Candles_extremum - die Anzahl der Kerzen auf jeder Seite des Extremums.
- Art_Pfeile_Extremum - Beschriftungsstil.
- Farbe_Linie_Hoch - Farbe der Widerstandslinien.
- Farbe_Linie_Tief - Farbe der Unterstützungslinien.
- Stil_Linie - Linienstil.
- Breite_Linie - Linienbreite.
- Send_Sound - Tonalarm.
- Send_Mail - sendet eine E-Mail-Benachrichtigung.
- Send_Notification - sendet eine mobile Benachrichtigung.
- Send_Alert - Standard-Terminal-Benachrichtigung.

Fantastic product that draws Trendlines as the market develops. Also like the dots that locate the supports and resistance. The developer also responds very fast any queries.