Key Levels of Support and Resistance
- Indikatoren
-
Pavel Verveyko
 Writing scripts, indicators, EAs on MQL5 and MQL4.
Fast, Reliable, And High-Quality.
For all questions, please contact personal messages. - Version: 1.2
- Aktualisiert: 24 Dezember 2020
- Aktivierungen: 5
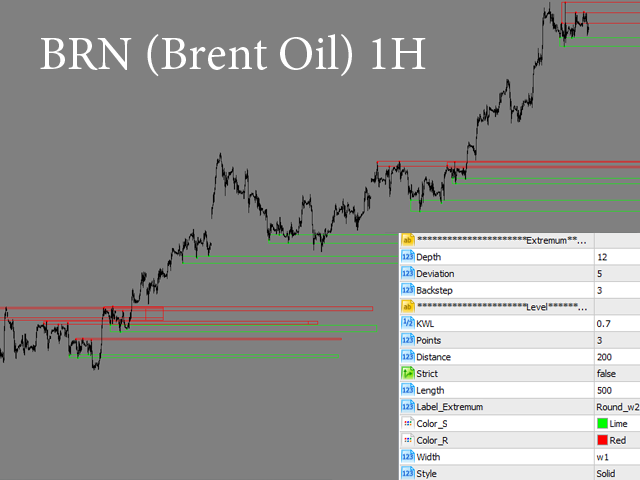
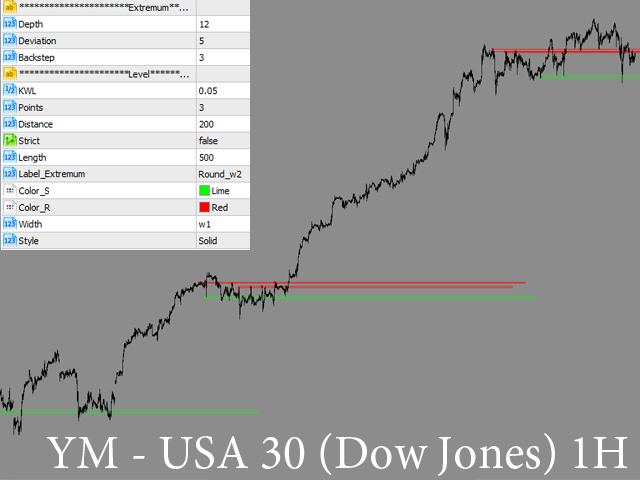
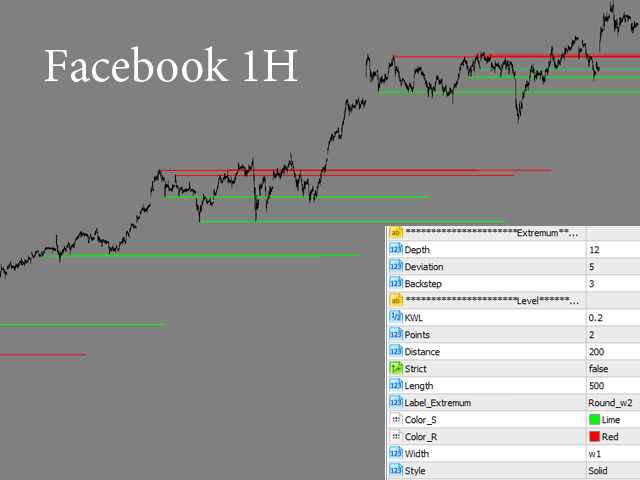
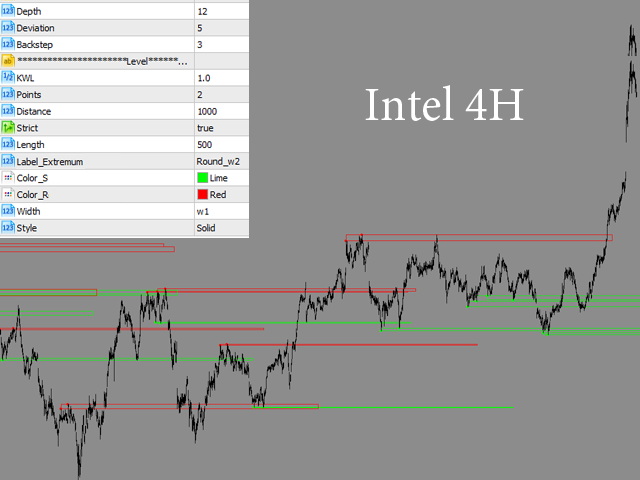
Der Indikator zeigt die wichtigsten Unterstützungs- und Widerstandsniveaus auf dem Chart an.
Die Bedeutung dieser Niveaus liegt darin, dass der Kurs beim Passieren dieser Niveaus die Bewegung umkehren oder verstärken kann, da sie sich als Folge der natürlichen Reaktion der Marktteilnehmer auf die Kursbewegung bilden, je nachdem, welche Positionen sie eingenommen haben oder keine Zeit hatten, sie einzunehmen.
Die Psychologie des Auftretens des Niveaus: Es gibt immer diejenigen, die gekauft, verkauft, gezögert haben, einzusteigen oder frühzeitig ausgestiegen sind.
Wenn der Kurs von einem Unterstützungsniveau abprallt und sich nach oben bewegt;
- Diejenigen, die gekauft haben, bedauern, dass sie nicht mehr gekauft haben, und denken daran, die Menge zu erhöhen, wenn der Preis wieder auf das Niveau steigt;
- Diejenigen, die verkauft haben, stellen fest, dass sie die Richtung verwechselt haben, und hoffen, dass der Preis wieder auf das Niveau zurückkehrt, so dass sie die Gewinnschwelle erreichen können;
- Diejenigen, die früh geschlossen haben, verstehen, dass der Kurs tatsächlich in "ihre" Richtung geht, und denken daran, ihre Positionen wieder zu eröffnen, wenn der Kurs auf das Niveau zurückkehrt;
- Diejenigen, die sich über die Richtung unsicher waren und mit dem Einstieg gezögert haben, sehen nun, wohin der Kurs geht, stellen aber fest, dass es zu spät ist und der Kurs bereits abgegangen ist; sie denken daran, Positionen zu eröffnen, wenn der Kurs wieder auf das Niveau zurückkehrt.
Das heißt, alle interessierten Teilnehmer planen, bei einem Rollback auf das Niveau zu kaufen.
Ein Rollback auf das Unterstützungsniveau kann eine neue Kaufwelle und eine Aufwärtsbewegung des Kurses auslösen.
Wenn der Kurs das Niveau nach unten durchbricht, wird sich die Meinung der Händler radikal ändern, und das Unterstützungsniveau wird zu einem Widerstandsniveau.
Ein Niveau ist eine unscharfe Linie, eine enge Preisspanne.
Die Bedeutung der Niveaus wird beeinflusst durch: die Dauer der Bildung des Niveaus, die Anzahl der Berührungen, die Höhe der Spanne, die Aktivität des Handels bei Annäherung an das Niveau. Die Niveaus, die der Kurs lange Zeit nicht berührt hat, verlieren allmählich ihre Bedeutung. Einige Niveaus beginnen nach einem Ausbruch oder wenn der Kurs sie lange nicht getestet hat, wieder zu funktionieren, während sie eigentlich schon längst vergessen sein sollten.
Bei der Arbeit mit den Niveaus werden die folgenden Signale verwendet:
- Abprall von einem Niveau,
- Ausbruch aus dem Niveau,
- Abprall von der gegenüberliegenden Seite eines Niveaus nach einem Ausbruch.
Der Indikator kann auf jedem Zeitrahmen, auf den Aktien-, Rohstoff- und Währungsmärkten verwendet werden.
Er kann für den langfristigen, mittelfristigen und kurzfristigen Handel verwendet werden.
Der Indikator wird nicht neu gezeichnet.
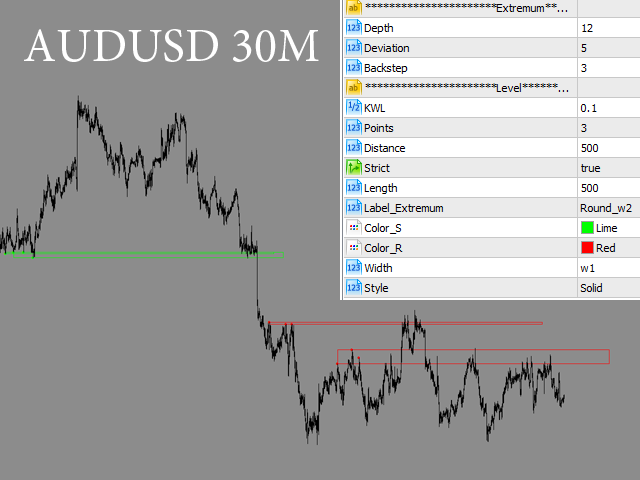
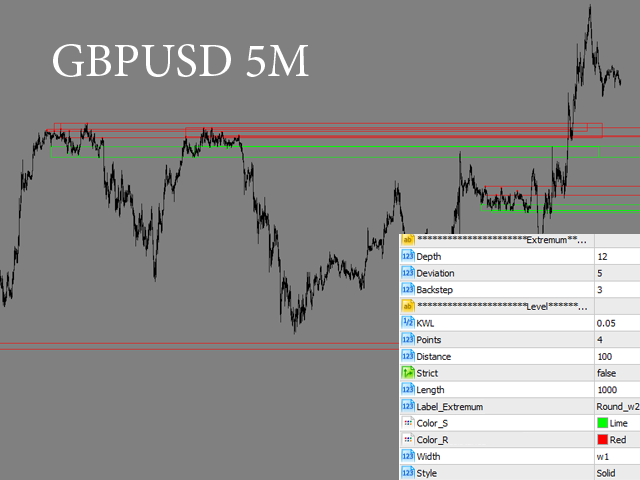
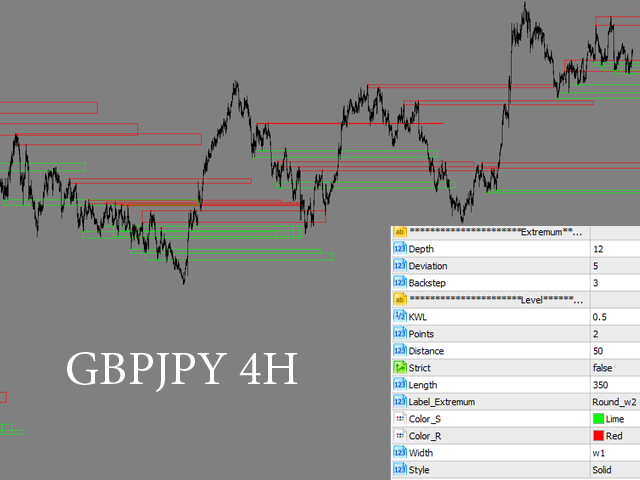
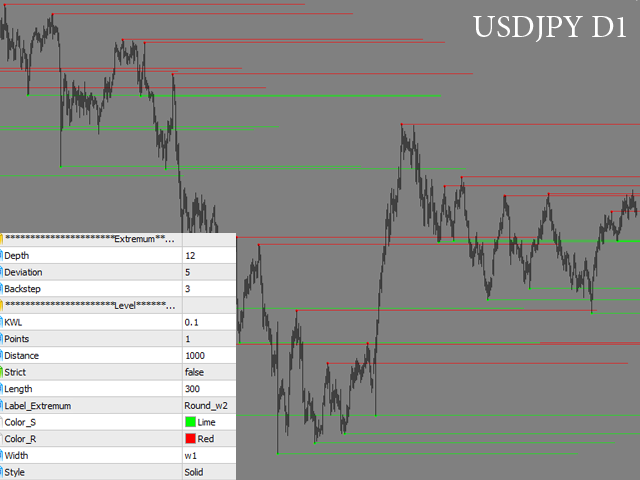
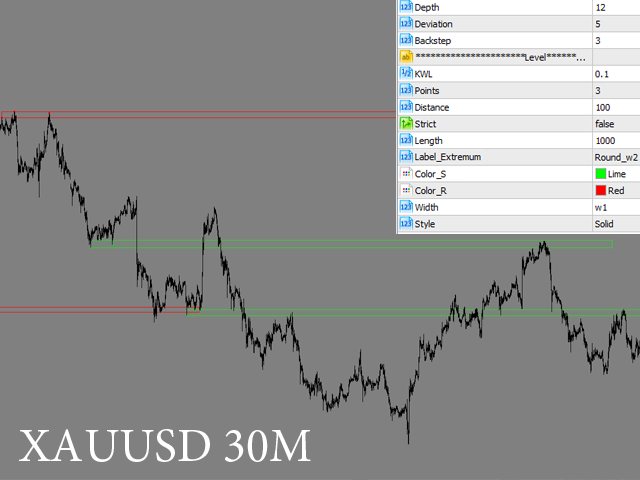
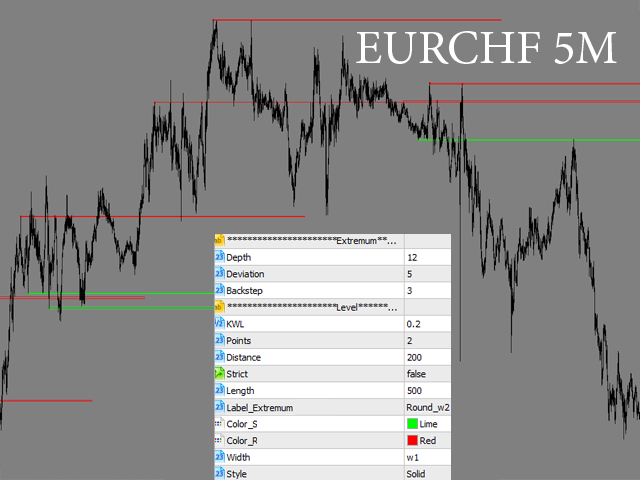
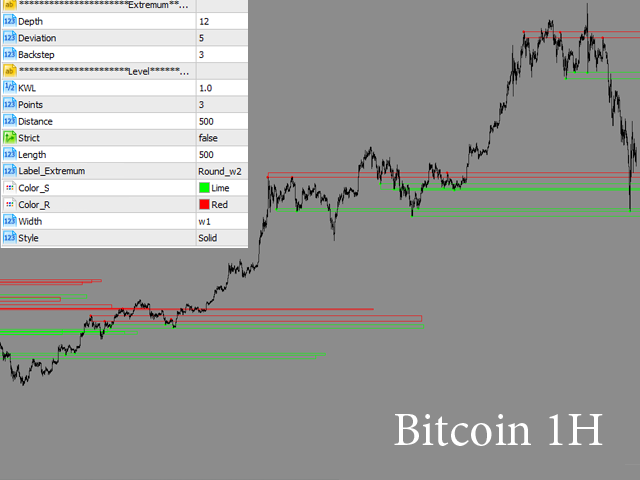
Einstellungen
- History_Size - Tiefe der berechneten Historie.
- Tiefe - die minimale Anzahl von Kerzen, bei denen kein zweites Hoch oder Tief gebildet werden kann, wenn der Parameter Abweichung erfüllt ist.
- Abweichung - die minimale Anzahl von Punkten, ausgedrückt als Prozentsatz zwischen den Hochs und Tiefs zweier benachbarter Kerzen (dieser Parameter ist für die Extremwerte verantwortlich, die für die Suche nach den Levels verwendet werden).
- Backstep - die minimale Anzahl von Kerzen zwischen den lokalen Hochs oder Tiefs (dieser Parameter ist für die Extremwerte verantwortlich, die für die Suche nach den Niveaus verwendet werden).
- KWL - (Hauptparameter) Verhältnis der Level-Breite (Prozentsatz, multipliziert mit zwei).
Dieser Wert ist für verschiedene Markttypen und Zeiträume unterschiedlich, da er von der Bandbreite der Kursschwankungen auf dem Chart abhängt.
Zum Beispiel kann dieser Wert bei Forex 0,001 auf dem Minutenchart und 0,1 auf dem Tageschart betragen.
Bei Aktien (z. B. Google) kann er 0,01 auf dem Minutenchart und 1,0 auf dem Tageschart betragen. - Punkte - (Hauptparameter) die Anzahl der Punkte (Extremwerte), die für die Darstellung eines Niveaus erforderlich sind.
- Abstand - (Hauptparameter) der maximale Abstand (ausgedrückt in der Anzahl der Kerzen) zwischen den Punkten (Extremen), die zur Darstellung eines Levels verwendet werden.
- Streng - (Hauptparameter) Strenger Ansatz für die Bildung von Niveaus (die Niveaus werden während der Bildung nicht vom Kurs durchbrochen).
- Länge - Verlängerung der Niveaus nach rechts um "x" Kerzen.
- Label_Extremum - Typ der Extremum-Labels und ihre Größe.
- Farbe_S - Farbe der Unterstützungsebenen.
- Farbe_R - Farbe der Widerstandsebenen.
- Breite - Dicke der Niveaulinien.
- Stil - Stil der Niveaulinien.
Der Benutzer hat keinen Kommentar hinterlassen