Fourteen plus nine TD Sequential
- Indikatoren
- Version: 1.0
- Aktivierungen: 20
Vierzehn plus neun
Wozu dient es?
Die Anwendung des TD Sequential von Tom DeMark dient dazu, einen Preispunkt zu identifizieren, an dem sich ein Aufwärts- oder Abwärtstrend erschöpft und umkehrt.
.
Was sind die Hauptbestandteile von TD Sequential?
TD Sequential besteht aus zwei Teilen - TD Setup und TD Countdown. Die erste Phase von TD Sequential beginnt mit einem TD Setup und wird mit einem 9-Count abgeschlossen. Wenn die 9er-Zählung abgeschlossen ist, ist an diesem Punkt eine Kurspause, ein Kursrückgang oder eine Umkehrung wahrscheinlich. An diesem Punkt beginnt auch die zweite Phase des TD Sequential mit einem TD Countdown, der mit einem 13er-Zähler abgeschlossen wird. Wenn der 13er-Zähler aufgezeichnet wird, ist eine Kurspause, ein Kursrückgang oder eine Umkehrung wahrscheinlich.
.
Nur 9 und 13. Ist es wirklich so einfach?
Ganz und gar nicht. Andere DeMark-Indikatoren und andere Indikatoren der technischen Analyse sollten sich an der Fähigkeit von TD Sequential orientieren, potenzielle Umkehrpunkte zu erkennen. Wenn zum Beispiel ein Frühindikator eine Bedingung für eine wahrscheinliche Marktumkehr in naher Zukunft identifiziert, ist es die Aufgabe von TD Sequential, das "Wann" für die Umkehr zu liefern, die wahrscheinlich stattfinden wird.
.
Was ist TD Buy Setup, TD Sell Setup, TD Buy Countdown und TD Sell Countdown?
TD Buy Setup ist der Name für ein TD Setup, wenn die DeMark Zählungen aufgezeichnet werden, während die Preise nach unten tendieren. Umgekehrt ist TD Sell Setup die Bezeichnung für ein TD Setup, wenn die DeMark-Zählungen aufgezeichnet werden, während die Kurse nach oben tendieren. Das Gleiche gilt für TD Countdowns. Ein TD Buy Countdown ist die Bezeichnung für einen TD Countdown, wenn die DeMark-Zählungen bei sinkenden Kursen erfasst werden, und ein TD Sell Countdown ist die Bezeichnung für einen TD Countdown, wenn die DeMark-Zählungen bei steigenden Kursen erfasst werden.
.
Sind die Regeln von TD Sequential flexibel?
Ja. Es gibt viele Varianten und es kann mit Modifikationen und Filtern experimentiert werden.
.
Nachfolgend finden Sie vier visuelle Beispiele, die die Komponenten von TD Sequential beschreiben.
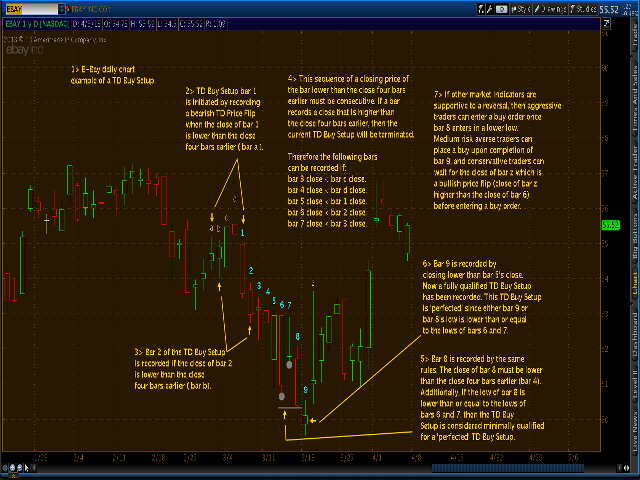
TD Buy Setup für Ebay (EBAY )
TD Buy Countdown für Zynga (ZNGA )
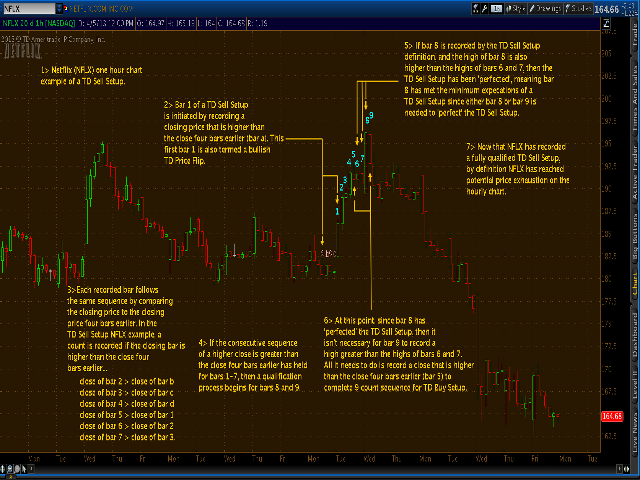
TD Sell Setup für Netflix (NFLX )
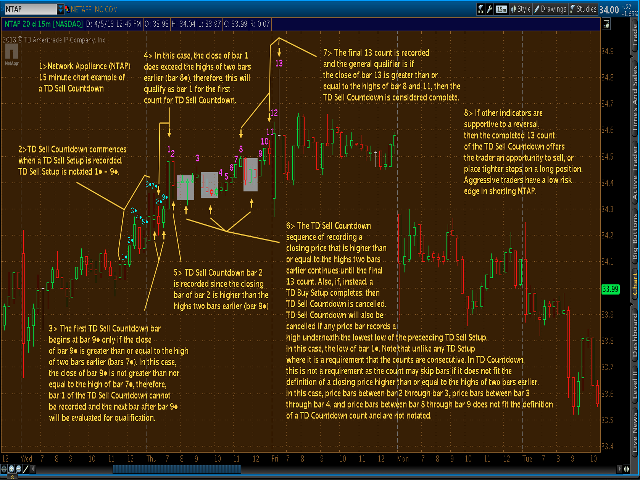
TD Sell Countdown für Network Appliance (NTAP )
Die schriftlichen Erläuterungen zu den einzelnen Beispielen sind der Reihe nach nummeriert.