B Bands
- Indikatoren
- Version: 1.0
- Aktivierungen: 5

Die Bollinger-Bänder gehören zu den am häufigsten verwendeten Indikatoren in der technischen Analyse. Ihr Autor ist der Amerikaner John Bollinger, ein Finanzanalyst, der einen wichtigen Beitrag zu diesem Bereich geleistet hat. John Bollinger begann in den 1980er Jahren mit der Entwicklung dieser Technik und veröffentlichte im Jahr 2001 sein Buch Bollinger on Bollinger Bands.
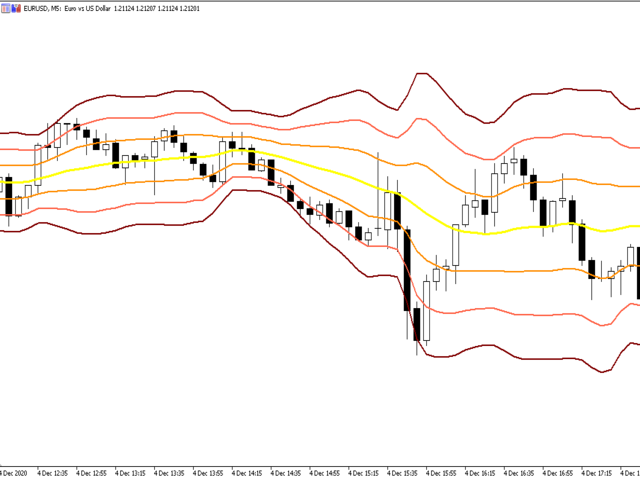
Bollinger-Bänder sind sehr nützlich, um Kursniveaus anzuzeigen, bei denen eine Aktie möglicherweise zu stark gestiegen oder gefallen ist, und um Anzeichen für Höchst- und Tiefststände zu erkennen. Der Indikator wird aus der zweiten Standardabweichung unter Hinzunahme von gleitenden Durchschnitten berechnet und zeigt, dass der Kurs unabhängig von jeder Bewegung dazu neigt, zu einem Gleichgewicht zurückzukehren.
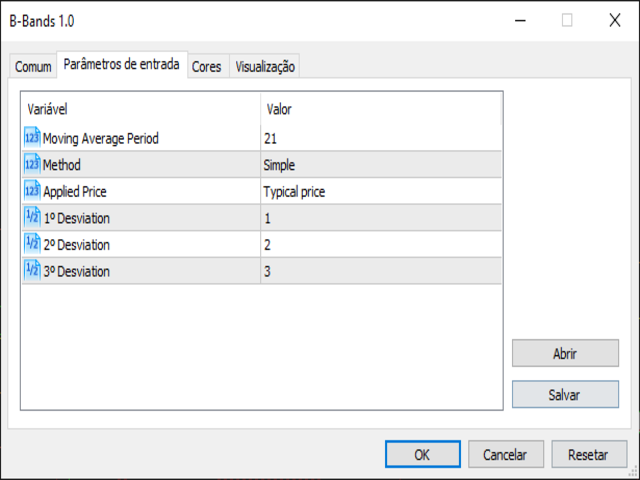
So entstand B3 Bands als eine Lösung, um die Verwendung von Statistiken in der Strategie zu verbessern, da bis zu 3 Standardabweichungen gleichzeitig addiert werden können, anstatt nur eine. B3 Bands bietet dem Analysten die Möglichkeit, die zusätzlichen Standardabweichungen zu nutzen, um falsche Hochs und Tiefs zu identifizieren, einen mathematischen Stoploss vorzubereiten und einen besseren statistischen Überblick über den Trader zu erhalten.
Platzieren Sie einfach Ihre bevorzugten Bollinger-Band-Einstellungen in B3 Bands, konfigurieren Sie die Standardabweichungen, die Sie analysieren möchten, und beginnen Sie einfach mit dem Handel.
Die Statistiken von B3 Bands sind immer zu Ihren Gunsten.