Super XT
- Indicadores
- Versión: 1.0
- Activaciones: 5

Este indicador Super XT indicator.Indicator muestra la tendencia movement.Indicator calcula automáticamente line.
Características
- FiltPer - muestra el período del indicador.
- Ventana - muestra la tendencia del indicador (verdadero/falso).
- Tendencia - muestra la tendencia del indicador (verdadero/falso).
- X - mueve la tendencia a izquierda y derecha.
- Y - mueve la tendencia arriba y abajo.
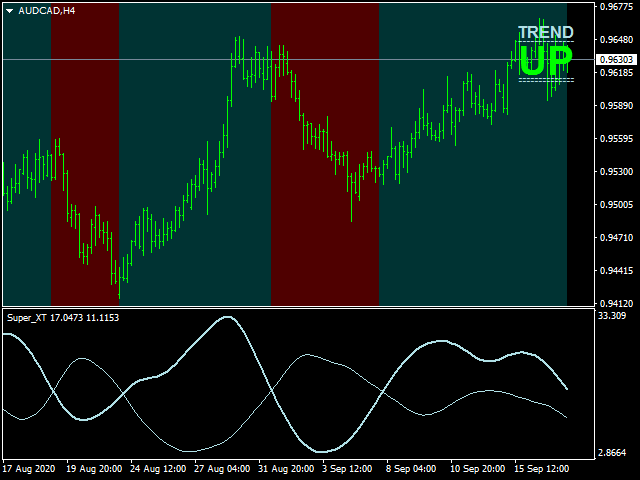
Cómo entender el estado:
- Si el color de la tendencia es verde, la tendencia es alcista.
- Si el color de la tendencia es rojo, la tendencia es a la baja.
////////////////////////////////////////////////////////////////////////////////////////////////////////////////////////////////////////////////////////////////////////////////////////////////////////////////////////////////////////////////////////////////////////////////////////////////////////////
//////////////////////////////////////////////////////////////////////////////////////////////////////////////////////////////////////////////////////
/////////////////////////////////////////////////////////////////////////////////////////////////////////////////////////////////////////////////////
/////////////////////////////////////////////////////////////////////////////////////////////////////////////////////////////////////////////////////
///////////////////////////////////////////////////////////////////////////////////////////////////////////////////////////////////////////////////// /////////////////////////////////////////////////////////////////////////////////////////////////////////////////////////