Pan PrizMA CD Phase
- Indikatoren
- Version: 1.4
- Aktualisiert: 3 April 2020
- Aktivierungen: 20

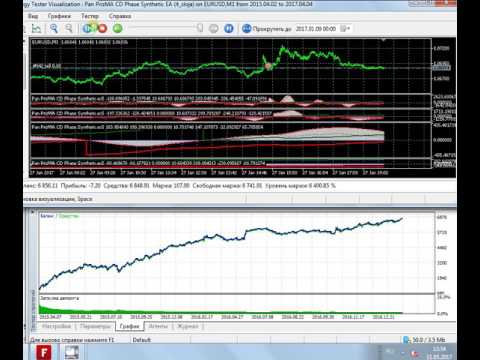
Der Expert Advisor und das Video sind auf der Registerkarte "Diskussion" zu sehen. Der Roboter wendet nur einen Auftrag an und folgt strikt den Signalen, um die Effizienz des Indikators zu bewerten. Pan PrizMA CD Phase ist eine Option, die auf dem Indikator Pan PrizMA basiert. Einzelheiten (auf Russisch).
- Die Mittelwertbildung durch ein quadratisch-quartisches Polynom erhöht die Glätte der Linien, verleiht Schwung und Rhythmus.
- Die Extrapolation durch die Sinusfunktion in der Nähe einer Konstante ermöglicht die Einstellung der Verzögerung oder des Vorlaufs von Signalen.
- Der Wert des Parameters Phase - Wellenstatus (der in seiner Bedeutung der trigonometrischen Phase oder dem Winkel der Radius-Vektor-Drehung in der trigonometrischen Ebene nahe kommt) ermöglicht es, jeden Linienpunkt zu digitalisieren und jeden erforderlichen Punkt als Handelssignal im EA zu verwenden. Dies wiederum beschleunigt die Optimierung von Strategien.
- Die Digitalisierung ermöglicht es Ihnen, asymmetrische Erlaubnis-/Verbotsintervalle während der Filterung festzulegen. Zum Beispiel kann das Intervall, das den Handel gegen einen Trend verbietet, 90 Grad ab einer beliebigen Phase umfassen, nur ein Viertel der gesamten Wellenperiode.
- Die Verwendung synthetischer Balken nach Volumen, Preis oder deren Kombination ermöglicht die Anpassung der Chart-Skala für die Strategie.
Externe Variablen
- Line_1_power - Grad des Polynoms, das den Durchschnitt der ersten Linie bildet (2-4).
- Fast_line_1_leverage - Leverage (ein Analogon der Periode) einer kurzen Durchschnittslinie, die durch ein Polynom geglättet wurde.
- Fast_line_2_leverage - Hebelwirkung einer kurzen Linie, die durch eine Sinuskurve in der Nähe einer Konstante extrapoliert wird.
- Base - die Hälfte der SMA-Periode, die vom Preis abgezogen wird. Analog zu einem Slow_SMA. Der Wert von 0 schließt die Subtraktion vom Kurs aus.
- Synthetischer_Kanal - Wert des synthetischen Balkens, definiert als die Summe der Preispunkte und der Betrag von zehn Millionsteln des aktuellen Volumens. Der Wert 0 schaltet synthetische Balken aus.
- Gewicht_Preise - Preismultiplikator. Er ermöglicht die Änderung der Gewichtung der Preiswerte in der Summe. Der Parameter kann negativ sein.
- Gewicht_Volumen - Multiplikator für die Volumenanteile. Er ermöglicht die Änderung der Gewichtung des Volumenwertes in der Summe. Der Parameter kann auch negativ sein.
- Multiplikator - Histogramm-Multiplikator.
- Multiplikator_2 - Preis-Multiplikator. -1 tauscht die obere und untere Linie aus.
- Signal SMA Periode - Periode der Signallinie.
Indikator-Linien
- "MACD_A0" - Histogramm. Wird als die erste Differenz auf der extrapolierten Linie gezeichnet. Wird aus dem Feld 0 gelesen.
- "Signal_A1" - Histogramm Signallinie. Abgelesen aus dem Array 1.
- "Fast_line_1" - durch das Polynom gemittelte Linie. Wird aus dem Array 2 gelesen.
- "Fast_line_2" - extrapolierte Linie. Aus dem Array ablesen 3.
- "Phase_A4" - Phasenlinie. Wird aus dem Array gelesen 4.
-
"-_Phase_A5" - verschobene Phasenlinie, die unter 0 gezeichnet wird und die Visualisierung der ersten Linie auf den Biegungen ermöglicht. Ablesen aus dem Array 5.
-
"+-2_Phase_A6" - gepunktete Linie, die von der MathArccos-Funktion bereitgestellt wird, die von Bogenmaß in Grad umgewandelt und mit 2 multipliziert wird, um Übereinstimmungen mit den Phasenlinien auszuschließen. Abgelesen aus dem Array 6.
Hinweis: Der EA veranschaulicht nur die Anwendung des Indikators und ermöglicht es Ihnen, die Effizienz seiner Signale zu bewerten. Passen Sie den Roboter an Ihre eigene Strategie und Sicherheitsspanne an, bevor Sie ihn im realen Handel einsetzen.