Di Napoli Thrust Scanner MT5
- 指标
- 版本: 1.1
- 更新: 13 五月 2023
- 激活: 15

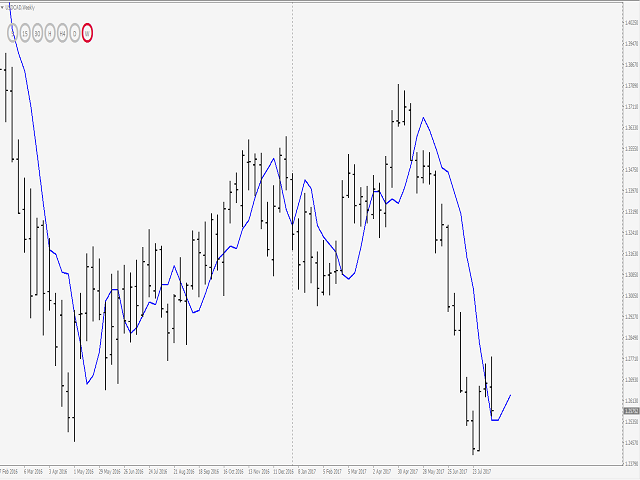
The indicator scans for Dinapoli thrust pattern in multiple timeframes for a specific market.
Key Features
- Indicator can be used for all markets
- It can scan for thrust pattern on W1, D1, H4, H1, M30, M15 and M5 timeframes
- Ability to choose number of bars required above/below displaced moving average to define thrust
- Able to move display label on chart by single click
Parameters
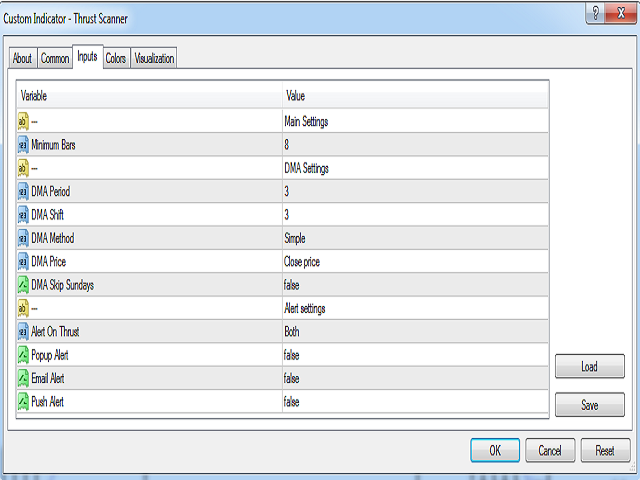
- Minimum Bars: Least amount of bars to account for Thrust
- DMA Period: Moving average period
- DMA Shift: Number or bars requested to shift moving average
- DMA Method: Moving average method
- Bars Variable : Able to count only up or down bars
- Bars Condition: Variable to count only not touching bars over DMA line
- Trend Push : Variable to count consecutive bars with higher lows or lower highs.
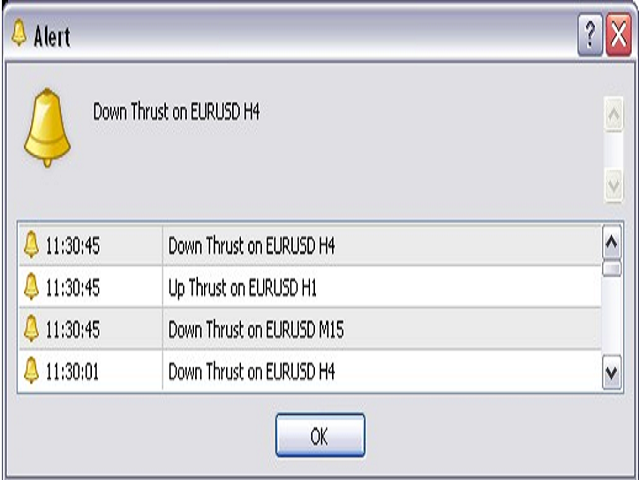
- Alert On Thrust: Specify the direction of thrust to receive an alert about. Default is Both
- Popup Alert: Set True to enable window popup and sound alert on the terminal when a fresh thrust is generated. Set False to disable
- Email Alert: Set True to receive email notifications when a fresh thrust is generated. Set False to disable.
- Push Alert: Set True to receive push notifications on your Apple or Android devices when a fresh thrust is generated. Set False to disable
Indicator Usage
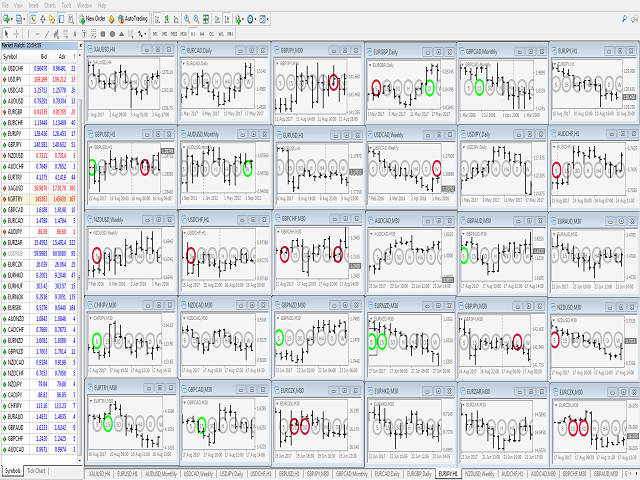
The dashboard appears to the left and upper part of the chart when attached. The shell encapsulating a timeframe goes red on a down thrust, green on an up thrust and resets to grey when there is no signal.
If the default location of the dashboard is inconvenient, it can be moved to a convenient location on the chart. This can be done by selecting (double click or single click depending on how objects are selected on the user’s terminal) the first shell encapsulating the 5 and dragging it to the preferred location. Drop it, and the others will follow suit.
Thrust Scanner will store your preferred location when you remove the indicator from chart. Next time you attach the Thrust Scanner indicator to the chart, the dashboard will appear in the saved preferred location. Kindly relax and enjoy your indicator!
For MT4 version; please visit => https://www.mql5.com/en/market/product/52830/
For Thrust Scanner Dashboard; please visit => https://www.mql5.com/en/market/product/52833


用户没有留下任何评级信息