• Übersicht
  • Bewertungen (6)
  • Diskussion (8)
  • Neue Funktionen

Chart patterns scanner MT5

5

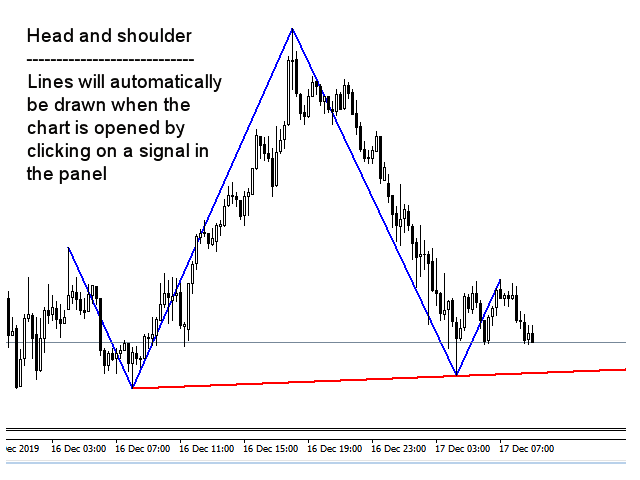
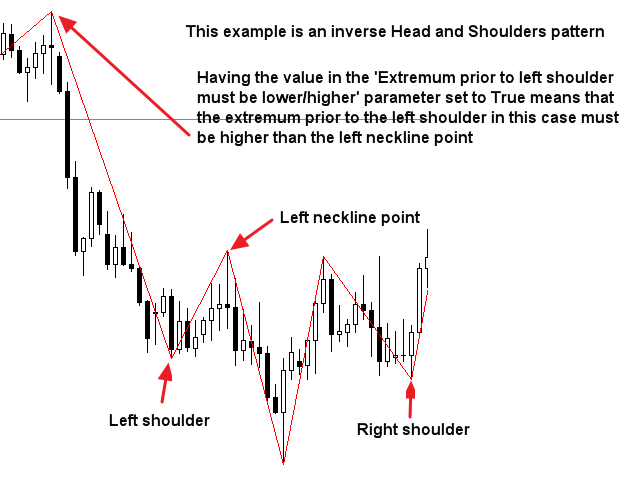
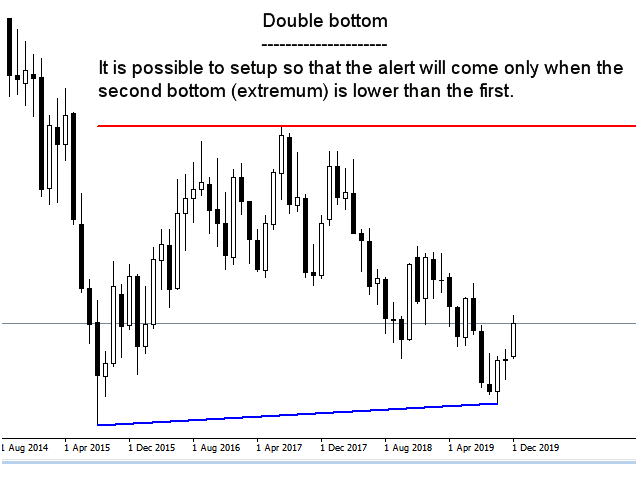
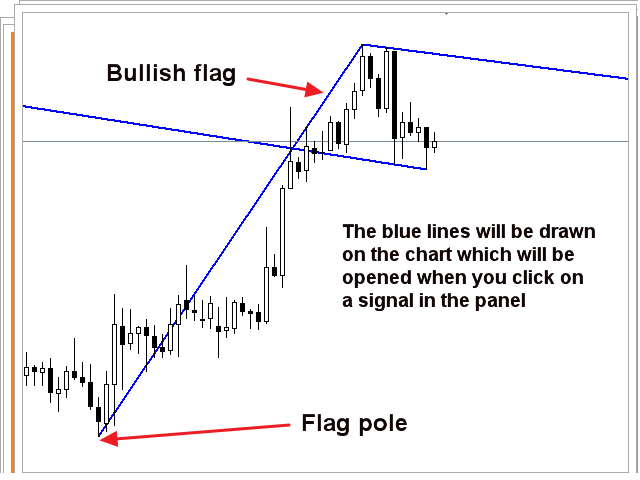
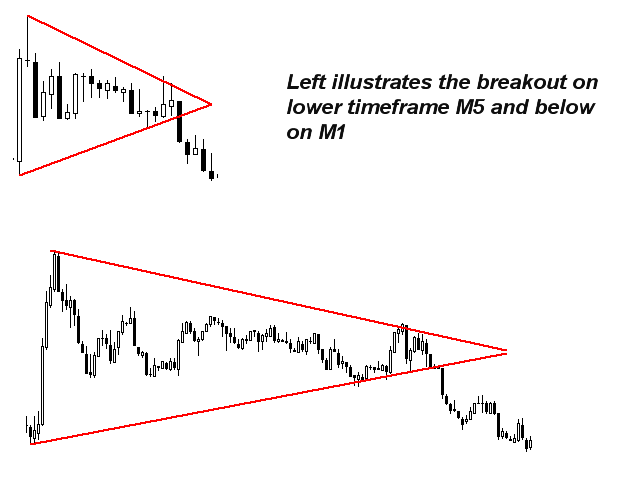
Dieser Indikator mit mehreren Zeitrahmen und mehreren Symbolen identifiziert doppelte Top/Boden-, Kopf- und Schulter-, Wimpel-/Dreiecks- und Flaggenmuster. Es ist auch möglich, Alarme nur dann einzurichten, wenn ein Nackenlinien-/Dreiecks-/Fahnenmast-Ausbruch aufgetreten ist (Nackenlinien-Ausbruch = bestätigtes Signal für Top/Bottoms und Head & Shoulders).   Der Indikator kann auch im Single-Chart-Modus verwendet werden. Bitte lesen Sie mehr über diese Option in den Produktinformationen   bloggen . In Kombination mit Ihren eigenen Regeln und Techniken ermöglicht Ihnen dieser Indikator, Ihr eigenes leistungsstarkes System zu erstellen (oder zu verbessern).

Merkmale

  • Kann alle in Ihrem Marktübersichtsfenster sichtbaren Symbole gleichzeitig überwachen. Wenden Sie den Indikator auf nur einen Chart an und überwachen Sie sofort den gesamten Markt.
  • Kann jeden Zeitrahmen von M1 bis MN überwachen und sendet Ihnen eine Echtzeitwarnung, wenn das Muster identifiziert wurde oder ein Ausbruch eintritt. Alle nativen Metatrader-Alarmtypen werden unterstützt.
  • Kann den RSI als Trendfilter verwenden, um potenzielle Umkehrungen richtig zu identifizieren.
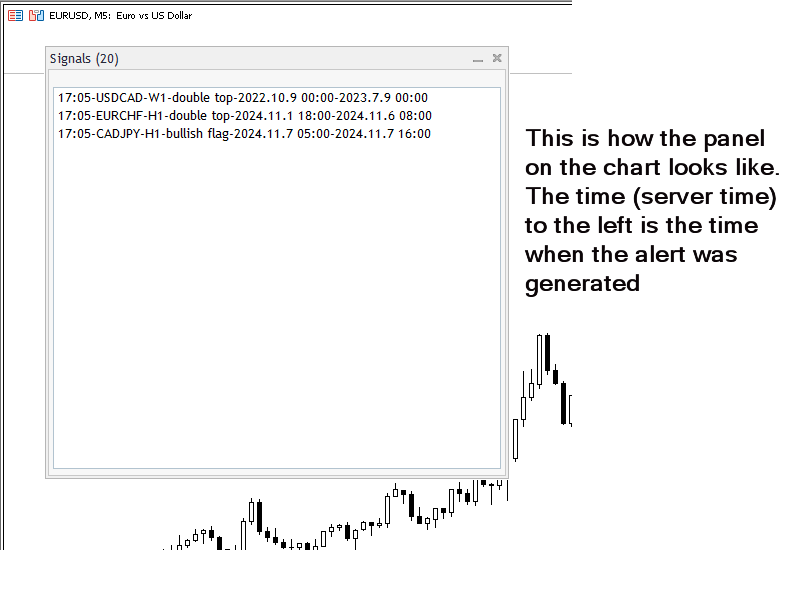
  • Der Indikator enthält ein interaktives Panel. Wenn Sie auf ein Element klicken, wird ein neuer Chart mit dem betreffenden Symbol und Zeitrahmen geöffnet.
  • Der Indikator schreibt die Signale in eine Textdatei, die von einem Expert Advisor (EA) für den automatischen Handel verwendet werden kann. Zum Beispiel dieses Produkt . Weitere Informationen zu Inhalt und Speicherort der Textdatei finden Sie im Blog .

Eingabeparameter

Die Beschreibung und Erläuterung der Eingabeparameter finden Sie hier .

Wichtig

Bitte beachten Sie, dass aufgrund der Multifunktionalität weder Kauf- und Verkaufsempfehlungen noch Linien und Pfeile auf dem Chart gezeichnet werden, auf dem der Indikator installiert ist. Linien, die das Muster zeigen, werden auf dem Diagramm gezeichnet, das durch Klicken auf ein Signal im Bedienfeld geöffnet wird.

Es wird dringend empfohlen, den Indikator auf ein sauberes (leeres) Diagramm ohne andere Indikatoren oder Expert Advisors zu setzen, die den Scanner stören könnten.


Bewertungen 6
Maria Angelova
247
Maria Angelova 2024.02.03 08:31 
 

I've been using it for a week now. A unique indicator. Really extremely useful indicator for beginners.Thanks to the creator for creating it

Andreas Ullrich
34
Andreas Ullrich 2023.11.13 17:34 
 

This is a very useful indicator. It works properly. Well done!

tunck
1164
tunck 2023.07.06 14:01 
 

Very good tool and great support!

Empfohlene Produkte
I  recommend you to read the   product's blog  (manual) from start to end so that it is clear from the beginning what the indicator offers. This multi time frame and multi symbol indicator scans for engulfing and tweezer formations.  The indicator can also be used in single chart mode. Combined with your own rules and techniques, this indicator will allow you to create (or enhance) your own powerful system. Features Can monitor all symbols visible in your Market Watch window at the same time. A
My Point MT5
Claudia Ramona Angerer
Diagnosis of major and minor pivot Trend detection with many signals Can be used in all symbols Can be used in all time frames Settings: Back Show: The number of candles it displays If you need any adjustments, or have any questions or suggestions, message me How to trade: Blue: sell signal Red: buy signal Blue and red at the same time: no signal Exit signal: Opposite signal
I recommend you to read the   product's blog  (manual) from start to end so that it is clear from the beginning what the indicactor offers. This multi time frame and multi symbol indicator identifies double or triple top/bottom formations or a following neckline breakout (confirmed top/bottom). It offers RSI, pin bar, engulfing, tweezer, morning/evening star filters as well divergence filter options which makes it possible to filter out only the strongest setups. The indicator can also be used
I recommend you to read the  product's blog  (manual) from start to end so that it is clear from the beginning what the indicator offers. This multi time frame and multi symbol supply and demand zone dashboard indicator sends alerts when the price has reached a supply/demand zone. It is also possible to use it to be alerted about regular double tops/bottoms instead of zones. It can be used with all time frames from M1 to MN. Maximum 9 time frames can be shown in the dashboard at the same time. 
Dieser Multisymbol- und Multi-Timeframe-Indikator kann nicht nur bullische und bärische Dreilinien-Strike-Formationen finden, sondern auch nach den folgenden Candlestick-Mustern suchen (siehe Screenshots zur Erklärung der Muster): Drei weiße Soldaten (Umkehrung>Fortsetzungsmuster) Drei schwarze Krähen (Umkehrung> Fortsetzungsmuster) Die Formationen erscheinen nicht sehr oft auf höheren Zeitrahmen, wenn die strikte Option in den Indikatoreinstellungen aktiviert ist. Aber wenn sie es tun, ist es e
Contact me for instruction, any questions! Introduction A flag can be used as an entry pattern for the continuation of an established trend. The formation usually occurs after a strong trending move. The pattern usually forms at the midpoint of a full swing and shows the start of moving. Bullish flags can form after an uptrend, bearish flags can form after a downtrend. Flag Pattern Scanner Indicator It is usually difficult for a trader to recognize classic patterns on a chart, as well as sear
ZigZagAllinOne
Alberto Da Silva Lira
Indicator focusing on the market's ZigZag, also adding 2 other already established indicators: Book of Offers and Balance Aggressor (Time & Trades), this indicator allows to detect the best price trigger (buy or sell) in the aggressions to the Book of Offers including filters important as Aggression in Candle. Recommended use on the Brazilian iBovespa B3, but it also serves in Forex as long as the assets have information from the Book, in the case of Forex it is not possible to use the Aggres
Entdecken Sie den RSIScalperPro - den revolutionären RSI-basierten Indikator für den Metatrader 5, der speziell für das Scalptrading im einminütigen Chart entwickelt wurde. Mit RSIScalperPro erhalten Sie einen leistungsstarken Werkzeugkasten für den präzisen Einstieg und Ausstieg aus Trades, um Ihr Trading auf die nächste Stufe zu bringen. RSIScalperPro verwendet zwei verschiedene RSI-Indikatoren, die Ihnen klare Signale für überkaufte und überverkaufte Bereiche liefern. Sie können die Zeitperi
Whether you're an analyst looking for a Fibonacci charting platform for Fibonacci Ratio analysis, or a trader looking for an advanced Fibonacci trading tool, Ultimate Fibonacci  has what you need. Ultimate Fibonacci   has the most advanced and full-featured Fibonacci charting and trading software on the market. GIVE ME A GOOD RATING! Ultimate Fibonacci  measures and calculates Fibonacci projections and Retracement levels for you, as well as Price projections (like Wave 2 vs. 1 or Wave 4 vs. 2
FREE
The Breakout Box for MT5 is a (opening) range breakout Indicator with freely adjustable: - time ranges - end of drawing time - take profit levels by percent of the range size - colors - font sizes It can  not only display the range of the current day, but also for any number of days past. It can be used for any instrument. It displays the range size and by request the range levels and the levels of the take profit niveaus too. By request it shows a countdown with time to finish range.  The indic
Volatility Vision: Best Solution for any Newbie or Expert Trader! User manual:   Click The "Volatility Vision"   s how levels on the chart,   may be used to enter and exit positions, and it's a useful indicator to add  it in trading system. Indicator works on all currency pairs and stocks. This is a great advantage and new in trading. Intra-weekly traders can use the "volatility limits" information to comfortably open and close orders. Advantages over standard indicators Removes false e
SR levels true
Egidijus Bikulcius
Indicator SR levels true in small time frames is very useful for scalping while in bigger ones it is good for day or position trading. SR levels true can draw 4 support/resistance levels based on defined maximum rebouds from price level. Indicator scans  defined number of bars in time axis and defined number of pips in price axis (both sides - up and down) and calculates how much times price was rejected from scanned price levels. At the price levels where maximum rebounds are counted, support
Der Indikator hilft, gleichzeitig nach einer gewissen Korrektur in einen Trade einzutreten, der dem Trend folgt. Es findet starke Trendbewegungen eines Währungspaares auf einer bestimmten Anzahl von Balken und findet auch Korrekturniveaus für diesen Trend. Wenn der Trend stark genug ist und die Korrektur der in den Parametern angegebenen entspricht, signalisiert der Indikator dies. Sie können unterschiedliche Korrekturwerte einstellen, besser geeignet sind die Werte von 38, 50 und 62 (Fibonacci
TREND HARMONY MT5 – Multi Timeframe Trend and Phase and Pullback Level Visualizer indicator for Metatrader5 The TREND HARMONY indicator automates deep trend analysis and generates visualizations for you. Take control of your trades by eliminating uncertainty! Revolutionize your trading experience with precision and insight through the TREND HARMONY Multi Timeframe indicator – your ultimate MT5 trend visualization indicator. [  Features and Manual   | MT4 version |   All Products   ] Are you t
Dieser Indikator verfolgt effizient alle anderen Zeitrahmenkerzen, die Sie auf demselben Diagramm verfolgen möchten 1. Wählen Sie einen beliebigen höheren Zeitrahmen aus, um Balken im selben Diagramm zu laden 2. Passen Sie die Farben und den Stil der Kerzenständer an 3. Wählen Sie die Anzahl der Balken, um Kerzenhalter zu zeichnen 4. Verfolgen Sie vollständige Kerzen mit höherem Zeitrahmen zusammen mit Docht und Körper 5. Einfach und bequem für diejenigen, die nicht das Diagramm w
KT Tether Line MT5
KEENBASE SOFTWARE SOLUTIONS
The KT Tether Line is a trend-following tool consisting of three indicators that work together to generate trading signals. It can correctly identify market trends while signaling trade entries. It was first introduced by Bryan Strain in the Stock & Commodities magazine in 2000 in "How to get with the trend and out at the end." The Concept When a market trend is confirmed, the most challenging part is determining the timing of the entries. This indicator alerts you to potential trend reversal
Ali Levels Pro is an indicator designed to identify and draw levels of interest including: Opening Range High/Low with seconds precision,  Previous Session High/Low (if you are a Intraday trader who trades Indices or Commodities maybe you want to know yesterday New York Session high and low),  Overnight Session High/Low,  Previous Day High/Low,  Previous Week High/Low, and  Previous Month High/Low. Traders use this levels as support and resistance levels.  By searching for confluences between
TilsonT3
Jonathan Pereira
Tillson's T3 moving average was introduced to the world of technical analysis in the article ''A Better Moving Average'', published in the American magazine Technical Analysis of Stock Commodities. Developed by Tim Tillson, analysts and traders of futures markets soon became fascinated with this technique that smoothes the price series while decreasing the lag (lag) typical of trend-following systems.
FREE
MACDmaxmin
Carlos Andrés Moya Erazo
3 (2)
The indicator shows when there are overpricing and divergences over a normalized MACD Plus, it displays signals with configurable alerts, self-regulating dynamic overprice levels, and a simple setup and interface. The indicator that automatically calculates overprices ranges! MACDmaxmin is an indicator based on the MACD oscillator that effectively identifies trend changes in price, as it is a momentum indicator that captures the trend and shows the relationship between two moving averages of th
INDIKATOR basierend auf KÜNSTLICHER INTELLIGENZ, der mögliche Call- und Put-Eingaben für binäre Optionen generiert. Der Indikator funktioniert nach drei verschiedenen Strategien: 1) Durch das Ablesen der Volumina wird ein Signal gesendet, wann sich der Preis umkehren sollte 2) Durch die Divergenz zwischen Preis und Volumen sendet es ein Signal, wann sich der Trend fortsetzen oder umkehren sollte 3) Durch die Konvergenz zwischen Preis und Volumen sendet es ein Signal, wann sich der Trend
Hammer Star
Arkadii Zagorulko
This powerful tool is designed to help traders identify key reversal patterns in their charts, including the hammer and star bar formations. With this indicator, you can quickly and easily spot these patterns as they form, allowing you to make well-informed trades and potentially increase your profits. The Hammer Start indicator is customizable, allowing you to set your own parameters for identifying patterns and alerts. Whether you're a seasoned trader or just starting out, the Hammer and Star
FREE
NakaTrend
Ricardo De Andrade Nakano
"Präsentieren Sie NakaTrend: Ihr ultimativer Trenddetektor für MetaTrader 5! Bereit, Ihr Handelserlebnis zu revolutionieren? Lernen Sie NakaTrend kennen, Ihren zuverlässigen Indikator zur präzisen und einfachen Identifizierung von Trendwechseln. Mit NakaTrend verpassen Sie nie wieder die Gelegenheit, Marktschwankungen zu nutzen. Wenn ein Bullentrend entsteht, signalisiert NakaTrend dies mit einem grünen Dollarzeichen und fordert Sie auf, eine Kauforder zu platzieren. Und wenn sich die Stimm
FREE
KT DMA is a modified and advanced version of the classic Displaced Moving Averages with buy/sell crossover alerts and a Multi-Timeframe scanner that shows DMA's direction across each real-time time frame. A Displaced Moving Average is a simple moving average that moves ahead or backward in a time frame (either short-term or long-term). It also allows you to predict price movement more accurately. Features Depicts the trend direction using the alignment of three moving averages. Buy/Sell signa
DYNAMIC SR TREND CHANNEL Dynamic SR Trend Channel is a simple indicator for trend detection as well as resistance/support levels on the current timeframe. It shows you areas where to expect possible change in trend direction and trend continuation. It works with any trading system (both price action and other trading system that use indicators) and is also very good for renko charting system as well. In an uptrend, the red line (main line) serves as the support and the blue line serves as the
NDX 100 Swing EA MT5
Carlos Osvaldo Delgado
NDX 100 Swing EA Dieser Fachberater handelt mit dem Nasdaq 100-Index. Die Strategie kauft Einbrüche, indem sie von Aufwärtstrends profitiert. Die Investition ist langfristig angelegt (Swing). Es verwendet den RSI-Tagesindikator als Signal für die Eröffnung von Operationen, die Verwaltung der Operationen, das Risikoniveau und das Kapitalmanagement erfolgen auf der Grundlage von Wahrscheinlichkeitsberechnungen auf der Grundlage von Statistiken. Um dies zu erreichen, befindet sich dieses Projekt s
--- StudentK Sync Chart --- 1. Move charts at the same time 2. Cross check among different Symbols and Timeframes 3. Plan your own trading strategies --- Context --- StudentK is not indicated as a master or K Sir for knowledgeable person who claims for winning all the time. (But lots of traders should know the fact that it is rarely truth, especially in fluctuated period of time) StudentK is a group of years-experienced traders who want to share amazing tools in Free and Paid versions. Aimi
Aussenstab Markttechnik
Alexander Josef Zeidler
Dieser Indikator zeigt Aussenstäbe (AS) im Chart in Kerzenform. Die Farben der Kerzen können individuell eingestellt werden. Auch unterschiedliche Farben für bärische und bullische Aussentäbe sind möglich. Zusätzlich ist auch die Farbe der Dochte bzw. Umrandung einstellbar. Aussenstäbe werden z.B. von Michael Voigt im Buch "Das große Buch der Markttechnik" erwähnt. Alle anderen Kerzen sind Innenstäbe.
Dieser Multi-Timeframe- und Multi-Symbol-Indikator scannt nach Pin-Bars, Morgen-/Abendsternen, Engulfings, Tweezers, Three Line Strikes, Inside Bars und Wimpel und Dreiecken.   Der Indikator kann auch im Single-Chart-Modus verwendet werden. Bitte lesen Sie mehr über diese Option in den Produktinformationen       bloggen   .       In Kombination mit Ihren eigenen Regeln und Techniken ermöglicht Ihnen dieser Indikator, Ihr eigenes leistungsstarkes System zu erstellen (oder zu verbessern). Merkmale
FIRST 10 COPIES AT 30 USD, NEXT PRICE WOULD BE 50 USD HAWA MOMENTUM & TREND PRO (MT5) Advanced trading indicator with proper pre-defined entry and exit levels with almost 80% win rate.  Its smart and advanced algorithm detects trend and trend strength using momentum for maximum profits and send signals after filtering out market noise. SETTINGS: Please make sure all inputs are NOT "false" in indicator properties otherwise it will not display identified trades. Directory Location: Download f
O  GRIDBOT WIM  robô de investimento para Mini Índice. Parametrizado com grade linear ou zona de expansão (FIMATHE). CONFIGURAÇÕES: Ponto de entrada Pivot dia anterior    double r1 = pivot + distance;    double r2 = r1 + distance;    double r3 = r2 + distance;    double r4 = r3 + distance;    double r5 = r4 + distance;    double r6 = r5 + distance;    double r7 = r6 + distance;    double r8 = r7 + distance;    double r9 = r8 + distance;    double r10 = r9 + distance;        double s1 = pivot
Käufer dieses Produkts erwarben auch
Zunächst einmal ist es wichtig zu betonen, dass dieses Handelssystem ein Nicht-Repainting-, Nicht-Redrawing- und Nicht-Verzögerungsindikator ist, was es sowohl für manuelles als auch für automatisches Trading ideal macht. Das "Smart Trend Trading System MT5" ist eine umfassende Handelslösung, die für neue und erfahrene Trader maßgeschneidert ist. Es kombiniert über 10 Premium-Indikatoren und bietet mehr als 7 robuste Handelsstrategien, was es zu einer vielseitigen Wahl für verschiedene Marktbe
Atomic Analyst MT5
Issam Kassas
3.64 (11)
Zunächst einmal ist es erwähnenswert, dass dieser Handelsindikator nicht neu malt, nicht neu zeichnet und keine Verzögerung aufweist, was ihn sowohl für manuellen als auch für Roboterhandel ideal macht. Der Atom-Analyst ist ein PA-Preisaktionsindikator, der die Stärke und das Momentum des Preises nutzt, um einen besseren Vorteil auf dem Markt zu finden. Ausgestattet mit fortschrittlichen Filtern, die helfen, Rauschen und falsche Signale zu entfernen, und das Handelspotenzial zu erhöhen. Durch
Quantum Trend Sniper
Bogdan Ion Puscasu
5 (37)
Wir stellen vor       Quantum Trend Sniper Indicator   , der bahnbrechende MQL5-Indikator, der die Art und Weise, wie Sie Trendumkehrungen erkennen und handeln, verändert! Entwickelt von einem Team erfahrener Händler mit über 13 Jahren Handelserfahrung,       Quantum Trend Sniper-Indikator       wurde entwickelt, um Ihre Trading-Reise mit seiner innovativen Methode zur Identifizierung von Trendumkehrungen mit extrem hoher Genauigkeit auf ein neues Niveau zu heben. ***Kaufe Quantum Trend Snipe
FX Volume MT5
Daniel Stein
4.94 (17)
Erhalten Sie Ihr tägliches Marktupdate mit Details und Screenshots über unser Morning Briefing hier auf mql5 und auf Telegram ! FX Volume ist der ERSTE und EINZIGE Volumenindikator, der einen ECHTEN Einblick in die Marktstimmung aus Sicht eines Brokers bietet. Es bietet fantastische Einblicke in die Positionierung von institutionellen Marktteilnehmern, wie z.B. Brokern, auf dem Forex-Markt, viel schneller als COT-Berichte. Diese Informationen direkt auf Ihrem Chart zu sehen, ist der wahre Game
FX Power MT5 NG
Daniel Stein
5 (4)
Erhalten Sie Ihr tägliches Marktupdate mit Details und Screenshots über unser Morning Briefing hier auf mql5 und auf Telegram ! FX Power MT5 NG ist die nächste Generation unseres langjährig sehr beliebten Währungsstärkemessers FX Power. Und was bietet dieser Stärkezähler der nächsten Generation? Alles, was Sie am ursprünglichen FX Power geliebt haben PLUS GOLD/XAU-Stärkeanalyse Noch präzisere Berechnungsergebnisse Individuell konfigurierbare Analysezeiträume Anpassbares Berechnungslimit für noc
Advanced Supply Demand MT5
Bernhard Schweigert
4.53 (15)
Derzeit 33% Rabatt! Die beste Lösung für jeden Anfänger oder erfahrenen Händler! Dieser Indikator ist ein einzigartiges, qualitativ hochwertiges und erschwingliches Trading-Tool, da wir eine Reihe von proprietären Funktionen und eine neue Formel integriert haben. Mit diesem Update werden Sie in der Lage sein, doppelte Zeitrahmenzonen anzuzeigen. Sie können nicht nur einen höheren TF (Zeitrahmen) anzeigen, sondern sowohl den Chart-TF als auch den höheren TF: SHOWING NESTED ZONES. Alle Supply Dema
RelicusRoad Pro MT5
Relicus LLC
4.82 (22)
Jetzt 147 US -Dollar (nach ein paar Aktualisierungen auf 499 US -Dollar) - Unbegrenzte Konten (PCs oder MACs) RelicusRoad Benutzerhandbuch + Schulungsvideos + Zugang zur privaten Discord-Gruppe + VIP-Status EINE NEUE ART, DEN MARKT ZU BETRACHTEN RelicusRoad ist der weltweit leistungsstärkste Handelsindikator für Forex, Futures, Kryptowährungen, Aktien und Indizes und gibt Händlern alle Informationen und Tools, die sie benötigen, um profitabel zu bleiben. Wir bieten technische Analysen un
XQ Indicator MetaTrader 5
Marzena Maria Szmit
5 (1)
Step into the realm of Forex trading with confidence and precision using XQ, a cutting-edge Forex indicator designed to elevate your trading game to unprecedented heights. Whether you're a seasoned trader or just stepping into the world of currency exchange, XQ Forex Indicator empowers you with the insights and signals needed to make informed trading decisions. The signal conditions are a combination of three indicators, and XQ Forex Indicator only display  medium and long-term trends . The ind
The Volume by Price Indicator for MetaTrader 5 features Volume Profile and Market Profile TPO (Time Price Opportunity). Get valuable insights out of currencies, equities and commodities data. Gain an edge trading financial markets. Volume and TPO histogram bar and line charts. Volume Footprint charts. TPO letter and block marker charts including split structures. Versatile segmentation and compositing methods. Static, dynamic and flexible ranges with relative and/or absolute visualizations. Lay
Dies ist ein Indikator für MT5, der genaue Signale für den Einstieg in einen Handel ohne Repainting (Neuzeichnen) liefert. Er kann auf alle Finanzwerte angewendet werden: Forex, Kryptowährungen, Metalle, Aktien, Indizes. Er liefert ziemlich genaue Schätzungen und sagt Ihnen, wann es am besten ist, eine Position zu eröffnen und zu schließen. Sehen Sie sich das Video (6:22) mit einem Beispiel für die Verarbeitung nur eines Signals an, das sich für den Indikator gelohnt hat! Die meisten Händler ver
ICT, SMC, SMART MONEY CONCEPTS, SMART MONEY, Smart Money Concept, Support and Resistance, Trend Analysis, Price Action, Market Structure, Order Blocks, BOS/CHoCH,   Breaker Blocks ,  Momentum Shift,   Supply&Demand Zone/Order Blocks , Strong Imbalance,   HH/LL/HL/LH,    Fair Value Gap, FVG,  Premium  &   Discount   Zones, Fibonacci Retracement, OTE, Buy Side Liquidity, Sell Side Liquidity, BSL/SSL Taken, Equal Highs & Lows, MTF Dashboard, Multiple Time Frame, BigBar, HTF OB, HTF Market Structure
Blahtech Supply Demand MT5
Blahtech Limited
4.57 (14)
Was: $299  Now: $99   Supply Demand uses previous price action to identify potential imbalances between buyers and sellers. The key is to identify the better odds zones, not just the untouched ones. Blahtech Supply Demand indicator delivers functionality previously unavailable on any trading platform. This 4-in-1 indicator not only highlights the higher probability zones using a multi-criteria strength engine, but also combines it with multi-timeframe trend analysis, previously confirmed swings
Der Gann Square Indikator ist ein leistungsstolles Marktanalyse-Tool, das auf dem Artikel "Mathematische Formel für Marktvorhersagen" von W.D. Gann basiert. Dieses Tool verwendet mathematische Konzepte und Gann-Theorien für eine präzise Marktanalyse. Es beinhaltet Quadratwerte von 144, 90, 52 und auch das Quadrat von 9. Darüber hinaus integriert es die Methode von  zur Quadratwurzel von 9 und deren Beziehung zu Kanälen und dem Sternmuster. Benutzerhandbuch und Anwendung: Vor der Verwendung diese
Wir stellen vor       Quantum Breakout PRO   , der bahnbrechende MQL5-Indikator, der die Art und Weise, wie Sie mit Breakout-Zonen handeln, verändert! Entwickelt von einem Team erfahrener Händler mit über 13 Jahren Handelserfahrung,       Quantum Breakout PRO       ist darauf ausgelegt, Ihre Handelsreise mit seiner innovativen und dynamischen Breakout-Zone-Strategie auf ein neues Niveau zu heben. Der Quantum Breakout Indicator zeigt Ihnen Signalpfeile auf Breakout-Zonen mit 5 Gewinnzielzone
Owl Smart Levels MT5
Sergey Ermolov
4.47 (36)
MT4-Version  |  FAQ Der Owl Smart Levels Indikator ist ein komplettes Handelssystem innerhalb eines Indikators, der so beliebte Marktanalysetools wie die fortschrittlichen Fraktale von Bill Williams , Valable ZigZag, das die richtige Wellenstruktur des Marktes aufbaut, und Fibonacci-Levels , die die genauen Einstiegslevels markieren, enthält in den Markt und Orte, um Gewinne mitzunehmen. Detaillierte Strategiebeschreibung Anleitung zur Verwendung des Indikators Berater-Assistent im Handel Owl H
Gartley Hunter Multi
Siarhei Vashchylka
5 (5)
Gartley Hunter Multi - An indicator for searching for harmonic patterns simultaneously on dozens of trading instruments and on all classic timeframes: (m1, m5, m15, m30, H1, H4, D1, Wk, Mn). Manual (Be sure to read before purchasing) | Version for MT4 Advantages 1. Patterns: Gartley, Butterfly, Shark, Crab. Bat, Alternate Bat, Deep Crab, Cypher 2. Simultaneous search for patterns on dozens of trading instruments and on all classic timeframes 3. Search for patterns of all possible sizes. Fr
Was: $249  Now: $99   Market Profile defines a number of day types that can help the trader to determine market behaviour. A key feature is the Value Area, representing the range of price action where 70% of trading took place. Understanding the Value Area can give traders valuable insight into market direction and establish the higher odds trade. It is an excellent addition to any system you may be using. Inspired by Jim Dalton’s book “Mind Over Markets”, this indicator is designed to suit the
TPSpro TRENDPRO  - is a trend indicator that automatically analyzes the market and provides information about the trend and each of its changes, as well as giving signals for entering trades without redrawing! The indicator uses each candle, analyzing them separately. referring to different impulses - up or down impulse. Exact entry points into transactions for currencies, crypto, metals, stocks, indices!  -  Version MT4                  DETAILED DESCRIPTION        /       TRADING SETUPS       
Golden Spikes Detector
Batsirayi L Marango
5 (1)
Golden Spikes Detector This indicator is based on an advanced strategy primarily for trading spikes on Boom and Crash Indices. Complex algorithms were implemented to detect high probability entries only. It alerts on potential Buy and Sell entries. To trade spikes on the Deriv or Binary broker, only take Buy Boom and Sell Cash alerts. It was optimised to be loaded on 5-minute timeframe although multiple timeframe analysis is done in the background. Features ·             Desktop pop up and sound
Matrix Arrow Indicator MT5
Juvenille Emperor Limited
5 (14)
Matrix Arrow Indicator MT5   ist ein einzigartiger 10-in-1-Trend, der zu   100 % nicht neu gezeichnet   werden kann. Multi-Timeframe-Indikator, der für alle Symbole/Instrumente verwendet werden kann:   Forex ,   Rohstoffe ,   Kryptowährungen ,   Indizes ,   Aktien .  Der  Matrix Arrow Indicator MT5  wird den aktuellen Trend in seinen frühen Stadien bestimmen und Informationen und Daten von bis zu 10 Standardindikatoren sammeln, die sind: Durchschnittlicher Richtungsbewegungsindex (ADX) Rohstoff
IX Power MT5
Daniel Stein
5 (2)
IX Power   bringt die unschlagbare Präzision von FX Power endlich auch zu Nicht-Forex-Symbolen. Es bestimmt präzise die Intensität von kurz-, mittel- und langfristigen Trends in Ihren Lieblingsindizes, Aktien, Rohstoffen, ETFs und sogar Kryptowährungen. Sie können   alles analysieren, was   Ihr Terminal zu bieten hat. Probieren Sie es aus und erleben Sie, wie   sich Ihr Timing   beim Handel   deutlich verbessert . IX Power Hauptmerkmale 100% präzise, nicht nachpinselnde Berechnungsergebni
Account Graph MT5
Kyra Nickaline Watson-gordon
5 (1)
An indicator to draw a graph of account current and historical state such as Balance, Equity, Margin, Free Margin, Margin Level, Drawdown, Account Profit, Deposit and Withdrawals. Indicator Inputs : Draw Balance Graph Draw Equity Graph Draw Margin Graph Draw Free Margin Graph Draw Margin Level Graph Draw Drawdown Graph Draw Account Profit Graph Hide Data on Chart and Buffers Connect Gaps by Lines Sign of DDs on Profit Sign of DDs on Loss Tips : The Indicator will draw historical balance gra
Golden Gate Algo MT5
James David Lane
4 (6)
40% RABATT ZU WEIHNACHTEN! PREISERHÖHUNG AUF $250 AM 1. JANUAR! Vorstellung von GoldenGate Entries: Eine hochmoderne Handelslösung! Entdecken Sie einen revolutionären Ansatz zum Handel mit GoldenGate Entries (GGE), einem fortschrittlichen Indikator, der entwickelt wurde, um Ihr Handelserlebnis zu verbessern. GGE bietet eine umfassende Palette von Funktionen, um Benutzer mit Präzision und Vertrauen in ihren Handelsentscheidungen auszustatten. Paare: Beliebig (FX - Rohstoffe - Aktien - Akti
Bill Williams Advanced
Siarhei Vashchylka
5 (3)
Bill Williams Advanced is designed for automatic chart analysis using Bill Williams' "Profitunity" system. The indicator analyzes four timeframes at once. Manual (Be sure to read before purchasing) Advantages 1. Automatically analyzes the chart using the "Profitunity" system of Bill Williams. The found signals are placed in a table in the corner of the screen. 2. Equipped with a trend filter based on the Alligator indicator. Most of the system signals are recommended to be used only accordi
Der Forex TPA Indikator deckt die wahren Aktionen der Marktmacher auf, immer dann wenn sie passieren. "Kämpfe nicht gegen die Marktmacher an, sondern folge ihnen", ist wohl der beste Rat, den ein Trader bekommen kann. Der TPA Indikator zeigt jedesmal seine Signale an wenn die Bullen definitiv stärker sind als die Bären und umgekehrt. Dieser Indikator wurde VON Tradern FÜR Trader gemacht und ist 100% NICHT NACHZEICHNEND! Signale werden STRENG am Schluss einer Kerze  generiert. Das sagen unsere Ku
TrendMaestro5
Stefano Frisetti
note: this indicator is for METATRADER4, if you want the version for METATRADER5 this is the link:  https://www.mql5.com/it/market/product/108106 TRENDMAESTRO recognizes a new TREND in the bud, he never makes mistakes. The certainty of identifying a new TREND is priceless. DESCRIPTION TRENDMAESTRO identifies a new TREND in the bud, this indicator examines the volatility, volumes and momentum to identify the moment in which there is an explosion of one or more of these data and therefore the mome
Das 123-Muster ist eines der beliebtesten, leistungsstärksten und flexibelsten Diagrammmuster. Das Muster besteht aus drei Preispunkten: einem Boden, einem Gipfel oder Tal und einem Fibonacci-Retracement zwischen 38,2% und 71,8%. Ein Muster gilt als gültig, wenn der Preis jenseits des letzten Gipfels oder Tals abbricht, in dem der Indikator einen Pfeil zeichnet, einen Alarm auslöst und der Handel platziert werden kann. [ Installationsanleitung | Update-Anleitung | Fehlerbehebung | FAQ | Alle Pr
TrendDecoder Premium MT5
Christophe, Pa Trouillas
5 (1)
Top bewertet auf anderem MarketPlace -  Jetzt verfügbar auf METATRADER Identifizieren Sie Bereiche und die nächsten wahrscheinlichen Bewegungen     |    Erhalten Sie früheste Signale und die Stärke von Trends     |    Klare Ausstiegssignale vor Umkehrung     |    Erkennen Sie die Fibo-Levels, die der Kurs testen wird    |  Indikator, der nicht zurückverfolgt, nicht verzögert - ideal für den manuellen und automatisierten Trading - geeignet für alle Vermögenswerte und Zeiteinheiten - 50% Rabatt  
Quantum Heiken Ashi PRO MT5
Bogdan Ion Puscasu
4.5 (8)
Wir stellen den   Quantum Heiken Ashi PRO   vor Die Heiken-Ashi-Kerzen wurden entwickelt, um klare Einblicke in Markttrends zu geben und sind bekannt für ihre Fähigkeit, Rauschen herauszufiltern und falsche Signale zu eliminieren. Verabschieden Sie sich von verwirrenden Preisschwankungen und begrüßen Sie eine glattere, zuverlässigere Diagrammdarstellung. Was den Quantum Heiken Ashi PRO wirklich einzigartig macht, ist seine innovative Formel, die traditionelle Candlestick-Daten in leicht lesbare
Trade Assistant MetaTrader System  — a multi-timeframe system that is based on three standard indicators:   Stochastic oscillator ,   RSI   (Relative Strength Index), and   CCI   (Commodity Channel Index). It displays current trend directions for M1, M5, M15, M30, H1, H4, D1, W1, and MN1 timeframes. When you follow such an indicator you have a clear picture of the trends across all important timeframes. It doesn't matter which timeframe you attach this indicator to. Input parameters CheckCandl
Weitere Produkte dieses Autors
Ich empfehle Ihnen, die zu lesen       Produkt-Blog   (Handbuch) von Anfang bis Ende damit       Es ist von Anfang an klar, was der EA bietet. Die Hauptstrategie dieses Expert Advisors (EA) besteht darin, Trades zu platzieren, wenn 3 gleitende Durchschnitte (MA) in aufeinanderfolgender Ausrichtung und in einem bestimmten Abstand voneinander sind (dies kann zum Beispiel für eine nicht sehr bekannte Strategie verwendet werden, die von einigen institutionellen Händlern verwendet wird , die die MAs
Dieser Multi-Time-Frame- und Multi-Symbol-Indikator kann die folgenden 5 Kreuze identifizieren: wenn ein sich schnell bewegender Durchschnitt eine Linie des langsamen gleitenden Durchschnitts kreuzt. wenn der Preis einen einzelnen gleitenden Durchschnitt erreicht hat (oben/unten geschlossen oder gerade abgesprungen). wenn eine Triple Moving Average Formation aufgetreten ist (alle 3 MA:s in aufeinanderfolgender Ausrichtung) wenn die MACD-Hauptlinie die Signallinie kreuzt. wenn die Signallinie die
I recommend you to read the   product's blog  (manual) from start to end so that it is clear from the beginning what the indicactor offers. This multi time frame and multi symbol indicator identifies double or triple top/bottom formations or a following neckline breakout (confirmed top/bottom). It offers filters for RSI overbought/oversold, candle patterns (pin bar, engulfing, tweezer, morning/evening star, three line strike) and divergences (MACD, OsMA, Awesome (AO), RSI, CCI, Stochastic) whic
I recommend you to read the   product's blog  (manual) from start to end so that it is clear from the beginning what the indicactor offers. This multi time frame and multi symbol divergence dashboard indicator sends an alert when one or two different divergences have been identified. It can be used with all time frames from M1 to MN. It is possible to enable moving average or RSI trend filter to filter out only the strongest setups. Combined with your own rules and techniques, this indicator wi
The indicator identifies when a divergence occurs between price and an indicator or oscillator. It identifies both regular and hidden divergences. Combined with your own rules and techniques, this indicator will allow you to create (or enhance) your own powerful system. Features Can detect divergences for the following oscillators/indicators:   MACD, OsMA, Stochastics, RSI, CCI, RVI, Awesome, ADX, ATR, OBV, Composite index, MFI and Momentum. Only one oscillator/indicator can be selected. Draws
FREE
I recommend you to read the   product's blog  (manual) from start to end so that it is clear from the beginning what the indicactor offers. This multi time frame and multi symbol divergence dashboard indicator sends an alert when one or two different divergences have been identified. It can be used with all time frames from M1 to MN. Maximum 9 time frames can be shown in the dashboard at the same time. It is possible to enable moving average, RSI or Bollinger bands trend filter to filter out on
Dieser Angebots- und Nachfragezonenindikator zeichnet die Zonen auf dem Chart und sendet Warnungen, wenn der Preis eine Zone erreicht oder durchbrochen hat. Es ist auch möglich, es zu verwenden, um über reguläre doppelte Tops/Bottoms anstelle von Zonen benachrichtigt zu werden. Es ist möglich, RSI-, Volumen- und Divergenzfilter zu verwenden, um nur die stärksten Setups herauszufiltern. In Kombination mit Ihren eigenen Regeln und Techniken ermöglicht Ihnen dieser Indikator, Ihr eigenes leistungss
I recommend you to read the   product's blog  (manual) from start to end so that it is clear from the beginning what the indicactor offers. This multi time frame and multi symbol trend indicator sends an alert when a strong trend or trend reversal has been identified. It can do so by selecting to build up the dashboard using Moving average (single or double (both MA:s aligned and price above/below both)), RSI, Bollinger bands, ADX, Composite index (Constance M. Brown), Awesome (Bill Williams), 
This multi time frame and multi symbol indicator scans for pin bars. Combined with your own rules and techniques, this indicator will allow you to create (or enhance) your own powerful system. Features Can monitor all symbols visible in your Market Watch window at the same time. Apply the indicator to just one chart and instantly monitor the entire market. Can monitors every time frame, from M1 to MN, and sends you a real-time alert when a pin bar is identified. All Metatrader native alert types
I  recommend you to read the   product's blog  (manual) from start to end so that it is clear from the beginning what the indicator offers. This multi time frame and multi symbol indicator identifies double top/bottom, head & shoulders, pennant/triangle and flag patterns. It is also possible to setup alerts only when a neckline/triangle/flagpole breakout has occured (neckline breakout = confirmed signal for top/bottoms and head & shoulders).  The indicator can also be used in single chart mode.
Please if possible consider the  paid version  which I will continue to develop (there will be no future updates for this free version). This Expert Advisor identifies when a divergence occurs between price and an oscillator/indicator. It identifies both regular/classical (trend reversal) and hidden (trend continuation) divergences. It has RSI, bollinger, stochastics, moving average and ADX filter options which makes it possible to filter out only the strongest setups. The default settings ar
FREE
Dieser Multisymbol- und Multi-Timeframe-Indikator kann nicht nur bullische und bärische Dreilinien-Strike-Formationen finden, sondern auch nach den folgenden Candlestick-Mustern suchen (siehe Screenshots zur Erklärung der Muster): Drei weiße Soldaten (Umkehrung>Fortsetzungsmuster) Drei schwarze Krähen (Umkehrung> Fortsetzungsmuster) Die Formationen erscheinen nicht sehr oft auf höheren Zeitrahmen, wenn die strikte Option in den Indikatoreinstellungen aktiviert ist. Aber wenn sie es tun, ist es e
This indicator can send alerts when a Heiken Ashi Smoothed color change occurs. Combined with your own rules and techniques, this indicator will allow you to create (or enhance) your own powerful system. Features Can send all types of alerts. Option to delay the alert one or more bars in order to confirm the color (trend) change. Input parameters Candle shift for alert: Default is 1. Setting it to 0 will alert you on color change on the current candle. This should be regarded as a pending (uncon
FREE
Averaging down EA
Jan Flodin
5 (1)
This cost averaging Expert advisor (EA) places additional trades in the same direction as the original (manually opened) order when the price goes against you. It can be used as a grid system or as pure martingale system (exponential increasing of lot size) or smoothed martingale (for instance linear increasing of the lot size). Due to the risk involved, this EA is more suitable for intermediate to advanced traders who are well aware of how to handle risk management and trading an already profit
This indicator can send alerts when a Heiken Ashi Smoothed color change occurs. Combined with your own rules and techniques, this indicator will allow you to create (or enhance) your own powerful system. Features Can send all types of alerts. Option to delay the alert one bar in order to confirm the color (trend) change. Input parameters Wait for candle close: 'true' or 'false'. Setting it to 'true' will delay the alert to the opening of the bar following the bar where the color change occurred.
FREE
Ich empfehle Ihnen, den   Blog (Handbuch) des Produkts   von Anfang bis Ende zu lesen, damit von Anfang an klar ist, was der EA bietet. Dieser Expert Advisor erkennt, wann eine Divergenz zwischen dem Preis und einem Oszillator/Indikator auftritt. Es identifiziert sowohl reguläre/klassische (Trendumkehr) als auch versteckte (Trendfortsetzung) Divergenzen. Es verfügt über Angebots-/Nachfragezone, RSI, Bollinger, Stochastik, gleitenden Durchschnitt (regulärer MA und Hull MA), ADX und Volumenfilter
The indicator identifies when a divergence occurs between price and an indicator or oscillator. It identifies bullish and bearish hidden or regular (classical) divergences. Combined with your own rules and techniques, this indicator will allow you to create (or enhance) your own powerful system. Features Can detect divergences for the following indicators/oscillators: MACD, OsMA (Moving average of Oscillator), Stochastics, RSI, CCI, RVI, Awesome (AO), ADX, ATR, OBV, MFI, Momentum and   Composi
FREE
I recommend you to read the   product's blog  (manual) from start to end so that it is clear from the beginning what the indicactor offers. This multi time frame and multi symbol indicator identifies double or triple top/bottom formations or a following neckline breakout (confirmed top/bottom). It offers RSI, pin bar, engulfing, tweezer, morning/evening star filters as well divergence filter options which makes it possible to filter out only the strongest setups. The indicator can also be used
This indicator recognizes a special type of Inside Bar formation which is formed by a big Master candle followed by 4 smaller candles (please see the strategy explanation below). Features Plots buy/sell stop lines on the chart as well as well as take profit and stop loss levels. The TP/SL levels are based on the Average True Range (ATR) indicator. Object colors are changeable. Sends you a real-time alert when a Master candle formation is identified - sound / popup / email / push notification. On
I recommend you to read the   product's blog  (manual) from start to end so that it is clear from the beginning what the indicactor offers. This multi time frame and multi symbol supply and demand zone dashboard indicator sends alerts when the price has reached a supply/demand zone. It is also possible to use it to be alerted about regular double tops/bottoms instead of zones. It can be used with all time frames from M1 to MN. It is possible to use RSI, divergence (MACD, OsMA, RSI or Awesome) a
I recommend you to read the  product's blog  (manual) from start to end so that it is clear from the beginning what the indicator offers. This multi time frame and multi symbol supply and demand zone dashboard indicator sends alerts when the price has reached a supply/demand zone. It is also possible to use it to be alerted about regular double tops/bottoms instead of zones. It can be used with all time frames from M1 to MN. Maximum 9 time frames can be shown in the dashboard at the same time. 
Der Indikator identifiziert, wenn eine Divergenz zwischen dem Preis und einem Oszillator/Indikator auftritt. Es identifiziert sowohl reguläre als auch versteckte Abweichungen. Es verfügt über eine RSI-Filteroption, die es ermöglicht, nur die stärksten Setups herauszufiltern. Der Indikator bietet auch Optionen zum Warten auf eine Engulfing-Formation, den Ausbruch des Donchian-Kanals oder bis der Preis einen gleitenden Durchschnitt überschreitet   (siehe Screenshot Nr. 3).       um die Divergenz z
I recommend you to read the   product's blog  (manual) from start to end so that it is clear from the beginning what the indicactor offers. This multi time frame and multi symbol indicator can identify the following 5 crosses: when a fast moving average crosses a slow moving average line. when price has reached a single moving average (closed above/below or just bounced). when a triple moving average formation has appeared (all 3 MA:s in consecutive alignment). when the MACD main line crosses t
Bitte erwägen Sie nach Möglichkeit den Kauf       MT5-Version   , die ich weiter entwickeln werde (es wird keine zukünftigen Updates für diese MT4-Version geben). Ich empfehle Ihnen auch, die zu lesen       Produkt-Blog   (Handbuch) von Anfang bis Ende, damit von Anfang an klar ist, was EA bietet. Die Hauptstrategie dieses Expert Advisors (EA) besteht darin, Trades zu platzieren, wenn 3 gleitende Durchschnitte (MA) in aufeinanderfolgender Ausrichtung und in einem bestimmten Abstand voneinander
I recommend you to read the   product's blog  (manual) from start to end so that it is clear from the beginning what the indicactor offers. This indicator for Metatrader 4 identifies when a divergence occurs between price and an oscillator/indicator. It identifies both bullish and bearish divergences. It has a RSI filter option which makes it possible to filter out only the strongest setups. The indicator also offers options to wait for an Engulfing formation, Donchian channel breakout or for p
Dieser Multi-Timeframe- und Multi-Symbol-Indikator scannt nach Pin-Bars, Morgen-/Abendsternen, Engulfings, Tweezers, Three Line Strikes, Inside Bars und Wimpel und Dreiecken.   Der Indikator kann auch im Single-Chart-Modus verwendet werden. Bitte lesen Sie mehr über diese Option in den Produktinformationen       bloggen   .       In Kombination mit Ihren eigenen Regeln und Techniken ermöglicht Ihnen dieser Indikator, Ihr eigenes leistungsstarkes System zu erstellen (oder zu verbessern). Merkmale
Dieser Multi-Time-Frame- und Multi-Symbol-Indikator scannt nach Pin-Bars, Morgen-/Abendsternen, Engulfings, Pinzetten, Drei-Linien-Strikes, Inside Bars und Wimpel und Dreiecken. Der Indikator kann auch im Single-Chart-Modus verwendet werden. Bitte lesen Sie mehr über diese Option im Produkt   Blogs   . In Kombination mit Ihren eigenen Regeln und Techniken ermöglicht Ihnen dieser Indikator, Ihr eigenes leistungsstarkes System zu erstellen (oder zu verbessern). Merkmale Kann alle in Ihrem Market
This multi time frame and multi symbol indicator identifies when the stochastics signal line (D) crosses the stochastics main line (K) as well as options  to scan for main line and signal line level crossovers.  As a bonus it can also scan for Bollinger bands and RSI overbought/oversold crosses. Combined with your own rules and techniques, this indicator will allow you to create (or enhance) your own powerful system. Features Can monitor all symbols visible in your Market Watch window at the sam
This multi indicator/oscillator (hereafter indicator), multi time frame and multi symbol indicator identifies when a divergence occurs between price and one, two or three indicators. It identifies both regular/classical (trend reversal) and hidden (trend continuation) divergences. It has RSI and MA trend filter options which makes it possible to filter out only the strongest setups. Combined with your own rules and techniques, this indicator will allow you to create (or enhance) your own powerfu
This multi time frame and multi symbol indicator identifies fractals patterns. As a bonus it can also scan for Parabolic SAR (pSAR) trend changes. Combined with your own rules and techniques, this indicator will allow you to create (or enhance) your own powerful system. Features Can monitor all symbols visible in your Market Watch window at the same time. Apply the indicator to just one chart and instantly monitor the entire market. Can monitor every time frame, from M1 to MN, and sends you a
Auswahl:
Maria Angelova
247
Maria Angelova 2024.02.03 08:31 
 

I've been using it for a week now. A unique indicator. Really extremely useful indicator for beginners.Thanks to the creator for creating it

Andreas Ullrich
34
Andreas Ullrich 2023.11.13 17:34 
 

This is a very useful indicator. It works properly. Well done!

tunck
1164
tunck 2023.07.06 14:01 
 

Very good tool and great support!

Johan Julien Aubry
855
Johan Julien Aubry 2023.02.12 11:38 
 

This very cheap indicator allows finding good entry signals with a lot of possibilities to customise settings. Jan is really helpful and very reactive. Well documented and EA compatible. I totally recommend this product!

DownTheRabbitHole
352
DownTheRabbitHole 2022.01.12 06:29 
 

The Author has done a remarkable job, keep it up... And raise your price... : )

deadzone111
20
deadzone111 2021.11.09 09:18 
 

RECOMMENDED Needs some reading in order to understand the logic but overall the paying version is amazing and very accurate. Also, I had a few questions and the developer answer very fastly. it worth the money. RECOMMENDED.

Antwort auf eine Rezension
Version 2.3 2023.12.11
*** Please always make a backup of the existing indicator (the .ex5 file) before you make an update ***

Change log:
- added a moving average (MA) trend filter which can be enabled for top/bottoms, head & shoulders and flags.
- new additional input for symbols.
- the indicator can now draw the Moving average (if time frame set to 'current') and RSI indicators on the chart if any of these filters have been enabled.
Version 2.2 2023.06.28
*** Please always make a backup of the existing indicator (the .ex5 file) before you make an update ***

This is not a mandatory update if your broker is not using the "-" (minus) character in the symbol names.
Version 2.1 2023.06.25
*** Please always make a backup of the existing indicator (the .ex5 file) before you make an update ***

Change log:
- added an option to write the signals as global variables instead of to a file (to be used by an EA)
Version 2.0 2023.02.10
*** IMPORTANT - please always make a backup of the existing indicator (the .ex5 file) before you make an update ***

Change log:
- bug fix in the flag scanning. In some cases an array out of range error appeared on lower time frames
- added the option to select whether the signal file should be stored in the datafolder or in the common folder
Version 1.9 2023.02.08
*** IMPORTANT - please always make a backup of the existing indicator (the .ex5 file) before you make an update ***

Change log:
- when backtesting the file with signals will be written to the Metatrader Common\Files folder instead of to the regular data folder
- added the input parameter 'Only chart symbol and time frame in tester'. When set to 'false' signals from all symbols given in the 'Symbols to scan' parameter will be written to the file. In this mode the pattern lines will not be drawn on the tester chart
Version 1.8 2021.12.29
*** Please always make a backup of the existing indicator (the .ex5 file) before you make an update ***

- added a possibility to set the scanning interval in seconds. Default is 1. Can be set to a higher value in order to prevent possible performance issues on slower computers.
Version 1.7 2021.12.15
*** Please always make a backup of the existing indicator (the .ex5 file) before you make an update ***

- added a possibility to use the indicator in single chart mode (checking only one symbol and time frame). It will then draw the patterns on the chart where the indicator is running. This option is in some ways limited though. More information in the prroduct's blog.
- corrected a bug regarding the drawing of some of the pattern lines in the strategy tester
- added drawing of breakout arrows
Version 1.6 2021.10.28
*** Please always make a backup of the existing indicator (the .ex5 file) before you make an update ***

- added the possibility to work with flag (pole) breakouts
- added the possibility to use the ATR indicator (period 14) instead of points for calculating the offset. For this reason I have removed the option to use separate point values since ATR will basically do the same work.
- added the possibility to set a custom panel title
Version 1.5 2020.09.23
*** Please always make a backup copy of the existing indicator (the .ex5 file) before you make the update ***

- added a possibility to work with pennant and triangles break-outs
Version 1.4 2020.09.01
*** Please always make a backup of the existing indicator (the .ex5 file) before you make an update ***

- bug fix. Not mandatory of everything is already working as it should.
Version 1.3 2020.06.09
Recompiled (recommended by Metaquotes as of June 05,2020) to the new MT5 version 2485: https://www.mql5.com/en/forum/342948
Version 1.2 2020.06.04
- fixed an issue with lines sometimes not beeing drawn correctly for top/bottom break-outs
Version 1.1 2020.01.24
- added scanning for flag patterns (beta version)
- the alert text for the email alert is now in the body of the email alerts instead of in the subject
- added the possibility to insert a custom text to the pop-up (on-screen) alert
- added the signal price and time (right shoulder) to the end of the alert text for Head and Shoulder alerts