SR levels true
- Indikatoren
- Version: 1.0
- Aktivierungen: 5

Der Indikator SR levels true ist in kleinen Zeitrahmen sehr nützlich für Scalping, während er in größeren Zeitrahmen gut für Day- oder Positionshandel geeignet ist.
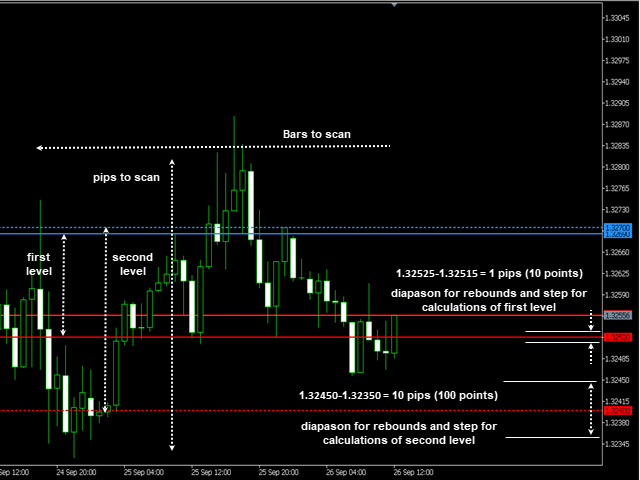
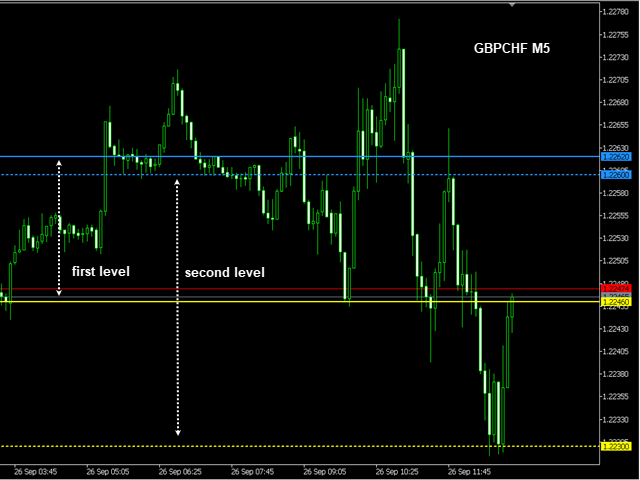
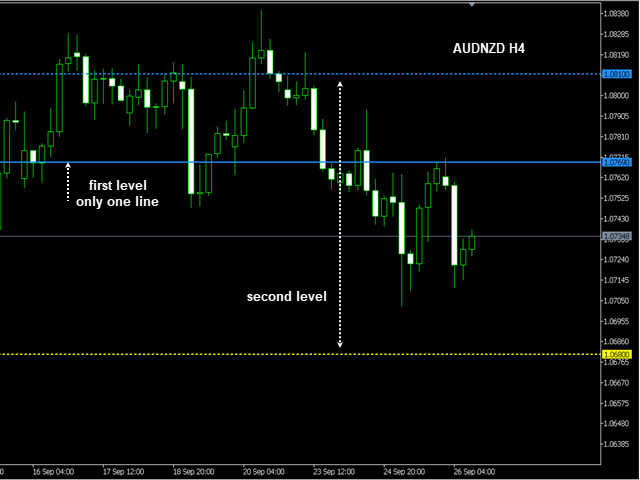
SR levels true kann 4 Unterstützungs-/Widerstandsniveaus basierend auf definierten maximalen Rücksprüngen vom Preisniveau zeichnen. Der Indikator scannt eine bestimmte Anzahl von Balken in der Zeitachse und eine bestimmte Anzahl von Pips in der Preisachse (beide Seiten - aufwärts und abwärts) und berechnet, wie oft der Preis von den gescannten Preisniveaus zurückgewiesen wurde. Auf den Kursniveaus, auf denen die maximalen Rückschläge gezählt werden, werden entsprechend Unterstützungs- oder Widerstandsniveaus eingezeichnet.
Es ist wichtig zu erwähnen, dass für die erste Ebene die Diapason (oder Breite) des Preisniveaus, von dem abgelehnt wird, standardmäßig 1 Pip und für die zweite Ebene 10 Pips beträgt. Wenn der Pip-Wert der Aktie sehr klein ist (z.B. Bitcoin), ist es sinnvoll, den Pip-Power-Wert von der Standardeinstellung 1 auf 2 oder höher zu erhöhen . Wenn der Pip-Power-Wert 2 ist, bedeutet das, dass für die erste Ebene die Preisdiapason, von der abgelehnt werden soll, 10 Pips und für die zweite - 100 Pips beträgt. Für mehr Klarheit können Sie den ersten Screenshot sehen.
Denken Sie auch daran, dass, wenn Sie z.B. 50 Pips zum Scannen einstellen, dies bedeutet, dass der Indikator für das erste Level 50 Pips in beide Richtungen mit einem Schritt von 1 Pip scannt und für das zweite Level 500 Pips mit einem Schritt von 10 Pips scannt.
Manchmal kann es vorkommen, dass die Linien der zweiten Ebene zwischen den Linien der ersten Ebene liegen, oder wenn es nicht genügend Rebounds gibt, wird die Ebene überhaupt nicht gezeichnet.
Eingabeparameter:
Haupteinstellungen
- Zu scannende Balken - wählen Sie die Anzahl der zu scannenden Balken
- Pips to scan - wählen Sie die Anzahl der zu scannenden Pips für eine Richtung
- Rebounds min - geben Sie die Anzahl der minimalen Rebounds ein, um die Linie zu zeichnen
- Pip-Power - Dezimalgrad. 1 bedeutet 1 Pip (10 Punkte), 2 bedeutet 10 Pip (100 Punkte) und so weiter.
Einstellungen der Linien
- Farbe des Levels - wählen Sie eine Farbe aus dem Dropdown-Menü
- Breite der Ebene - geben Sie eine ganze Zahl ein
- Ebenenstil - wählen Sie den Stil aus dem Dropdown-Menü