Chart patterns scanner MT5

4.33

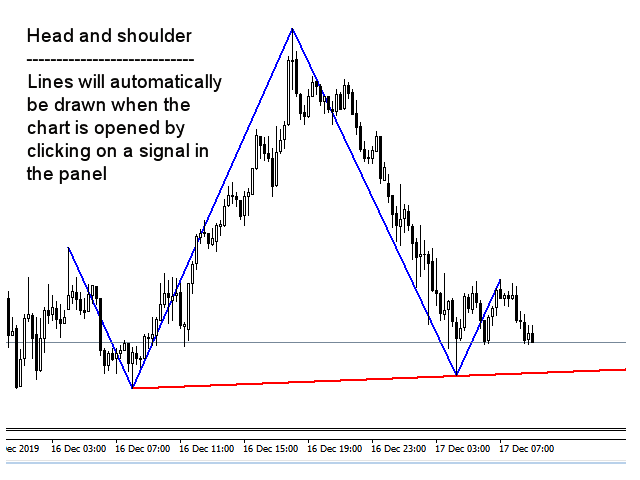
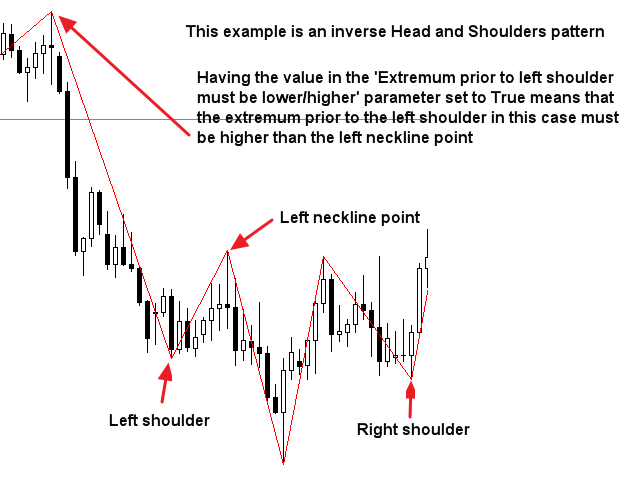
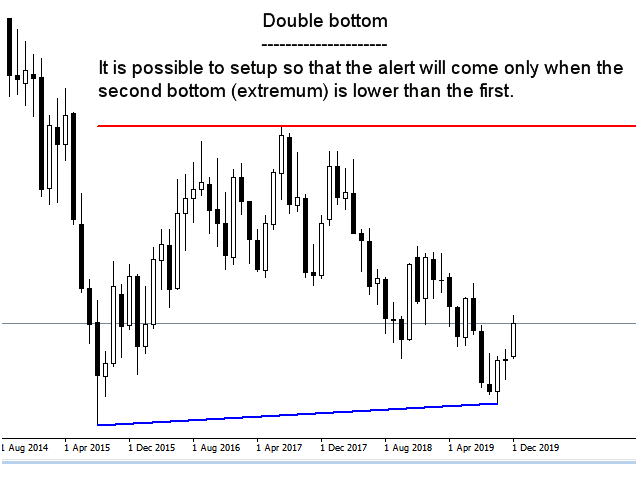
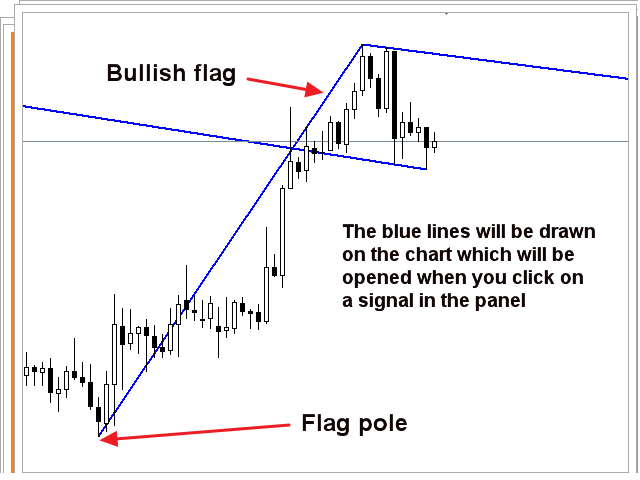
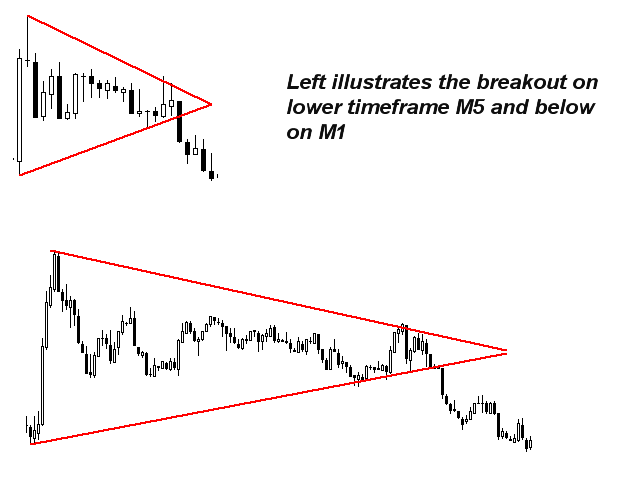
Questo indicatore multi-time frame e multi-simbolo identifica i modelli doppio alto/basso, testa e spalla, gagliardetto/triangolo e bandiera. È anche possibile impostare avvisi solo quando si è verificato un breakout della scollatura/triangolo/asta della bandiera (breakout della scollatura = segnale confermato per la parte superiore/inferiore e testa e spalle).   L'indicatore può essere utilizzato anche in modalità grafico singolo. Si prega di leggere di più su questa opzione nel prodotto blog. Combinato con le tue regole e tecniche, questo indicatore ti permetterà di creare (o migliorare) il tuo potente sistema.

Caratteristiche

  • Può monitorare contemporaneamente tutti i simboli visibili nella finestra Market Watch. Applica l'indicatore a un solo grafico e monitora istantaneamente l'intero mercato.
  • Può monitorare ogni intervallo di tempo, da M1 a MN, e ti invia un avviso in tempo reale quando il pattern è stato identificato o in caso di breakout. Sono supportati tutti i tipi di avvisi nativi di Metatrader.
  • Può utilizzare l'RSI come filtro di tendenza per identificare correttamente potenziali inversioni.
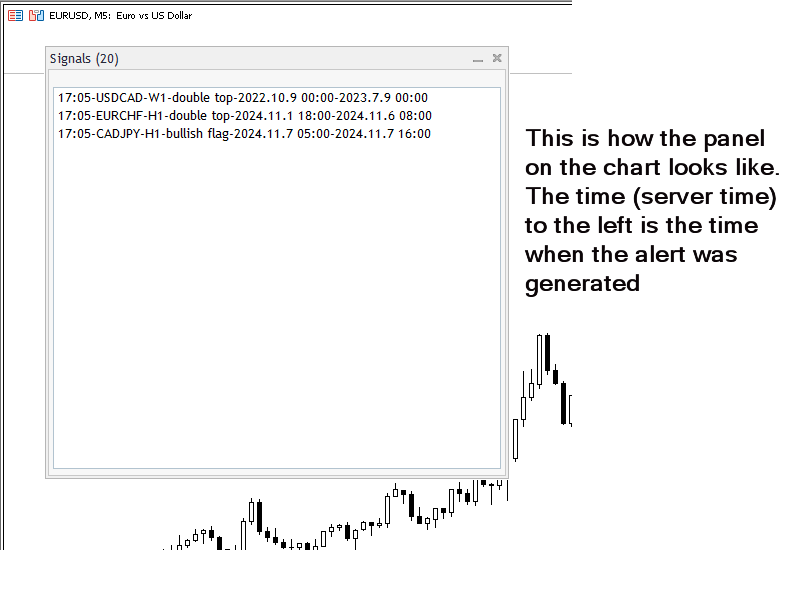
  • L'indicatore include un pannello interattivo. Cliccando su un elemento verrà aperto un nuovo grafico con il simbolo e l'intervallo di tempo in questione.
  • L'indicatore scrive i segnali in un file di testo che può essere utilizzato da un Expert Advisor (EA) per il trading automatico. Ad esempio questo prodotto. Puoi trovare maggiori informazioni sul contenuto e sulla posizione del file di testo nel blog.

Parametri di input

La descrizione e la spiegazione dei parametri di input si trovano qui.

Importante

Si prega di notare che, a causa della multi funzionalità, né i consigli di acquisto e vendita né le linee e le frecce verranno disegnate sul grafico in cui è installato l'indicatore. Le linee che mostrano il modello verranno disegnate sul grafico che verrà aperto facendo clic su un segnale nel pannello.

È altamente consigliabile posizionare l'indicatore su un grafico pulito (vuoto) senza altri indicatori o consulenti esperti su di esso che potrebbero interferire con lo scanner.

Recensioni 7
Maria Angelova
340
Maria Angelova 2024.02.03 08:31 
 

I've been using it for a week now. A unique indicator. Really extremely useful indicator for beginners.Thanks to the creator for creating it

Andreas Ullrich
151
Andreas Ullrich 2023.11.13 17:34 
 

This is a very useful indicator. It works properly. Well done!

tunck
1234
tunck 2023.07.06 14:01 
 

Very good tool and great support!

Prodotti consigliati
I  recommend you to read the   product's blog  (manual) from start to end so that it is clear from the beginning what the indicator offers. This multi time frame and multi symbol indicator scans for engulfing and tweezer formations.  The indicator can also be used in single chart mode. Combined with your own rules and techniques, this indicator will allow you to create (or enhance) your own powerful system. Features Can monitor all symbols visible in your Market Watch window at the same time. A
Institutional Structure & Momentum Dashboard PRO Institutional Structure & Momentum Dashboard PRO is a technical analysis indicator for MetaTrader 5 designed to display market structure, price levels, and momentum conditions across multiple timeframes. The indicator projects support and resistance levels derived from higher timeframe data and combines them with additional filters to assist in identifying potential trading conditions. It provides a visual overview of price structure and signal s
My Point MT5
Claudia Ramona Angerer
Diagnosis of major and minor pivot Trend detection with many signals Can be used in all symbols Can be used in all time frames Settings: Back Show: The number of candles it displays If you need any adjustments, or have any questions or suggestions, message me How to trade: Blue: sell signal Red: buy signal Blue and red at the same time: no signal Exit signal: Opposite signal
Pivot Scenario Dashboard is a compact trading indicator designed to display daily pivot-based market structure in a clean and professional dashboard. It automatically calculates the main pivot level, support and resistance zones, and scenario-based market bias for the current symbol. The indicator helps traders quickly identify: main pivot level bullish and bearish trigger areas support and resistance levels target projection levels current market scenario in a compact dashboard Main Features: D
MTF Levels And Moving Averages is a professional indicator designed to identify key support and resistance levels across multiple timeframes. The tool helps traders locate precise entry and exit points by analyzing market structure and price action patterns. Key Features The indicator provides multi-timeframe analysis covering H1, H4, D1, and W1 periods simultaneously. It identifies supply and demand zones where price typically reacts, using color-coded visualization to distinguish between dif
Market session with fibonacci
Batsukh Sumchin Khuyagbaatar
Questo indicatore è l'indicatore più comune che utilizziamo ogni giorno, comprese le nostre strategie più utilizzate, ICT e SMC, limiti di stop loss e limiti di liquidità che si verificano negli orari di apertura e chiusura degli scambi, nonché il volume degli scambi con Fibonacci e lo zoom avanti e indietro, e le azioni più comuni che vuoi vedere, come la selezione del movimento di scambio che vuoi vedere e l'estrazione di Fibonacci, sono indicatori completamente automatici che ti consentono di
Questo indicatore multi time frame e multi simbolo identifica formazioni alto/basso doppie o triple o un successivo breakout della scollatura (confermato alto/basso). Offre RSI, pin bar, engulfing, tweezer, filtri a stella del mattino/sera e opzioni di filtro di divergenza che consentono di filtrare solo le configurazioni più forti.       L'indicatore può essere utilizzato anche in modalità grafico singolo. Si prega di leggere di più su questa opzione nel prodotto   blog .   Combinato con le tue
IS PRO Estructura Institucional
Medina Cortez Edison Armando
INSTITUTIONAL STRUCTURE PRO Market Structure + Swings + Fair Value Gaps with SOR Priority Institutional Structure Pro is an advanced market structure indicator based on institutional analysis. The system automatically identifies: Structural highs and lows Structure breakouts (SOR – Structure Override / priority breakout) Bullish and bearish fair value gaps (FVG) Real inefficiency zones with precise rectangles All directly on the chart, with no delay and no repainting. What Does the
H4 Structure Entry Dashboard is a professional multi-timeframe trading assistant that combines H4 market structure with H1/M15 entry confirmation , displayed through a clean on-chart dashboard and clear BUY/SELL arrows . It is designed for traders who want fast, structured decision-making: Structure first (H4) → Entry second (H1/M15). Key Features True multi-timeframe logic Higher timeframe bias from H4 Entry confirmation on H1 or M15 Market Structure Tools (H4) Automatically detects and draws
Send me a message so I can send you the setfile Robot robusto con diverse configurazioni disponibili, Da utilizzare con BTC su un intervallo di tempo di 10 minuti con le impostazioni nello screenshot qui sotto. Acquistando il robot esperto, hai il diritto di richiedere modifiche per continuare a migliorare il bot. Caratteristiche principali Strategia di crossover della media mobile: L'EA utilizza due medie mobili (MA1 e MA2) per generare segnali di trading. Un incrocio della MA più veloce
Questo indicatore è un indicatore per l'analisi automatica delle onde perfetto per il trading pratico! Caso... Nota:   non sono abituato a usare nomi occidentali per la classificazione delle onde a causa dell'influenza della convenzione di denominazione di Tang Lun (Tang Zhong Shuo Zen), ho chiamato l'onda base come   penna   e la banda dell'onda secondaria come   segmento   At allo stesso tempo, il segmento ha la direzione del trend. La denominazione   è principalmente segmento di trend   (que
I recommend you to read the  product's blog  (manual) from start to end so that it is clear from the beginning what the indicator offers. This multi time frame and multi symbol supply and demand zone dashboard indicator sends alerts when the price has reached a supply/demand zone. It is also possible to use it to be alerted about regular double tops/bottoms instead of zones. It can be used with all time frames from M1 to MN. Maximum 9 time frames can be shown in the dashboard at the same time. 
LR Pivots Combo Statistics That Show You Where the Market Stands! Key Features (updated V2.1) 1. Auto-Plotting Linear Regression Channel Trend Direction — Uses slope (normalized by ATR) to identify whether the market is in an uptrend, downtrend, or ranging sideways. Trend Quality (R-Squared) — Tells you if the trend is statistically consistent (Stable) or just noise (Volatile). Useful for filtering out unreliable setups. Standard Deviation Bands — Shows how far price has deviated from the regre
I  recommend you to read the   product's blog  (manual) from start to end so that it is clear from the beginning what the indicator offers. In addition to finding bullish and bearish Three line strike formations this multi symbol and mutli time frame indicator can also scan for the following candlestick patterns (please see screenshots for explanation of the patterns): Three white soldiers (reversal>continuation pattern) Three black crows (reversal>continuation pattern) The formations do not ap
Smart Pullback Breakout Entry
Olurotimi Olugbenga Awolade
DESCRIPTION: Smart Pullback Breakout Entry — M15 Range Breakout with DiNapoli Targets Detects consolidation ranges on M15 and triggers entry on breakout in the H1 trend direction. Includes DiNapoli Fibonacci take-profit targets and automatic exit on H1 reversal signal. ENTRY LOGIC: Reads H1 trend and pullback status via GlobalVariables Detects price consolidation (ranging behavior for N bars) Confirms breakout with volume spike (configurable multiplier) Generates BUY signal on upward breakout in
Anubi Terminal MT5
Marco Maria Savella
Anubi Terminal è un assistente professionale per il trading manuale, progettato per chi esige precisione e un controllo rigoroso del rischio. Anubi non è un robot automatico; è uno strumento che potenzia l'esecuzione del trader, automatizzando i calcoli complessi e la gestione delle posizioni. Caratteristiche Principali: Calcolo del Rischio Istantaneo: Determina automaticamente il lotto in base al saldo e alla percentuale di rischio desiderata. Modalità Statica e Dinamica: Passa da una gestione
Il Brilliant Reversals MultiCurrency Scanner MT5 è un indicatore di trading all'avanguardia progettato per i trader che cercano di identificare potenziali punti di inversione su più coppie di valute. Sfruttando algoritmi avanzati, questo strumento fornisce informazioni istantanee, rendendolo prezioso sia per i trader principianti che per quelli esperti che mirano a ottimizzare le loro strategie di trading. Questo indicatore potenzia i trader fornendo segnali di acquisto e vendita in tempo reale
ZigZagAllinOne
Alberto Da Silva Lira
Indicator focusing on the market's ZigZag, also adding 2 other already established indicators: Book of Offers and Balance Aggressor (Time & Trades), this indicator allows to detect the best price trigger (buy or sell) in the aggressions to the Book of Offers including filters important as Aggression in Candle. Recommended use on the Brazilian iBovespa B3, but it also serves in Forex as long as the assets have information from the Book, in the case of Forex it is not possible to use the Aggress
This indicator is based on Mr. Mark Fisher's ACD strategy, based on the book "The Logical Trader." - OR lines - A lines - C lines - Daily pivot range - N days pivot range - Customizable trading session - Drawing OR with the desired time Drawing levels A and C based on daily ATR or constant number - Possibility to display daily and last day pivots in color zone - Displaying the status of daily PMAs (layer 4) in the corner of the chart - Show the order of daily pivot placement with multi-day piv
FREE
SMC Structural Hub PRO SMC Structural Hub PRO is a Forex trading robot (Expert Advisor) for MetaTrader 5 designed to combine multiple trading approaches into a single configurable system. The EA integrates several independent strategies, including price structure analysis, pattern recognition, and momentum filtering. Users can enable or disable individual components to adapt the system to different market conditions. The system evaluates price behavior across multiple timeframes and executes tr
Market Scoring System
Vincent Jose Proenca
SISTEMA DI PUNTEGGIO DI MERCATO – Indicatore Avanzato Multi-Timeframe Sistema professionale di analisi del mercato che combina indicatori tecnici, modelli di machine learning e conferme multi-timeframe per generare segnali di trading estremamente accurati. CARATTERISTICHE PRINCIPALI Analisi Multi-Timeframe: Conferma dei segnali su diversi timeframe (M5, H1) per una maggiore probabilità Motore di Punteggio Intelligente: Calcolo di trend, range e incertezza analizzando le ultime 25 candele Rilev
N/B: All our product purchase comes with our free ‘’DAILY   SCALPER EA’’ -   bit.ly/4qlFLNh Whatsapp Developer for yours after successful purchase BOS / CHoCH Signals Scanner Indicator (MT5) See What Smart Money Is Doing — Before the Move Happens Most traders lose because they enter too late, trade against structure, or miss institutional confirmations. The BOS / CHoCH Signals Scanner Indicator was built to solve exactly that. This professional MT5 indicator automatically reads market struc
RSIScalperPro
PATRICK WENNING
Introducing RSIScalperPro - the revolutionary RSI-based indicator for Metatrader 5, specifically designed for scalping in the one-minute chart. With RSIScalperPro, you'll have a powerful toolkit for precise entry and exit signals to take your trading to the next level. RSIScalperPro utilizes two different RSI indicators that provide clear signals for overbought and oversold areas. You can customize the time periods and limit values of the two RSIs according to your preferences to achieve the be
Price Predictor Pro
Emma-ekong Ben Eshiet
Price Predictor Pro Turn Market Patterns into Predictable Profits! Are you tired of guessing where the market will go next? With Price Predictor Pro , you’ll trade with confidence by spotting powerful chart patterns and receiving precise price projections —directly on your MT5 chart. What Price Predictor Pro Does: ️ Detects high-probability chart patterns like Double Tops, Double Bottoms, Head & Shoulders, Flags, Pennants, and more . ️ Instantly projects the next price target using adv
FREE
BreakOutBox MT5
PATRICK WENNING
1 (1)
The Breakout Box for MT5 is a (opening) range breakout Indicator with freely adjustable: - time ranges - end of drawing time - take profit levels by percent of the range size - colors - font sizes It can  not only display the range of the current day, but also for any number of days past. It can be used for any instrument. It displays the range size and by request the range levels and the levels of the take profit niveaus too. By request it shows a countdown with time to finish range.  The indic
SR levels true
Egidijus Bikulcius
Indicator SR levels true in small time frames is very useful for scalping while in bigger ones it is good for day or position trading. SR levels true can draw 4 support/resistance levels based on defined maximum rebouds from price level. Indicator scans  defined number of bars in time axis and defined number of pips in price axis (both sides - up and down) and calculates how much times price was rejected from scanned price levels. At the price levels where maximum rebounds are counted, support
Indicatore Timer Prezzo Bid — Tempismo di Precisione e Tracciamento Intelligente del Prezzo! Porta la tua precisione nel trading al livello successivo con l’ Indicatore Timer Prezzo Bid — uno strumento potente progettato per i trader che valorizzano tempismo, precisione e chiarezza in ogni movimento. Caratteristiche principali: Display Timer Fisso – Sempre visibile sul lato destro del grafico (X_Offset personalizzabile). Tracciamento Dinamico del Prezzo – Il timer si muove flui
Orderflow Super Candles - Simple Footprint Chart Indicator Platform: MetaTrader 5 (MT5)  (The last screenshot shows the use of the DOM tool in conjunction with the product.) 1. Product Introduction Orderflow Super Candles is a professional charting tool based on underlying Tick data analysis, designed to provide traders with a deep "X-ray" view of the market. By parsing the buy and sell volume distribution within each candlestick, this indicator visualizes the hidden market microstructure. It
L'indicatore aiuta ad entrare in un trade seguendo il trend, allo stesso tempo, dopo alcune correzioni. Trova forti movimenti di tendenza di una coppia di valute su un determinato numero di barre e trova anche livelli di correzione per questa tendenza. Se la tendenza è abbastanza forte e la correzione diventa uguale a quella specificata nei parametri, l'indicatore lo segnala. È possibile impostare diversi valori di correzione, i valori di 38, 50 e 62 (livelli di Fibonacci) sono più adatti. Inol
Candle Reversal , is designed to identify and highlight key candlestick patterns that signal potential trend reversals or continuations in the market. It focuses on two primary types of patterns: 3-Line Strike Patterns   (Bullish and Bearish) Engulfing Patterns   (Bullish and Bearish) The indicator provides visual cues (arrows and text labels) on the chart to help traders quickly identify these patterns, making it easier to make informed trading decisions.  use with MACD or awesome oscilator to
Gli utenti di questo prodotto hanno anche acquistato
ARIPoint
Temirlan Kdyrkhan
ARIPoint is a powerful trading companion designed to generate high-probability entry signals with dynamic TP/SL/DP levels based on volatility. Built-in performance tracking shows win/loss stats, PP1/PP2 hits, and success rates all updated live. Key Features: Buy/Sell signals with adaptive volatility bands Real-time TP/SL/DP levels based on ATR Built-in MA Filter with optional ATR/StdDev volatility Performance stats panel (Success, Profit/Loss, PP1/PP2) Alerts via popup, sound, push, or email Cu
SuperScalp Pro
Van Minh Nguyen
4.57 (21)
SuperScalp Pro – Sistema avanzato di indicatore scalping multi-filtro SuperScalp Pro è un indicatore di scalping avanzato che combina il classico Supertrend con molteplici filtri intelligenti di conferma per aiutare a identificare opportunità di trading. Funziona in modo efficiente su diversi timeframe da M1 a H4, con prestazioni ottimizzate su XAUUSD, BTCUSD e principali coppie Forex. L’indicatore fornisce chiari segnali Buy e Sell, insieme a livelli di ingresso, stop loss e take profit calcola
Divergence Bomber
Ihor Otkydach
4.9 (87)
Ogni acquirente dell’indicatore riceverà inoltre gratuitamente: L’utilità esclusiva “Bomber Utility”, che gestisce automaticamente ogni operazione, imposta i livelli di Stop Loss e Take Profit e chiude le posizioni secondo le regole della strategia I file di configurazione (set file) per adattare l’indicatore a diversi asset I set file per configurare il Bomber Utility in tre modalità: “Rischio Minimo”, “Rischio Bilanciato” e “Strategia di Attesa” Una guida video passo-passo per installare, conf
Entry In The Zone and SMC Multi Timeframe is a real-time 2-in-1 market analysis tool that combines market structure analysis and a No Repaint BUY / SELL signal system into a single indicator, built on Smart Money Concepts (SMC) — a widely adopted framework used by professional traders to understand market structure. This indicator helps you see the market more clearly, make decisions based on structure rather than guesswork, and focus on high-probability zones where price is more likely to react
Power Candles MT5
Daniel Stein
4.75 (8)
Power Candles V3 - Il primo indicatore di forza auto-ottimizzante Power Candles V3 trasforma l'analisi della forza di mercato in un sistema di trading immediatamente operativo. L'indicatore non si limita più a colorare il grafico in base alla forza: esegue in background un'auto-ottimizzazione in tempo reale e ti consegna il miglior Stop Loss, Take Profit e soglia di segnale per il tuo simbolo. Un clic lo adotta per il trading live. Questo strumento fa parte dell'ecosistema Stein Investments.  S
Grabber System MT5
Ihor Otkydach
4.83 (23)
Ti presento un eccellente indicatore tecnico: Grabber, che funziona come una strategia di trading "tutto incluso", pronta all’uso. In un solo codice sono integrati strumenti potenti per l’analisi tecnica del mercato, segnali di trading (frecce), funzioni di allerta e notifiche push. Ogni acquirente di questo indicatore riceve anche gratuitamente: L’utility Grabber: per la gestione automatica degli ordini aperti Video tutorial passo dopo passo: per imparare a installare, configurare e utilizzare
Quantum TrendPulse
Bogdan Ion Puscasu
5 (23)
Ecco   Quantum TrendPulse   , lo strumento di trading definitivo che combina la potenza di   SuperTrend   ,   RSI   e   Stocastico   in un unico indicatore completo per massimizzare il tuo potenziale di trading. Progettato per i trader che cercano precisione ed efficienza, questo indicatore ti aiuta a identificare con sicurezza le tendenze di mercato, i cambiamenti di momentum e i punti di entrata e uscita ottimali. Caratteristiche principali: Integrazione SuperTrend:   segui facilmente l'andame
Azimuth Pro
Ottaviano De Cicco
5 (7)
Azimuth Pro V2: Synthetic Fractal Structure and Confirmed Entries for MT5 Overview Azimuth Pro is a multi-level swing structure indicator by Merkava Labs . Four nested swing layers, swing-anchored VWAP, ABC pattern detection, three-timeframe structural filtering, and closed-bar confirmed entries — one chart, one workflow from micro-swings to macro-cycles. This is not a blind signal product. It is a structure-first workflow for traders who care about location, context, and timing. V2 Launch Offe
Se acquisti questo indicatore, riceverai il mio Trade Manager Professionale + EA  GRATUITAMENTE. Innanzitutto è importante sottolineare che questo sistema di trading è un indicatore Non-Repainting, Non-Redrawing e Non-Lagging, il che lo rende ideale sia per il trading manuale che per quello automatico. Corso online, manuale e download di preset. Il "Sistema di Trading Smart Trend MT5" è una soluzione completa pensata sia per i trader principianti che per quelli esperti. Combina oltre 10 indicat
SignalTech MT5 is a trading system for EURUSD, USDCHF, USDJPY, AUDUSD, NZDUSD, EURJPY, AUDJPY, NZDJPY, CADJPY H2 and H3 Timeframe.  It can generate signals with Buy/Sell Arrows and Pop-Up/Sound Alerts. Each signal has clear Entry and Stop Loss levels, which should be automatically flagged on the chart, as well as potential Targets 1, 2, and 3. The Entry and TP levels are fixed after the trade is taken. The exit level is dynamic. If there are signs of a potential short-term trend reversal, the
Gann Made Easy è un sistema di trading Forex professionale e facile da usare che si basa sui migliori principi del trading utilizzando la teoria di mr. WD Gann. L'indicatore fornisce segnali ACQUISTA e VENDI accurati, inclusi i livelli di Stop Loss e Take Profit. Puoi fare trading anche in movimento utilizzando le notifiche PUSH. CONTATTAMI DOPO L'ACQUISTO PER RICEVERE GRATUITAMENTE LE ISTRUZIONI DI TRADING E OTTIMI INDICATORI EXTRA! Probabilmente hai già sentito parlare molte volte dei metodi d
FX Trend MT5 NG
Daniel Stein
5 (4)
FX Trend NG: La Nuova Generazione di Intelligenza di Trend Multi-Mercato Panoramica FX Trend NG è uno strumento professionale di analisi del trend multi-timeframe e monitoraggio dei mercati. Ti consente di comprendere la struttura completa del mercato in pochi secondi. Invece di passare tra numerosi grafici, puoi identificare immediatamente quali strumenti sono in trend, dove il momentum sta diminuendo e dove esiste un forte allineamento tra i timeframe. Offerta di Lancio – Ottieni FX Trend NG
Meravith MT5
Ivan Stefanov
5 (1)
Strumento per market maker. Meravith: Analizzerà tutti i timeframe e mostrerà il trend attualmente in corso. Evidenzierà le zone di liquidità (equilibrio dei volumi) dove i volumi rialzisti e ribassisti sono uguali. Mostrerà tutti i livelli di liquidità dei diversi timeframe direttamente sul grafico. Genererà e presenterà un’analisi di mercato testuale a scopo di riferimento. Calcolerà obiettivi, livelli di supporto e punti di stop-loss in base al trend attuale. Calcolerà il rapporto rischio/ren
Atomic Analyst MT5
Issam Kassas
3.94 (31)
Innanzitutto, vale la pena sottolineare che questo indicatore di trading non è repaint, non è ridisegno e non presenta ritardi, il che lo rende ideale sia per il trading manuale che per quello automatico. Manuale utente: impostazioni, input e strategia. L'Analista Atomico è un indicatore di azione del prezzo PA che utilizza la forza e il momentum del prezzo per trovare un miglior vantaggio sul mercato. Dotato di filtri avanzati che aiutano a rimuovere rumori e segnali falsi, e aumentare il pote
Bill Williams Advanced
Siarhei Vashchylka
5 (11)
Bill Williams Advanced is designed for automatic chart analysis using Bill Williams' "Profitunity" system. The indicator analyzes four timeframes at once. Manual (Be sure to read before purchasing) Advantages 1. Analyzes the chart using Bill Williams' "Profitunity" system. Signals are displayed in a table in the corner of the screen and on the price chart. 2. Finds all known AO and AC signals, as well as zone signals. Equipped with a trend filter based on the Alligator. 3. Finds "Divergence Bar
Trend Screener Pro MT5
STE S.S.COMPANY
4.85 (104)
Indicatore di tendenza, soluzione unica rivoluzionaria per il trading di tendenze e il filtraggio con tutte le importanti funzionalità di tendenza integrate in un unico strumento! È un indicatore multi-timeframe e multi-valuta al 100% non ridipingibile che può essere utilizzato su tutti i simboli/strumenti: forex, materie prime, criptovalute, indici e azioni. Trend Screener è un indicatore di tendenza che segue un indicatore efficiente che fornisce segnali di tendenza a freccia con punti nel gra
Top indicator for MT5   providing accurate signals to enter a trade without repainting! It can be applied to any financial assets:   forex, cryptocurrencies, metals, stocks, indices .  Watch  the video  (6:22) with an example of processing only one signal that paid off the indicator! MT4 version is here It will provide pretty accurate trading signals and tell you when it's best to open a trade and close it. Most traders improve their trading results during the first trading week with the help of
Presentazione       Quantum Breakout PRO   , l'innovativo indicatore MQL5 che sta trasformando il modo in cui scambi le zone di breakout! Sviluppato da un team di trader esperti con un'esperienza di trading di oltre 13 anni,       Quantum Breakout PRO       è progettato per spingere il tuo viaggio di trading a nuovi livelli con la sua strategia innovativa e dinamica della zona di breakout. Quantum Breakout Indicator ti fornirà frecce di segnalazione sulle zone di breakout con 5 zone target di
Scopri quale strategia funziona davvero sul tuo simbolo - prima di rischiare denaro reale. Power Bar rileva le barre di prezzo estreme su qualsiasi simbolo e qualsiasi timeframe, poi esegue istantaneamente il backtest di 3 diverse strategie di trading per confrontare tassi di vincita, fattori di profitto e P&L fianco a fianco. Tutto in un unico pannello interattivo. Niente supposizioni. Niente curve-fitting. Solo dati. Cosa rende Power Bar unico? La maggior parte degli indicatori fornisce un se
Btmm state engine pro
Garry James Goodchild
5 (4)
BTMM State Engine Pro is a MetaTrader 5 indicator for traders who use the Beat The Market Maker approach: Asian session context, kill zone timing, level progression, peak formation detection, and a multi-pair scanner from a single chart. It combines cycle state logic with a built-in scanner dashboard so you do not need the same tool on many charts at once. What it does Draws the Asian session range; session times can follow broker server offset or be set in inputs. Tracks level progression (L
OmniSync Projection
Antonio-alin Teculescu
5 (1)
Chronos Fractal Engine is an innovative price projection indicator for MetaTrader 5, designed to transform your technical analysis by intelligently identifying and projecting historical price patterns. Built upon an advanced correlation algorithm and the fractal principles of the market, this powerful tool visualizes potential future price movements, giving you a unique edge in your trading decisions. What is Chronos Fractal Engine? At its core, the Chronos Fractal Engine employs a sophisticat
FX Power MT5 NG
Daniel Stein
5 (31)
FX Power: Analizza la Forza delle Valute per Decisioni di Trading Più Intelligenti Panoramica FX Power è lo strumento essenziale per comprendere la reale forza delle principali valute e dell'oro in qualsiasi condizione di mercato. Identificando le valute forti da comprare e quelle deboli da vendere, FX Power semplifica le decisioni di trading e rivela opportunità ad alta probabilità. Che tu segua le tendenze o anticipi inversioni utilizzando valori estremi di Delta, questo strumento si adatta
Berma Bands
Muhammad Elbermawi
5 (8)
L'indicatore Berma Bands (BBs) è uno strumento prezioso per i trader che cercano di identificare e capitalizzare i trend di mercato. Analizzando la relazione tra il prezzo e le BBs, i trader possono discernere se un mercato è in una fase di trend o di range. Visita il [ Berma Home Blog ] per saperne di più. Le Berma Bands sono composte da tre linee distinte: la Upper Berma Band, la Middle Berma Band e la Lower Berma Band. Queste linee sono tracciate attorno al prezzo, creando una rappresentazion
Gartley Hunter Multi
Siarhei Vashchylka
5 (11)
Gartley Hunter Multi - An indicator for searching for harmonic patterns simultaneously on dozens of trading instruments and on all possible timeframes. Manual (Be sure to read before purchasing) | Version for MT4 Advantages 1. Patterns: Gartley, Butterfly, Shark, Crab. Bat, Alternate Bat, Deep Crab, Cypher 2. Simultaneous search for patterns on dozens of trading instruments and on all possible timeframes 3. Search for patterns of all possible sizes. From the smallest to the largest 4. All fou
Meridian Pro
Ottaviano De Cicco
5 (1)
Meridian Pro: Professional Multi-Timeframe Trend Matrix for MT5 Overview Meridian Pro is a multi-timeframe trend matrix by Merkava Labs that compresses directional state, strength, momentum condition and matrix agreement into one compact panel. One adaptive engine, applied consistently from M1 to W1. No per-symbol tuning. No indicator stacking. One structured readout across every asset and every timeframe. Launch Offer — Get Meridian Pro for USD 99 (introductory). Regular price: USD 149. 1. Why
Trend indicator AI mt5
Ramil Minniakhmetov
5 (17)
Trend Ai indicator è un ottimo strumento che migliorerà l'analisi di mercato di un trader combinando l'identificazione della tendenza con punti di ingresso utilizzabili e avvisi di inversione. Questo indicatore consente agli utenti di navigare nelle complessità del mercato forex con fiducia e precisione Oltre ai segnali primari, l'indicatore Ai di tendenza identifica i punti di ingresso secondari che si presentano durante i pullback o i ritracciamenti, consentendo ai trader di capitalizzare le
Auto Optimized Parabolic RSI: Motore di Momentum 3D Avanzato La maggior parte degli indicatori per trader privati fallisce perché si affida a parametri statici che smettono di funzionare nel momento in cui la volatilità del mercato cambia. Auto Optimized Parabolic RSI risolve il problema dell'"obsolescenza dell'indicatore" ricalcolando continuamente il proprio vantaggio matematico, portando un adattamento quantitativo di livello istituzionale direttamente sul tuo terminale MT5. Il Vantaggio Prin
L'indicatore Quadrato di Gann è uno strumento potente di analisi di mercato basato sull'articolo "Formula Matematica per le Previsioni di Mercato" scritto da W.D. Gann. Questo strumento utilizza concetti matematici e teorie di Gann per effettuare un'analisi precisa del mercato. Utilizza i quadrati di 144, 90, 52 e anche il quadrato di 9. Inoltre, integra il metodo del  per il quadrato di 9 e la sua relazione con canali e modelli stellari di quel quadrato. Manuale Utente e Applicazione: Prima di
Cvd Divergence
Thalles Nascimento De Carvalho
CVD Divergence – Analisi Professionale del Flusso Ordini e delle Divergenze CVD Divergence è un indicatore tecnico progettato per rilevare divergenze affidabili tra il prezzo e il Cumulative Delta Volume (CVD). Identifica con precisione i momenti in cui il flusso reale degli ordini non conferma il movimento del prezzo, rivelando possibili inversioni, esaurimento del momentum e manipolazioni istituzionali. L’indicatore combina la lettura del volume aggressivo con l’analisi strutturale del prezzo,
FX Volume MT5
Daniel Stein
4.79 (24)
FX Volume: Scopri il Vero Sentimento di Mercato dalla Prospettiva di un Broker Panoramica Rapida Vuoi portare la tua strategia di trading a un livello superiore? FX Volume ti offre informazioni in tempo reale su come i trader retail e i broker sono posizionati—molto prima che compaiano report in ritardo come il COT. Che tu miri a guadagni costanti o desideri semplicemente un vantaggio più solido sui mercati, FX Volume ti aiuta a individuare grandi squilibri, confermare i breakout e perfezionar
Altri dall’autore
The indicator identifies when a divergence occurs between price and an indicator or oscillator. It identifies both regular and hidden divergences. Combined with your own rules and techniques, this indicator will allow you to create (or enhance) your own powerful system. For higher probability setups I can recommend you to use my Supply Demand indicator and trade only if the divergence occurs inside a zone. Supply zone for bearish div and demand zone for bullish div. The optimal scenario is if it
FREE
Questo indicatore traccia zone di domanda e offerta sul grafico. In combinazione con le tue regole e tecniche, questo indicatore ti consentirà di creare (o migliorare) il tuo potente sistema. Dai un'occhiata anche alla   versione a pagamento   che offre molto di più. Il mio consiglio è di cercare opportunità di trading in cui il primo test di zona si verifica dopo almeno 25 barre. Caratteristiche Le zone hanno 3 colori (regolabili tramite input). Colore scuro per la zona non testata, medio per l
FREE
Questo indicatore del dashboard di divergenza multi time frame e multi simbolo invia un avviso quando una o due divergenze diverse sono state identificate su più time frame e non su singole divergenze. Può essere utilizzato con tutte le fasce orarie da M1 a MN. È possibile visualizzare contemporaneamente nella dashboard un massimo di 9 intervalli di tempo. È possibile abilitare il filtro di tendenza della media mobile, dell'RSI o delle bande di Bollinger per filtrare solo le configurazioni più f
Questo indicatore multi time frame e multi simbolo identifica formazioni alto/basso doppie o triple o un successivo breakout della scollatura (confermato alto/basso). Offre RSI, pin bar, engulfing, tweezer, filtri a stella del mattino/sera e opzioni di filtro di divergenza che consentono di filtrare solo le configurazioni più forti.       L'indicatore può essere utilizzato anche in modalità grafico singolo. Si prega di leggere di più su questa opzione nel prodotto   blog .   Combinato con le tue
I recommend you to read the   product's blog  (manual) from start to end so that it is clear from the beginning what the indicactor offers. This multi time frame and multi symbol indicator can identify the following 5 crosses: when a fast moving average crosses a slow moving average line. when price has reached a single moving average (closed above/below or just bounced). when a triple moving average formation has appeared (all 3 MA:s in consecutive alignment) when the MACD main line crosses th
Questo indicatore della zona di domanda e offerta disegna le zone sul grafico e invia avvisi quando il prezzo ha raggiunto o rotto una zona. È anche possibile utilizzarlo per essere avvisati di doppi cime/basse regolari invece che di zone. È possibile utilizzare filtri RSI, volume e divergenza per filtrare solo le configurazioni più potenti. Combinato con le tue regole e tecniche, questo indicatore ti consentirà di creare (o migliorare) il tuo potente sistema. Questo indicatore è per il trader p
This multi time frame and multi symbol indicator scans for pin bars. Combined with your own rules and techniques, this indicator will allow you to create (or enhance) your own powerful system. Features Can monitor all symbols visible in your Market Watch window at the same time. Apply the indicator to just one chart and instantly monitor the entire market. Can monitors every time frame, from M1 to MN, and sends you a real-time alert when a pin bar is identified. All Metatrader native alert types
Questo indicatore riconosce un tipo speciale di formazione Inside Bar che è formata da una grande candela Master seguita da 4 candele più piccole (vedi la spiegazione della strategia di seguito). Caratteristiche Traccia le linee di stop di acquisto/vendita sul grafico, nonché i livelli di take profit e stop loss. I livelli TP/SL si basano sull'indicatore ATR (Average True Range). I colori degli oggetti sono modificabili. Ti invia un avviso in tempo reale quando viene identificata una formazione
Questo indicatore traccia zone di domanda e offerta sul grafico. In combinazione con le tue regole e tecniche, questo indicatore ti consentirà di creare (o migliorare) il tuo potente sistema. Dai un'occhiata anche alla   versione a pagamento   che offre molto di più. Il mio consiglio è di cercare opportunità di trading in cui il primo test di zona si verifica dopo almeno 25 barre. Caratteristiche Le zone hanno 3 colori (regolabili tramite input). Colore scuro per la zona non testata, medio per l
FREE
Questo indicatore può inviare avvisi quando si verifica un cambiamento di colore Heiken Ashi Smoothed. Combinato con le tue regole e tecniche, questo indicatore ti permetterà di creare (o migliorare) il tuo potente sistema. Caratteristiche Può inviare tutti i tipi di avvisi. Possibilità di ritardare l'avviso di una o più barre per confermare il cambio colore (tendenza). Parametri di input Spostamento candela per avviso: l'impostazione predefinita è 1. Impostandolo su 0 ti avviserà del cambiament
FREE
The indicator identifies when a divergence occurs between price and an indicator or oscillator. It identifies bullish and bearish hidden or regular (classical) divergences. Combined with your own rules and techniques, this indicator will allow you to create (or enhance) your own powerful system. For higher probability setups I can recommend you to use my  Supply Demand indicator  and trade only if the divergence occurs inside a zone. Supply zone for bearish div and demand zone for bullish div. T
FREE
Features This is an indicator that recognizes a special type of Inside Bar formation which is formed by a Master candle followed by 4 smaller candles (please see the strategy explanation below). Plots buy/sell stop lines on the chart as well as well as take profit and stop loss levels. The TP/SL levels are based on the Average True Range (ATR) indicator. Object colors are changeable. Sends you a real-time alert when a Master candle formation is identified - sound / pop-up / email / push notifica
I recommend you to read the  product's blog  (manual) from start to end so that it is clear from the beginning what the indicator offers. This multi time frame and multi symbol supply and demand zone dashboard indicator sends alerts when the price has reached a supply/demand zone. It is also possible to use it to be alerted about regular double tops/bottoms instead of zones. It can be used with all time frames from M1 to MN. Maximum 9 time frames can be shown in the dashboard at the same time. 
L'indicatore identifica quando si verifica una divergenza tra il prezzo e un oscillatore/indicatore. Identifica divergenze regolari e nascoste. Ha un'opzione di filtro RSI che consente di filtrare solo le configurazioni più potenti. L'indicatore offre anche opzioni per attendere una formazione Engulfing, un breakout del canale Donchian o che il prezzo superi una media mobile   (vedi screenshot n. 3)       per confermare la divergenza prima di segnalare l'opportunità commerciale. Combinato con le
Questo indicatore può inviare avvisi quando si verifica un cambiamento di colore Heiken Ashi Smoothed. Combinato con le tue regole e tecniche, questo indicatore ti permetterà di creare (o migliorare) il tuo potente sistema. Caratteristiche Può inviare tutti i tipi di avvisi. Possibilità di ritardare di una barra l'avviso per confermare il cambio colore (tendenza). Parametri di input Attendi la chiusura della candela:       'vero o falso'. Impostandolo su 'true' ritarderà l'avviso all'apertura de
FREE
Questo indicatore multi time frame e multi simbolo esegue la scansione di barre pin, stelle del mattino/sera, engulfing, pinzette, colpi a tre linee, barre interne e gagliardetti e triangoli.   L'indicatore può essere utilizzato anche in modalità grafico singolo. Si prega di leggere di più su questa opzione nel prodotto   blog .   Combinato con le tue regole e tecniche, questo indicatore ti consentirà di creare (o migliorare) il tuo potente sistema. Caratteristiche Può monitorare contemporaneame
I recommend you to read the   product's blog  (manual) from start to end so that   it is clear from the beginning what the indicator offers. This multi oscillator, multi time frame and multi symbol indicator identifies when a divergence occurs between price and an oscillator/indicator. It identifies both regular/classical (trend reversal) and hidden (trend continuation) divergences. It has moving average, RSI/Bollinger, ADX, pin bar and engulfing filter options which makes it possible to filter
Ti consiglio di leggere il       blog (manuale) del prodotto   dall'inizio alla fine, in modo che sia chiaro fin dall'inizio cosa offre l'indicatore. Questo indicatore multi time frame e multi simbolo esegue la scansione delle pin bar. In combinazione con le tue regole e tecniche, questo indicatore ti consentirà di creare (o migliorare) il tuo potente sistema. Caratteristiche Puoi monitorare tutti i simboli visibili nella finestra Market Watch contemporaneamente. Applica l'indicatore a un solo
I  recommend you to read the   product's blog  (manual) from start to end so that it is clear from the beginning what the indicator offers. This multi time frame and multi symbol indicator scans for engulfing and tweezer formations. The indicator can also be used in single chart mode. Combined with your own rules and techniques, this indicator will allow you to create (or enhance) your own powerful system. Features Can monitor all symbols visible in your Market Watch window at the same time. Ap
This multi time frame and multi symbol indicator identifies high-probability breakout patterns. It does this by identifying strong, symmetrical pennants and triangles. This pattern DOES NOT appear very often on higher time frames. But when it does, it is a very high-probability setup. The indicator also includes an Inside bars scanner. It can for example be used to detect a special type of Inside bars formation which is formed by a Master candle (MC) followed by 4 inside candles (please see the
This multi time frame and multi symbol indicator scans for Pin bars, Morning/Evening stars, Engulfings, Tweezers, Three line strikes, Inside bars and Pennants and Triangles. The indicator can also be used in single chart mode. Please read more about this option in the product's blog . Combined with your own rules and techniques, this indicator will allow you to create (or enhance) your own powerful system. Features Can monitor all symbols visible in your Market Watch window at the same time. App
I  recommend you to read the   product's blog  (manual) from start to end so that it is clear from the beginning what the indicator offers. This multi symbol and multi time frame indicator scans for the following candlestick patterns (please see screenshot for explanation of the patterns): Three white soldiers (reversal>continuation pattern) Three black crows (reversal>continuation pattern) Bullish and bearish Three line strike (reversal pattern) The patterns do not appear very often on higher
Questo indicatore multi time frame e multi simbolo può identificare le seguenti 5 croci: quando una media mobile veloce attraversa una linea di media mobile lenta. quando il prezzo ha raggiunto una singola media mobile (chiusa sopra/sotto o rimbalzata). quando è apparsa una formazione a media mobile tripla (tutti e 3 i MA:s in allineamento consecutivo). quando la linea principale MACD attraversa la linea di segnale. quando la linea del segnale attraversa la linea MACD zero (0). Combinato con le
L'indicatore identifica quando si verifica una divergenza tra il prezzo e un oscillatore/indicatore. Identifica divergenze sia rialziste che ribassiste. Ha un'opzione di filtro RSI che consente di filtrare solo le configurazioni più forti. L'indicatore offre anche opzioni per attendere un breakout del canale Donchian o che il prezzo attraversi una media mobile (vedi screenshot n. 3) per confermare la divergenza prima di segnalare l'opportunità commerciale. Combinato con le tue regole e tecniche,
Questo indicatore multi time frame e multi simbolo identifica formazioni alto/basso doppie o triple o un successivo breakout della scollatura (confermato alto/basso). Offre filtri RSI, pin bar, engulfing, tweezer, stelle del mattino/sera, nonché MACD, Awesome (AO) o filtri divergenza RSI che consentono di filtrare solo le configurazioni più forti.       L'indicatore può essere utilizzato anche in modalità grafico singolo. Si prega di leggere di più su questa opzione nel prodotto   blog .   Combi
This multi indicator/oscillator (hereafter indicator), multi time frame and multi symbol indicator identifies when a divergence occurs between price and one, two or three indicators. It identifies both regular/classical (trend reversal) and hidden (trend continuation) divergences. It has RSI and MA trend filter options which makes it possible to filter out only the strongest setups. Combined with your own rules and techniques, this indicator will allow you to create (or enhance) your own powerfu
Questo indicatore multi time frame e multi simbolo identifica quando la linea del segnale stocastico attraversa la linea principale stocastica. Come bonus può anche eseguire la scansione delle bande di Bollinger e dei cross RSI ipercomprato/ipervenduto. Combinato con le tue regole e tecniche, questo indicatore ti permetterà di creare (o migliorare) il tuo potente sistema. Caratteristiche Può monitorare contemporaneamente tutti i simboli visibili nella finestra Market Watch. Applica l'indicatore
Averaging down EA
Jan Flodin
5 (1)
This cost averaging Expert advisor (EA) places additional trades in the same direction as the original (manually opened) order when the price goes against you. It can be used as a grid system or as pure martingale system (exponential increasing of lot size) or smoothed martingale (for instance linear increasing of the lot size). Due to the risk involved, this EA is more suitable for intermediate to advanced traders who are well aware of how to handle risk management and trading an already profit
Trend dashboard
Jan Flodin
1 (1)
I recommend you to read the   product's blog  (manual) from start to end so that it is clear from the beginning what the indicactor offers. This multi time frame and multi symbol trend indicator sends an alert when a strong trend or trend reversal has been identified. It can do so by selecting to build up the dashboard using Moving average (single or double ( both MA:s aligned and price above/below both ) ), RSI, Bollinger bands, ADX, Composite index, Parabolic SAR, Awesome (AO), MACD (signal l
Divergence dashboard
Jan Flodin
4.64 (11)
I recommend you to read the   product's blog  (manual) from start to end so that it is clear from the beginning what the indicactor offers. This multi time frame and multi symbol divergence dashboard indicator sends an alert when one or two different divergences have been identified. It can be used with all time frames from M1 to MN. It is possible to enable moving average or RSI trend filter to filter out only the strongest setups. It should be combined with your own confirmation rules, techni
Filtro:
Natascha Jeske
181
Natascha Jeske 2024.06.11 22:21 
 

Leider nicht so gut. Sozusagen alle Double Tops und Double Bottoms liefern Fehlsignale. Head & Shoulders auch nicht so gut.

Maria Angelova
340
Maria Angelova 2024.02.03 08:31 
 

I've been using it for a week now. A unique indicator. Really extremely useful indicator for beginners.Thanks to the creator for creating it

Andreas Ullrich
151
Andreas Ullrich 2023.11.13 17:34 
 

This is a very useful indicator. It works properly. Well done!

tunck
1234
tunck 2023.07.06 14:01 
 

Very good tool and great support!

Johan Julien Aubry
919
Johan Julien Aubry 2023.02.12 11:38 
 

This very cheap indicator allows finding good entry signals with a lot of possibilities to customise settings. Jan is really helpful and very reactive. Well documented and EA compatible. I totally recommend this product!

DownTheRabbitHole
351
DownTheRabbitHole 2022.01.12 06:29 
 

L'utente non ha lasciato alcun commento sulla valutazione.

Ludovic Marc Marie Moncla
163
Ludovic Marc Marie Moncla 2021.11.09 09:18 
 

RECOMMENDED Needs some reading in order to understand the logic but overall the paying version is amazing and very accurate. Also, I had a few questions and the developer answer very fastly. it worth the money. RECOMMENDED.

Rispondi alla recensione