Indicator Z ADR Daily Weekly Monthly Range Alerts
- Indikatoren
- Version: 1.0
- Aktivierungen: 5

Durchschnittlicher täglicher wöchentlicher monatlicher Bereich Alarme.
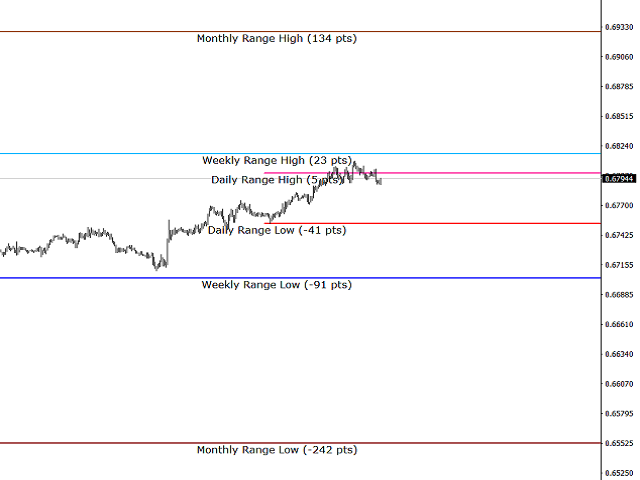
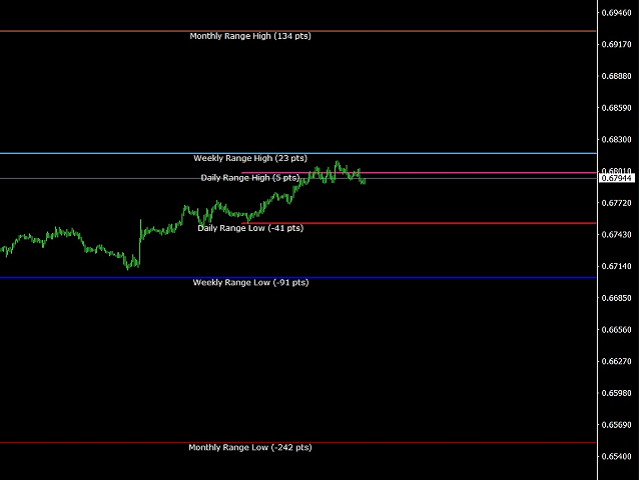
Der vollständigste dynamische Mehrperioden-Range-Indikator mit umfassenden Warnoptionen. Zeigt die Linien der durchschnittlichen Spanne auf dem Diagramm und die Abstände zu den Höchst- und Tiefstwerten der Spanne in Echtzeit an. Benachrichtigungen werden gesendet, wenn die durchschnittlichen Bereiche erreicht werden.
Ein unverzichtbares Werkzeug für jeden ernsthaften Trader!
Die durchschnittlichen Periodenbereiche, insbesondere der ADR (Average Daily Range) für Daytrader, sind einer der nützlichsten und zuverlässigsten Indikatoren, die dem Händler zur Verfügung stehen. Vermeiden Sie immer Fortsetzungsgeschäfte, NACHDEM die Spanne erreicht wurde, und verwenden Sie Ihre eigenen Umkehrstrategien, um wieder in die Spanne zu handeln (RANGE HIGH HIT = NUR VERKAUFEN / RANGE LOW HIT = NUR KAUFEN). Setzen Sie immer sichere Take-Profit-Ziele innerhalb der Spanne. Beenden Sie offene Trades oder beobachten Sie den Markt genau auf Anzeichen einer Umkehr, NACHDEM die Spanne erreicht wurde.
Dieser Indikator bietet Ihnen umfassende Warnoptionen für tägliche, wöchentliche und monatliche Kursspannen, die es Ihnen ermöglichen, mit Zuversicht und im Einklang mit dem zu handeln, was der Markt jeden Tag, jede Woche und jeden Monat tut.
Der ADR ist zweifellos der nützlichste und zuverlässigste Indikator für Forex- und Rohstoff-Daytrader. Tests haben gezeigt, dass ADR10 (10-Tage-Periode) im Durchschnitt das beste Maß für die tägliche Volatilität ist. Behalten Sie jedoch ADR5 genau im Auge, um Veränderungen der Volatilität zu erkennen (wenn ADR5 signifikant von ADR10 abweicht, wissen Sie, dass sich die tägliche Volatilität gerade verändert). Abgesehen von diesen Veränderungsphasen werden Sie feststellen, dass ADR5 und ADR10 bemerkenswert ähnlich sind und dass der Kurs im Allgemeinen immer die ADR-Spanne respektiert, d. h., dass er fast immer jeden Tag die ADR-Spanne berührt und oft vor Handelsschluss wieder innerhalb der Spanne zurückgeht, was zuverlässige Umkehrmöglichkeiten am Tagesende nach starken Bewegungen außerhalb der Spanne bietet, was zeigt, wie beständig die Märkte sind, wenn man die richtigen Instrumente zur Messung hat.
Wenn Sie in der Lage sind, die richtige Trendrichtung zu wählen oder auf der richtigen Seite einer Handelsspanne einzusteigen, können Sie die ADR verwenden, um Ihre täglichen Gewinnziele sicher zu maximieren (verwenden Sie 70-80 % der ADR als sichere tägliche Spanne für die Berechnung der Gewinnmitnahmen). Dies gibt Ihnen die Sicherheit, gewinnbringende Trades länger zu halten, als wenn Sie unsicher sind, wie weit sich der Preis pro Tag bewegt. Außerdem werden Sie so vor schlechten Trendfortsetzungsgeschäften bewahrt, nachdem das ADR oder AWR bereits erreicht wurde (der Kurs wird unweigerlich zum Stillstand kommen oder innerhalb der Spanne zurückgehen).
Die allgemeine Weisheit besagt, dass die wöchentlichen Trendbewegungen zwischen dem Reversal in der Wochenmitte und dem Reversal am Ende der Woche/Freitag in der Regel dem 2-3-fachen der ADR entsprechen, aber mit der Average Weekly Range (AWR) können Sie nun genau wissen, wie weit sich der Kurs jede Woche bewegt, was Ihnen eine weitaus größere Präzision und Zuversicht bei der Maximierung der Take-Profit-Berechnungen gibt. Dies hat einen großen Einfluss auf Ihr durchschnittliches Rendite-Risiko-Verhältnis, das der Schlüssel zu langfristiger Rentabilität im Handel ist.
Anwendungsbeispiele:
Setzen Sie Take-Profit-Ziele für Tagesgeschäfte innerhalb der ADR(Average Daily Range)
Beenden Sie Day Trades, nachdem die ADR erreicht wurde;
Handeln Sie die nachmittägliche Umkehrung beim Tageshoch/Tagestief, nachdem der ADR erreicht wurde;
Setzen Sie Take Profits für wöchentliche Trendtrades innerhalb der AWR(Average Weekly Range);
Beenden Sie Reversal-Trades zur Wochenmitte, nachdem der AWR erreicht wurde;
Traden Sie den End of Week / Friday Reversal, nachdem der AWR erreicht wurde;
Längerfristige Swing-Trades eingeben / filtern, nachdem der AMR erreicht wurde, um den Drawdown zu minimieren(Average Monthly Range)
Format der Warnungen
| ADR |
| "DURCHSCHNITTLICHE TÄGLICHE SPANNE ERREICHT (VERKAUFEN): GBPUSD 1.01234 02-08-19 16.15" |
| "DURCHSCHNITTLICHE TÄGLICHE HANDELSSPANNE ERREICHT (KAUF): GBPUSD 1,01234 02-08-19 16.15 " |
| AWR |
| "DURCHSCHNITTLICHE WÖCHENTLICHE SCHWANKUNGSBREITE (KAUF/VERKAUF): GBPUSD 1.01234 02-08-19 16.15" |
| AMR |
| "DURCHSCHNITTLICHE MONATLICHE HANDELSSPANNE (VERKAUF/KAUF): GBPUSD 1.01234 02-08-19 16.15" |
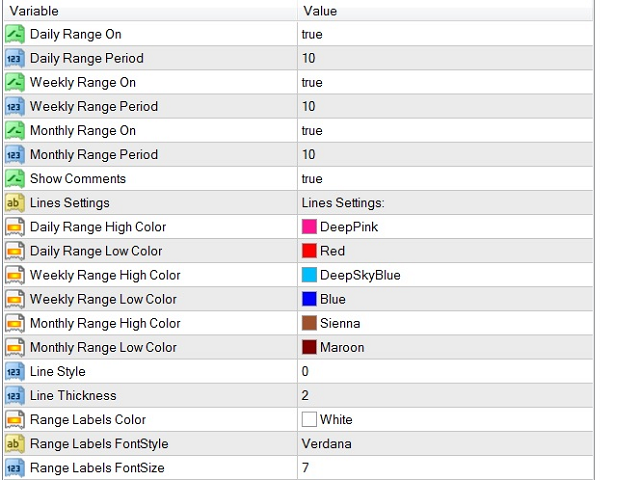
Eingabe-Einstellungen
- Anzeige der TÄGLICHEN, WÖCHENTLICHEN, MONATLICHEN Spanne (Standard = Alle EIN)
- Average Range PERIODS auswählen (Voreinstellung = 10)
- Auswahl der Bereichszeilenfarben (Sie können unterschiedliche Farben für die Zeilen des oberen und unteren Bereichs verwenden)
- Text LABEL FARBE & SCHRIFTGRÖSSE auswählen
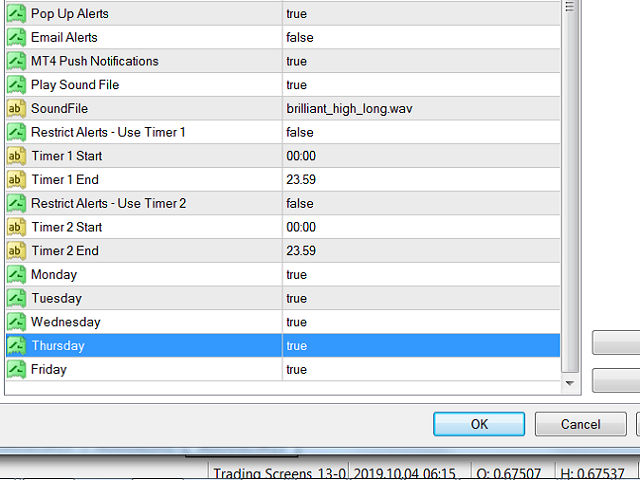
- Wählen Sie ALERT-TYPEN:
Pop-Up-Warnung
Ton-Alarm
E-Mail-Warnungen
MT4 Push-Benachrichtigungen
- Einschränkung der Alarme durch bis zu 2 ALERT-TIMER (Standard = Timer AUS / Benachrichtigungen werden immer gesendet)
- Einschränkung von Alarmen nach Wochentagen (Standard = Alarme jeden Tag EIN)
Für BESTIMMTE Volatilitätswerte zu JEDER Tageszeit SEHEN SIE AUCH:
INDIKATOR Z VERTIKALE LINIEN: https: //www.mql5.com/en/market/product/67058
Sehr nützlich für Time of Day Trading!


Best of its kind. Period. Update: This indicator is too good to be true.