• 概述
  • 评论
  • 评论 (5)
  • 新特性

Pair chart nrp obs

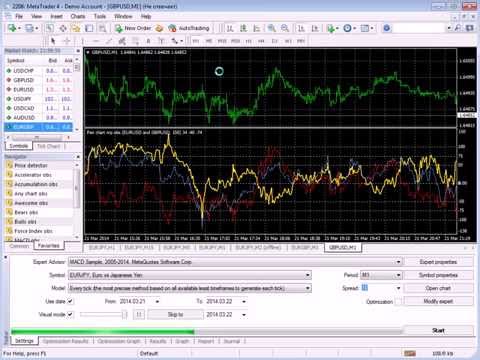
The indicator is based on pair trading methods. It is not redrawn unlike similar indicators.

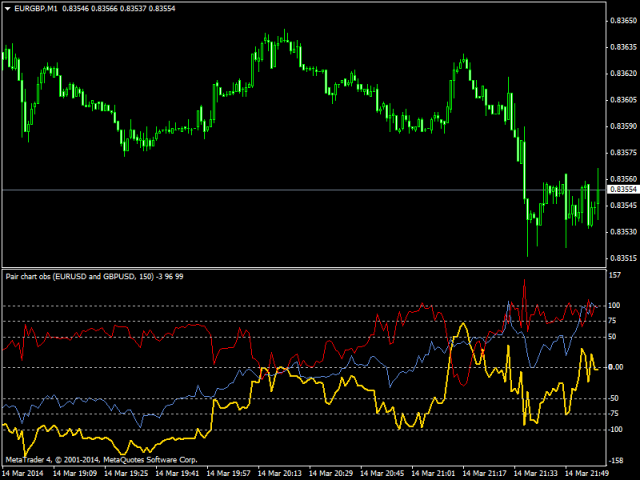
Shows correlation between two selected instruments in percent for a predetermined period, and the positions of the instruments relative to each other.

Has a function for reverse display of any of the analyzed symbols - for instruments with negative correlation.

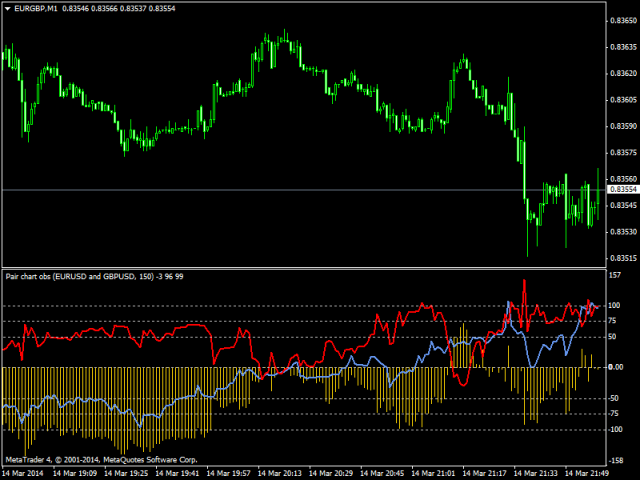
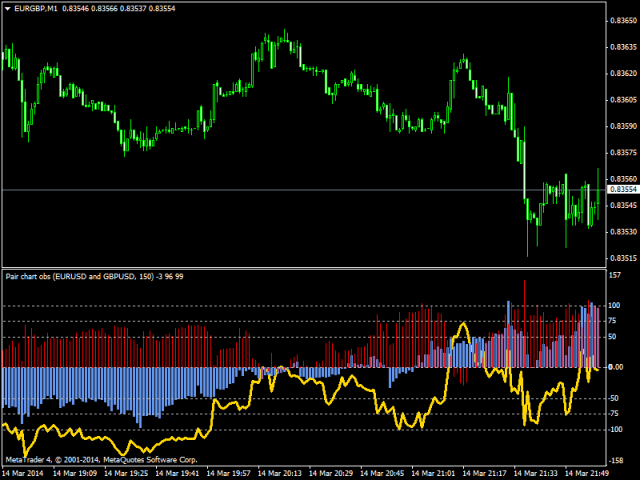
Can be drawn as a line or as a histogram.

Settings:

  • Symb1 - first symbol name.
  • Revers1 - reverse display of the first symbol.
  • Symb2 - second symbol name.
  • Revers2 - reverse display of the second symbol.
  • ExtPeriod- calculation period in bars.
  • Pair_Line_or_Histo - show correlation chart as a line or a histogram.
  • Symb_Line_or_Histo - show price charts as a line or a histogram.
推荐产品
El indicador "MR BEAST ALERTAS DE LIQUIDEZ" es una herramienta avanzada diseñada para proporcionar señales y alertas sobre la liquidez del mercado basándose en una serie de indicadores técnicos y análisis de tendencias. Ideal para traders que buscan oportunidades de trading en función de la dinámica de precios y los niveles de volatilidad, este indicador ofrece una visualización clara y detallada en la ventana del gráfico de MetaTrader. Características Principales: Canal ATR Adaptativo: Calcula
Black series MT4
Dmitriy Kashevich
1 (1)
Black series MT4 - The indicator is designed for trading on binary options with Timeframe M1-M5-M15 Multicurrency (Works on cryptocurrency and currency pairs) The signal appears when the candle opens Up to 90% correct signals There is no signal redrawing at all Can be used with other indicators. Good for scalping! In Settings there is: -Indicator working methods -I Allert Arrow color Red signal down Blue signal up Also watch the video how the indicator works and signals
Owl smart levels
Sergey Ermolov
4.34 (35)
MT5版本  |  FAQ Owl Smart Levels Indicator   是一個完整的交易系統,包含   Bill Williams   的高級分形、構建正確的市場波浪結構的 Valable ZigZag 以及標記準確入場水平的斐波那契水平等流行的市場分析工具 進入市場和地方獲利。 策略的详细说明 指示灯使用说明 顾问-贸易猫头鹰助手助理 私人用户聊天 ->购买后写信给我,我会将您添加到私人聊天中,您可以在那里下载所有奖金 力量在於簡單! Owl Smart Levels   交易系統非常易於使用,因此適合專業人士和剛開始研究市場並為自己選擇交易策略的人。 策略和指標中沒有隱藏的秘密公式和計算方法,所有策略指標都是公開的。 Owl Smart Levels 允許您快速查看進入交易的信號,突出顯示下訂單的水平並向您發送有關已出現信號的通知。 優點很明顯: 清楚地顯示主要和更高時間框架的趨勢方向。 指示儀器信號的出現。 標記開單、止損設置和固定利潤的水平。 沒有多餘的,只有必要的結構! ZigZag   表示全球趨勢的方向,因此也表示貿易方向。 市場反轉點的短線清楚地表明在
Prophet
Andriy Sydoruk
Prophet is a trend indicator. Shows the direction of turning points. Can be used with an optimal risk-to-profit ratio. The arrows indicate favorable moments and directions for entering the market. Uses one parameter for setting (adjust from 1 to 3). The probability of a successful trend is very high. In the course of work, the take-profit is much larger than the stop-loss! Works on all currency pairs and on all timeframes.
PABT Pattern Indicator - it's classical system one of the signal patterns. Indicator logic - the Hi & Lo of the bar is fully within the range of the preceding bar, look to trade them as pullback in trend. In the way if indicator found PABT pattern it's drawing two lines and arrow what showing trend way.  - First line - it's entry point and drawing at: 1. On the high of signal bar or on middle of the signal bar (depending from indicator mode) for buy; 2. On the low of signal bar or on middle of t
Heiken Ashi Smoothed Strategy is a very simple but powerful system to get forex market trend direction. This indicator is actually 2 indicators in 1 pack, Heiken Ashi and Heiken Ashi Smoothed Moving Average both included. Because HA (Heiken Ashi) and HAS (Heiken Ashi Smoothed) are calculated in the same one system event with necessary buffers and loop only, so it is the FAST, OPTIMIZED and EFFICIENT HA having the combined indicator of MetaTrader 4. You can choose to display HA and HAS in the sam
Mr Beast Paterns with alerts
Luis Mariano Vazquez Marcos
El indicador "MR BEAST PATTERNS WITH ALERTS" es una herramienta avanzada diseñada para identificar y notificar automáticamente patrones de oportunidad en el mercado financiero. Basándose en una combinación de análisis técnico y algoritmos inteligentes, este indicador escanea constantemente el gráfico en busca de patrones específicos que podrían indicar momentos propicios para la toma de decisiones. Características Principales: Detección de Patrones: El indicador identifica patrones de oportunida
Spirit mt4
Alena Snigireva
5 (1)
Spirit mt4 is an indicator that works without flashing, the signals are triggered after the arrow at the beginning of the next candle Includes several indicators for overbought and oversold levels. Works with any currency pair: EUR/USD, AUD/USD and others. After the purchase, send me a private message and I will send you the settings that I use for this indicator. Suitable for trading cryptocurrencies. I like to trade cryptocurrency more, so I use it more there. It can also be used
This is Multiple Timeframe of Malaysia SNR Levels and Storyline. The single timeframe version   here Features: + Display level on multiple timeframe (higher or lower) + Turn on/off level on timeframe + Alert when price touch level 1. if high > resistance level but close of candle < resistance level , this level become unfresh - Name of level will have "(m)" meaning mitigated if   close of candle > resistance level , this level become invalid and can be removed in chart (there is setting for keep
MT4 外汇指标“RSI 和 2 条移动平均线” 此指标非常适合动量交易系统。 “RSI 和 2 条移动平均线”指标允许您查看 RSI 本身的快速和慢速移动平均线 指标让您有机会尽早看到趋势变化 “RSI 和 2 条移动平均线”可用于捕捉趋势方向的动量 通过参数设置此指标非常容易(见图) 指标可用于任何时间范围 ................................................................................................................... // 更多出色的专家顾问和指标可在此处获得: https://www.mql5.com/en/users/def1380/seller 这是仅在此 MQL5 网站上提供的原创产品。
The Extreme point indicator helps in determining the probable price reversal points on the chart. The indicator facilitates the search for points to enter the market with greater accuracy. The indicator displays certain impulses, after which there is a high probability of the price continuing its movement in the same direction. The indicator can be used in conjunction with other indicators for a more accurate detection of the position entry points. The indicator can also be used independently. F
This indicator is another variant of the famous powerful indicator Fibonacci-SS https://www.mql5.com/en/market/product/10136 but has different behaviour in placing Pending Order and TP Line. Automatically places Fibonacci retracement lines from the last highest and lowest visible bars on the chart with: An auto Pending Order (Buy/Sell). Taking Profit 1, Taking Profit 2 is pivot point and Taking Profit 3 for extended reward opportunity. The best risk and reward ratio. Simple and powerful indica
Chart Patterns Detect 15 patterns (Ascending Triangle, Descending Triangle, Rising Wedge, Falling Wedge, Bullish Flag, Bearish Flag, Bullish Rectangle, Bearish Rectangle Symmetrical triangle, Head and Shoulders, Inverted Head and Shoulders, Triple top, Triple Bottom, Double Top, Double Bottom) Use historical data to calculate the probability of each pattern to succeed (possibility to filter notification according to the chance of success) gives graphic indication about the invalidation level and
Indicador Taurus All4
Fabio Oliveira Magalhaes
Taurus All4 Taurus All4 is a high-performance indicator, it will tell you the strength of the trend, and you will be able to observe the strength of the candle. Our indicator has more than 4 trend confirmations. It is very simple and easy to use. Confirmation Modes Candle Trend Confirmations: When the candle switches to light green the trend is high. When the candle switches to light red the trend is reverting down. When the candle changes to dark red the trend is low. Trendline Trend Conf
Toroid
Tatiana Savkevych
Toroid - The indicator reflects information in a visual form, it can be used both for pipsing on small periods and for long-term trading. It generates fairly frequent and accurate signals. The indicator can be used as the main one for determining the trend. The indicator can work both for entry points and as a filter. Uses two parameters for settings. The smart indicator algorithm detects the trend, filters out market noise and generates input signals. It is based on the signals of elementary in
Wave Wolf MT4
Andrei Salanevich
Wave Wold MT4外汇指标旨在搜索狼波并将其显示在交易终端的当前窗口中。 对于在交易中使用狼波的交易者来说,这是一个很好的指标。 它在交易策略中的应用将显着提高其效率和盈利能力。 有关指标的信息 与其他Wolf wave指标不同,Wave Wold MT4外汇指标具有许多显着提高其有效性的功能: 第一个是打开的Windows5point参数(真值)提供信息支持,即扩展了狼波出现在其上的图表的窗口。 例如,如果EURUSD、AUDUSD和GBPUSD图表是开放的,并且每个图表都安装了Wave WOLD MT4指标,那么如果检测到欧元模型,相应的图表将自动被带到其他图表的顶部,这在交易大量工具时变得非常方便。  第二个功能是MACD上的内置发散分析,用户可以自己选择参数(默认设置(12,26,9))。 顺便说一下,通常振荡器的值不显示在工作窗口上,只反映在形成点(5)时的价格标签的颜色上,特别是,如果标签的颜色是蓝色,则没有发散,如果颜色是红 如何使用指标 Wave WOLD MT4指标显示第4个形成点的假设Wolf模型和第5个点的形成区域(所谓的甜区,以黄色显示)。
Pluuto Alert
Mati Maello
1 (1)
This indicator Pluuto Alert indicator.Indicator displays trend movement. Indicator calculates automatically line.Alert = arrow.When the alert is up the next alert is down,when the alert is down the next alert is up (new bar). Features FiltPer - displays indicator period.Line1. FiltPer2 - displays indicator period.Line2. Multiplier - displays indicator multiplier.(FlitPer,Line1;step) Deviation1 - displays indicator deviation.(Line2) Deviation2 - displays indicator deviation.(Arrow) Trend - displ
MACD Divergence
Sergey Deev
2.5 (2)
The indicator detects divergence signals - the divergences between the price peaks and the MACD oscillator values. The signals are displayed as arrows in the additional window and are maintained by the messages in a pop-up window, e-mails and push-notifications. The conditions which formed the signal are displayed by lines on the chart and in the indicator window. Indicator Parameters MacdFast - fast MACD line period MacdSlow - slow MACD line period MacdSignal - MACD signal line period MacdPri
The Wing Patterns indicator scans for many different kinds of Patterns using an XABCD structure. The term Wing Pattern is used to refer to all types of patterns based on a general XABCD structure, which is plotted in an alternate high-low extreme form. In other words, assume that point X is started at a low point on the chart. The point A is plotted at the next highest point within a certain number of bars. This certain number of bars is called the depth level. In this example, point B would be
Signal Finding
Maryna Shulzhenko
Signal Finding is a trend indicator, a technical analysis tool that helps to determine the exact direction of a trend: either an upward or a downward movement of the price of a trading instrument. Although these indicators are a little late, they are still the most reliable signal that a trader can safely rely on. Determining the market trend is an important task for traders. With this indicator, you can predict future values. But the main application of the indicator is to generate buy and sel
ATR Line MT4
Evgeny Levchenko
The indicator - "ATR Line" determines the current trend and gives signals to buy (green arrow to the top) or sell (red arrow to the bottom). The indicator calculation is based on the deviation of the average price of the instrument from its average true range - ATR. The moving average of prices is used to reduce "market noise". If the main line of the indicator - "ATR Line" is lower the instrument price chart, then the market is in a "bullish" trend. If the main line of the indicator is higher t
Description Trend Influencer is an indicator that determines the potential dynamics of the influence of trend wave movements on the market. The indicator is based on the value of moving averages corrected by the standard deviation. The indicator is displayed as a main dash-dotted moving average and a signal solid moving average. The signal moving average is colored blue or red depending on what type of trend is currently observed in the market. The indicator also draws inhibition levels - blue
Price River
Leonid Basis
The indicator creates 2 dot lines representing an upper and lower bands and the main indicator aqua line as the price power. If the main line is swimming inside the bands, then you should wait and watch before entering the market. When the main line jumps out or in the bands, then you should make a long or a short position.
DveMashki
Iurii Tokman
DveMashki   趋势方向的指标,该指标还固定价格走势的平坦部分。 指标设置说明: MaPeriod1 - 计算指标的第一个平均周期。 MaPeriod2 - 计算指标的第二个平均周期。 MaMethod - 平均方法。可以是以下任何枚举值:MODE_SMA - 简单平均,MODE_EMA - 指数平均,MODE_SMMA - 平滑平均,MODE_LWMA - 线性加权平均 MaPrice - 使用的价格。它可以是枚举值之一:PRICE_CLOSE - 收盘价,PRICE_OPEN - 开盘价,PRICE_HIGH - 期间的最高价,PRICE_LOW - 期间的最低价,PRICE_MEDIAN - 中间价,(高 + 低)/ 2,PRICE_TYPICAL -典型价格,(最高价 + 最低价 + 收盘价)/ 3,PRICE_WEIGHTED - 加权收盘价,(最高价 + 最低价 + 收盘价 + 收盘价)/ 4 MaPeriod3 - 用于计算指标的第三个平均周期。 MaPeriod4 - 用于计算指标的第四个平均周期。
Gioteen Volatility Index (GVI)   - your ultimate solution to overcoming market unpredictability and maximizing trading opportunities. This revolutionary indicator helps you in lowering your losing trades due to choppy market movements. The GVI is designed to measure market volatility, providing you with valuable insights to identify the most favorable trading prospects. Its intuitive interface consists of a dynamic red line representing the volatility index, accompanied by blue line that indicat
Trendiness Index
Libertas LLC
5 (3)
"The trend is your friend" is one of the best known sayings in investing, because capturing large trendy price movements can be extremely profitable. However, trading with the trend is often easier said than done, because many indicators are based on price reversals not trends. These aren't very effective at identifying trendy periods, or predicting whether trends will continue. We developed the Trendiness Index to help address this problem by indicating the strength and direction of price trend
ProZZcom
Uladzimir Izerski
3 (1)
Control over the indicator is performed by changing only one parameter directly on the chart. Innovative and precise algorithm for plotting the ZigZag peaks. The "ProZZcom" indicator plots a graphical layout, which allows to quickly find the points for accurate entries and for placing short stop orders. It also predicts a possible flat in the early stages, shows the trend direction and correction in the wave, draws the round levels, draws the Fibonacci level lines. The indicator works on any ins
The Advanced Bands Squeeze indicator is a custom indicator based on the classic Bollinger Bands as created by John Bollinger. The Bollinger Band Squeeze occurs when volatility falls to low levels and the Bollinger Bands narrow. This low volatility level is called a “Squeeze”.  According to John Bollinger, periods of low volatility are often followed by periods of high volatility, where prices tend to move a lot in either direction. Therefore, a volatility contraction or narrowing of the bands
D Ch Signal AM
Andriy Matviyevs'kyy
The presented indicator gives signals about the price leaving the Donchian channel, as well as about the price returning to the channel. Donchian channel - a technical indicator developed by Richard Donchian, is a variation of the trading interval breakout rule. It is built by taking the highest (high from High) and lowest (low from Low) prices for the previous n periods, followed by marking the area between them on the chart. Donchian recommended using his indicator for daily timeframes with an
FREE
该产品的买家也购买
TPSpro RFI Levels
Roman Podpora
4.82 (22)
指示       俄罗斯 -        英语   建议 与指示器一起使用     -       TPSpro 趋势专业版 -   MT4版本       交易中的一个关键要素是做出买卖交易工具决定的区域或水平。尽管主要参与者试图隐藏他们在市场中的存在,但他们不可避免地会留下痕迹。我们的任务是学习如何识别这些痕迹并正确解释它们。 主要功能: 向卖家和买家显示活跃区域! 该指标显示所有正确的初始买入和卖出脉冲水平/区域。激活这些水平/区域后,开始寻找切入点,水平会改变颜色并填充特定阴影。此外,还会显示箭头,以便更直观地了解情况。 显示更高时间范围内的级别/区域(MTF 模式) 添加了使用更高时间间隔显示级别/区域的功能。此外,该指标还具有自动趋势检测功能(   TPSproTREND PRO   )。 用于交易的单独专业的逐步算法。 该算法专为日内交易而设计,既可顺势交易,也可逆势交易。每个活动模板均提供详细说明。 适用于多种时间范围 。 TPSpro RFI 水平指标可用于图表上的任何时间范围,从一分钟(M1)开始一直到每月(MN)。 图形和声音警报。 该指标提供图形和声音指示
TPSproTREND PrO
Roman Podpora
4.79 (19)
TPSpro TREND PRO 是一个趋势指标,可以自动分析市场并提供有关趋势及其每次变化的信息,并给出进入交易的信号而无需重新绘制! 该指标使用每根蜡烛,分别对其进行分析。指不同的脉冲——向上或向下脉冲。货币、加密货币、金属、股票、指数交易的准确切入点! MT5版本                 指标的完整描述   我们建议将其与 指示器 -   RFI LEVELS 一起使用 主要功能: 准确的输入信号,无需渲染! 如果出现信号,它仍然相关!这是与重提指标的一个重要区别,重提指标可以提供信号然后改变信号,这可能导致存款资金的损失。现在您可以以更高的概率和准确度进入市场。还有一个功能是在箭头出现后为蜡烛着色,直到达到目标(止盈)或出现反转信号。 显示止损/获利区域 为了提高搜索切入点时的视觉清晰度,创建了一个模块,该模块最初显示买入/卖出区域,在该区域中搜索进入市场的最佳点。用于处理止损水平的附加智能逻辑有助于随着时间的推移减小其大小,从而降低进入交易(移动 sl)时的初始风险。 显示较高时间范围内的最小值/最大值(MTF 模式) 添加了一项功能,可以显示较高时间间隔的最小
Atomic Analyst
Issam Kassas
5 (2)
首先值得强调的是,该交易指标是非重绘、非延迟的指标,这使其成为手动和机器人交易的理想选择。 用户手册:设置、输入和策略。 Atomic Analyst是一种PA价格行动指标,利用价格的力量和动量来寻找市场上更好的机会。配备了高级过滤器,可帮助去除噪音和假信号,并提高交易潜力。使用多层复杂的指标,Atomic Analyst扫描图表,并将复杂的数学计算转化为任何初学者都能理解并用来做出一致交易决策的简单信号和颜色。 “Atomic Analyst”是专为新手和经验丰富的交易者量身定制的综合交易解决方案。它将高级指标和一流功能融合为一体的交易策略,使其成为所有类型交易者的多功能选择。 日内交易和剥头皮策略:专为快速准确的日内交易和短期交易而设计。 日内和摆动交易策略:可用作追求价格大幅波动的日内和摆动交易者的可靠工具。 多货币和市场:凭借其可靠的精度,在不同的工具和市场上运作。 多个时间框架:可在多个时间框架上使用,性能良好。 稳定性:所有指标均不重绘、不重绘和不滞后,确保可靠的信号。 信号清晰度:提供箭头信号,用于清晰的入场和出场点。 实时警报:通过交易入场、SL和TP警报通知交
MetaBands M4
Vahidreza Heidar Gholami
5 (2)
MetaBands使用强大且独特的算法绘制通道并检测趋势,以便为交易者提供进出交易的潜在点。它是一个通道指标和强大的趋势指标。它包括不同类型的通道,可以通过使用输入参数简单地合并以创建新通道。MetaBands使用所有类型的警报通知用户市场事件。 功能 支持大多数通道算法 强大的趋势检测算法 能够合并不同类型的通道 多时间帧和多货币(信号矩阵) 所有类型的警报功能(声音、屏幕闪烁、推送通知、电子邮件、弹出窗口、箭头) 它永远不会重绘 趋势检测 MetaBands使用在通道内振荡的蓝色线来检测趋势。当该线遇到通道的上界时,表明开始下跌趋势,当它遇到下界时,表明开始上涨趋势。如果蓝线接近中线,则市场处于整理期。 该指标使用独特的方法来检测趋势。一开始可能看起来有些复杂,但如果您观看视频教程,您就会意识到它是多么强大且易于使用。 入场和出场信号 当趋势变化或价格穿过上下通道时,MetaBands会立即通过不同的方法提醒交易者,这些方法可以在指标设置中启用。 信号矩阵 要监视来自不同时间框架的多个符号并在一个地方查看信号,请单击右上角按钮或按键盘上的M键以打开信号矩阵。该矩阵可以
Dynamic Forex28 Navigator - 下一代外汇交易工具。 当前 49% 折扣。 Dynamic Forex28 Navigator 是我们长期流行的指标的演变,将三种功能合二为一: 高级货币强度 28 指标 (695 条评论)+ 高级货币 IMPULSE 带警报 (520 条评论)+ CS28 组合信号(奖励)。 有关指标的详细信息 https://www.mql5.com/en/blogs/post/758844 下一代强度指标提供什么? 您喜欢的原始指标的一切,现在通过新功能和更高的精度进行了增强。 主要特点: 专有货币强度公式。  所有时间范围内的平滑和准确的强度线。 非常适合识别趋势和精确进入。 动态市场斐波那契水平(市场斐波那契)。  此指标独有的独特功能。 斐波那契应用于货币强度,而不是价格图表。 适应实时市场活动以获得准确的反转区域。 实时市场动量。  第 9 行显示市场是活跃还是被动。 对于定时交易至关重要。 全面的警报和显示。  每种货币最强的买入和卖出动量。 ​​28 对的双重动量买入和卖出。 超买/超卖警告外部范围
Scalper Inside PRO
Alexey Minkov
4.73 (56)
An exclusive indicator that utilizes an innovative algorithm to swiftly and accurately determine the market trend. The indicator automatically calculates opening, closing, and profit levels, providing detailed trading statistics. With these features, you can choose the most appropriate trading instrument for the current market conditions. Additionally, you can easily integrate your own arrow indicators into Scalper Inside Pro to quickly evaluate their statistics and profitability. Scalper Inside
Enigmera
Ivan Stefanov
5 (3)
ENIGMERA:市场核心 https://www.enigmera.com 简介 该指标和交易系统是金融市场的一种非凡方法。ENIGMERA 利用分形周期精确计算支撑位和阻力位。它能显示真实的累积阶段,并给出方向和目标。 该系统无论在趋势中还是在修正中都能发挥作用。 它是如何运行的? ENIGMERA 由三条线组成:支撑/阻力线、目标线和偏离线。与一般市场指标将过去的数据推断为现在和未来的情况不同,该系统能提供当前的完整情况。如果你处于支撑位,这意味着真正的支撑;如果你处于阻力位,这意味着真正的阻力。如果突破某一水平,则表示趋势发生变化。没有重绘。 由于市场在不断变化,ENIGMERA 不断调整其评估工具,定期修改策略。  这保证了每种情况都能得到全面评估。这一市场指标的独特性显而易见,其能力不言而喻。  ENIGMERA 为金融分析师和咨询师提供服务,他们需要可靠的见解与客户分享,也为投资者提供服务,他们需要最精确和最可靠的保证。 该系统能够达到最佳精度,使交易者能够自信、清晰地评估他们的选择。 ENIGMERA 将 20 年的交易专长和知识整合到一个综合软件
TrendMaestro
Stefano Frisetti
5 (3)
note: this indicator is for METATRADER4, if you want the version for METATRADER5 this is the link:  https://www.mql5.com/it/market/product/108106 TRENDMAESTRO ver 2.4 TRENDMAESTRO recognizes a new TREND in the bud, he never makes mistakes. The certainty of identifying a new TREND is priceless. DESCRIPTION TRENDMAESTRO identifies a new TREND in the bud, this indicator examines the volatility, volumes and momentum to identify the moment in which there is an explosion of one or more of these data a
FX Power MT4 NG
Daniel Stein
5 (12)
通过 mql5 和 Telegram 上 的晨间简报获取每日市场更新,包括详细信息和屏幕截图 ! FX Power MT4 NG 是我们长期以来非常受欢迎的货币强度计算器 FX Power 的下一代产品。 这款下一代强度计算器能提供什么?您所喜爱的原版 FX Power 的所有功能 附加功能 黄金/XAU 强度分析 更精确的计算结果 可单独配置的分析周期 可自定义计算限制,以获得更好的性能 为希望查看更多信息的用户提供特殊的多实例设置 无尽的图形设置,可在每个图表中设置您最喜欢的颜色 无数的通知选项,让您再也不会错过任何重要信息 采用 Windows 11 和 macOS 风格的全新圆角设计 神奇的移动指标面板 FX Power 主要功能 所有主要货币的完整强势历史 所有时间框架内的货币强弱历史 所有经纪商和图表的计算结果完全相同 100% 可靠的实时计算 -> 无重绘 可通过下拉列表选择分析时段 通过自定义模式单独配置分析时段 可在一个图表中使用多个实例 可移动 FX Power 显示屏(通过拖放) 适用于高分辨率 QHD、UHD 和 4K 显示器 自动终端配置 针对平板电脑
目前八折优惠! 对任何新手或专家交易者来说都是最好的解决方案! 这个仪表板软件适用于28种货币对。它基于我们的两个主要指标(高级货币强度28和高级货币冲动)。它对整个外汇市场提供了一个伟大的概述。它显示高级货币强度值,货币运动速度和28个外汇对在所有(9)时间段的信号。想象一下,当你可以使用图表上的单一指标观察整个市场,以确定趋势和或剥头皮的机会时,你的交易将得到改善 我们已经在这个指标中建立了一些功能,使你更容易识别强势和弱势货币,同时识别和确认潜在的交易。该指标以图形方式显示货币的强势或弱势是增加还是减少,以及它在所有时间段的表现。 增加的新功能是动态市场斐波那契水平,它适应当前的市场条件变化,这是一个已经在我们的高级货币强度28和高级货币冲动指标中使用的成熟的加分项。 在交易时,总是将弱势货币和强势货币配对,这个新指标将帮助你做到这一点。 用户手册:点击这里  https://www.mql5.com/en/blogs/post/708783 特点  显示每个时间段的ACS28和GAP-speed(冲动)的货币强度值。 列:颜色代码以7种颜色
FX Volume
Daniel Stein
4.58 (33)
通过 mql5 和 Telegram 上 的 " 晨间简报 "获取每日市场更新,包括详细信息和屏幕截图 ! 外汇交易量(FX Volume)是第一个也是唯一一个从经纪商角度真正洞察市场情绪的交易量指标。 直接在您的图表上看到这些信息是真正改变游戏规则和突破性的交易解决方案。 受益于独特的市场数据洞察,如 比率(Ratios )显示货币多头和空头头寸的比率(百分比 比率变化 显示所选时间段内的多头比率及其百分比变化 总交易量 显示货币的总交易量(多头和空头),以手为单位 多头 交易量显示货币所有多头头寸的交易量 空头 交易量显示所有货币空头头寸的交易量 净多头 显示净多头交易量,即所有多头头寸减去所有空头头寸(以手为单位)。 净多头百分比 显示货币净多头交易量的变化 请阅读我们的基本教程 -> "如何使用外汇交易量进行交易 " 获取更多信息,如常见问题、交易技巧和教程视频,请访问我们的 外汇交易量公共信息频道 请 安装并运行 SI Connect 以建立与我们数据中心的持续连接 背景信息 我们都知道,外汇是一个分散的市场。这就是为什么我们必须打破常规思维,开发一个独
Bomb Bank Signal
Igor Pereira Calil
5 (1)
炸彈銀行訊號:您對 MetaTrader 4 的信心指標 Bomb Bank Signal 是 MetaTrader 4 的一個強大指標,旨在識別金融市場中最相關的趨勢。如果您正在尋找一種能夠準確預測運動的工具,那麼炸彈庫就是您需要的盟友。 運作原理: 該指標結合了三種不同的方法——成交量分析、蠟燭收盤價和對稱趨勢——來偵測和發出買賣機會訊號。當炸彈銀行識別出買入機會時,它就像一顆「炸彈」;當它偵測到賣出訊號時,它就像一個「頭骨」。 為什麼炸彈銀行不一樣? 完全可靠性:炸彈庫訊號不會刪除訊號。訊號一旦發出,就會一直存在,確保您不會錯過任何機會。 極為準確:炸彈庫不會發出錯誤訊號。它會即時更新您的訊息,隨著市場的變化進行調整,但保持先前訊號的透明度。 即時更新:訊號被即時識別並在必要時更新,使您能夠快速響應市場變化。 最大化您的結果: 炸彈銀行訊號是識別趨勢持續走勢的理想選擇。例如,如果您已經做空並且指標在 M15 發出買入訊號,那麼現在就是平倉或部分下單的最佳時機,反之亦然。 此外,經過仔細分析,我們建議您遵循M30、H1和H4上的訊號,停損僅50點。這使
TakePropips Donchian Trend Pro
Eric John Pajarillaga Aldana
4.44 (16)
TakePropips Donchian Trend Pro   (MT4) 是一款功能强大且有效的工具,可使用 Donchian 通道自动检测趋势方向,并为您提供进场和退场交易信号! 这个多功能指标包括趋势扫描器、交易信号、统计面板、筛选器、交易时段和警报历史仪表板。它旨在为您提供交易信号并节省您分析图表的时间! 您可以在我们的博文中下载用户手册和安装指南:   https   :// www.mql5.com/en/blogs/post/751368 今天立减 50%!价格从 98 美元降到 49 美元! 您可以在 Strategy Tester 上测试该指标(启用可视模式) 视频教程也可在说明下方获得更多详细信息。 如果您有任何问题或需要任何帮助,请与我联系。 TakePropips Donchian Trend Pro 指标适用于所有外汇对、金属、商品、指数和加密货币。 主要特点 交易信号 - 检测多个时间范围内所有货币对的买卖机会。它将为您提供警报并在图表上绘制交易信号,最多 3 个止盈价和一个止损价。 Trend Scanner   - 用于快速扫描和识别跨多个时间
Supply and Demand Dashboard PRO
Bernhard Schweigert
4.8 (20)
目前八折优惠! 这个仪表板是一个非常强大的软件,可用于多个符号和多达9个时间段。 它是基于我们的主要指标(最佳评论:高级供应需求)。 Advanced Supply Demand 该仪表板提供了一个伟大的概述。它显示。   筛选后的供需值,包括区域强度评级。 区间内和区间外的点位距离。 它突出了嵌套的区域。 在所有(9个)时间段内,它对所选符号发出4种警报。 它是高度可配置的,以满足您的个人需求! 您的利益! 对每个交易者来说,最重要的问题是。 什么是入市的最佳水平? 在强大的供应/需求区域内或附近进入你的交易,以获得最佳的成功机会和风险/回报。 我的止损的最佳位置是哪里? 把你的止损放在强势供应/需求区的下方/上方是最安全的。 我的最佳盈利目标是什么? 你的退出策略和你的进入策略一样重要,了解更高的时间框架图可以帮助你。对于买入,使用下一个供应区作为目标,对于卖出,使用下一个需求区作为目标。在回撤到供应区或需求区时进场,以确保有足够的利润空间,达到更高的时间框架的供应和需求,将增加你的利润。 为什么我们要过滤强区和
Advanced Currency Strength28 Indicator
Bernhard Schweigert
4.9 (650)
目前26%的折扣 任何新手或专家交易者的最佳解决方案! 这个指标是一个独特的、高质量的、可负担得起的交易工具,因为我们纳入了一些专有的功能和一个新的公式。只需一个图表,你就可以读出28个外汇对的货币强度!想象一下,你的交易将如何得到改善,因为你的交易是在你的手中进行的。想象一下,你的交易将如何改善,因为你能够准确地确定新趋势或剥头皮机会的触发点? 用户手册:点击这里  https://www.mql5.com/en/blogs/post/697384 这是第一本,原版的! 不要买一个毫无价值的崇拜者的克隆品。 特别的 子窗口中的箭头显示强劲的货币势头GAP将指导你的交易! 当基础货币或报价货币处于超卖/超买区域(外盘斐波那契水平)时,在个人图表的主窗口中出现警告信号。 当货币力量从外围区间回落时,回撤/反转警报。 十字星模式的特别警报 可选择多个时间框架,以快速查看趋势! 货币强度线在所有的时间框架中都非常平稳,当使用较高的时间框架来识别总体趋势,然后使用较短的时间框架来确定精确的入口时,效果非常好。你可以根据自己的意愿选择任何时间框架。每个时间框架都由其自身进
Advanced Currency IMPULSE with ALERT
Bernhard Schweigert
4.9 (481)
目前31%的折扣!! 对任何新手或专家交易者来说都是最好的解决方案! 这个指标是一个独特的、高质量的、负担得起的交易工具,因为我们已经纳入了一些专有的功能和一个秘密的公式。只需一张图表,它就能给出所有28种货币对的警报。想象一下,你的交易将如何改善,因为你能够准确地确定新趋势或剥头皮机会的触发点 建立在新的基础算法上,它使识别和确认潜在交易变得更加容易。这是因为它以图形方式显示了一种货币的强势或弱势是否正在加速,并测量了这种加速的速度--把它想象成你汽车中的速度表。当你加速时,事情显然会发生得更快,这在外汇市场上也是一样的,即如果你配对的货币正在向相反的方向加速,你就会发现一个潜在的有利可图的交易。 货币动量的垂直线和箭头将指导你的交易! 动态的市场斐波那契23水平被用作警报触发器,将适应市场活动。如果冲动触及黄色触发线,您将在MetaTrader或您的电子邮件或推送警报中收到警报。然后你就知道作为一个交易员应该做什么。货币对和方向已经给出。只要点击警报按钮,就可以切换到该货币对或打开一个新的图表,以便进一步分析。警报级别可以通过用户输入来改变,可以选择3个敏感度级别
PZ Day Trading
PZ TRADING SLU
3.67 (3)
该指标仅使用价格行为分析和donchian渠道以锯齿形检测价格反转。它是专门为短期交易而设计的,根本不需要重新粉刷或补漆。对于精明的交易者来说,这是一个绝佳的工具,旨在增加他们的运作时间。 [ 安装指南 | 更新指南 | 故障排除 | 常见问题 | 所有产品 ] 极易交易 它在每个时间段都提供价值 实施自我分析统计 它实现了电子邮件/声音/视觉警报 基于可变长度的突破和拥挤区域,该指标仅使用价格行为来选择交易并对市场快速做出反应。 显示过去信号的潜在利润 该指标分析其自身的质量和性能 突围的损失突出显示并解决 该指标是不可重涂和不可重涂的 该指标将帮助盘中交易者不要错过单个价格反转。但是,并非所有价格反转都是一样的,也不是具有相同的可行质量。决定要突破哪些突破而忽略哪些取决于交易者的良好判断。 如何解释统计数据 该指标研究其自身信号的质量,并在图表上绘制相关信息。将分析每笔交易,并在图表的左上角显示总体历史结果,这使您可以针对任何给定的工具和时间范围自行优化指标参数。每个乐器和时间表都有其自己的最佳设置,您可以自己找到它们。 最大优惠交易:对于任何给定的交易,MFE都是
Advanced Supply Demand
Bernhard Schweigert
4.91 (294)
现在优惠 33%! 任何新手或专业交易者的最佳解决方案! 该指标是一款独特、高质量、且价格合理的交易工具,因为我们已经整合了许多专有功能和新公式。 依据此更新,您将能够显示双重时间帧区域。 您不仅可以显示一个较高的时间帧,还可以同时显示图表时间帧,加上更高的时间帧:显示嵌套时区。 供需双方所有交易者都会喜欢它。 :) 重要信息披露 高级供需的最大潜力,请访问 https://www.mql5.com/zh/blogs/post/720245   想象您的交易如何得以改善,是因为您能够精准定位入场或目标位吗? 构建于新的底层算法,它可以更轻松地识别出买卖双方之间的潜在失衡。 这是因为它以图形方式展示供需最强劲区域,及其过去的表现(显示旧区域)。 这些功能旨在帮助您更轻松地发现最佳入场区域和价位。 现在您可以针对您的交易品种和时间帧来优化和编辑区域强度! 高级供需指标适用于所有产品和时间帧。 它是一个新的公式,非常新的功能是两个区域强度函数可由用户输入进行调整! 这在交易中是一大优势。 当您学习如何使用专有功能,例如带有价格游离最小 X 因子的区域强度时,您能够判断该区域强劲与否。 供
Gold Channel XAUUSD
Paulo Rocha
5 (2)
Gold Channel is a volatility-based indicator, developed with a specific timing algorithm for the XAUUSD pair, which consists of finding possible corrections in the market. This indicator shows two outer lines, an inner line (retracement line) and an arrow sign, where the theory of the channel is to help identify overbought and oversold conditions in the market. The market price will generally fall between the boundaries of the channel. If prices touch or move outside the channel it is a tra
Currency Strength Exotics
Bernhard Schweigert
4.87 (30)
目前8折优惠! 对任何新手或专家交易者来说都是最好的解决方案! 这个指标是专门用来显示任何符号的货币强度,如异国货币对、商品、指数或期货。它是同类产品中的第一个,任何符号都可以添加到第9行,以显示黄金、白银、石油、DAX、US30、MXN、TRY、CNH等的真实货币强度。这是一个独特的、高质量的、负担得起的交易工具,因为我们已经纳入了一些专有的功能和一个新的公式。想象一下,你的交易将如何改善,因为你能够准确地确定新趋势或剥头皮机会的触发点? 用户手册:点击这里   https://www.mql5.com/en/blogs/post/708876 它适用于所有时间框架。你将很快能够看到TREND! 根据新的基础算法设计,它使识别和确认潜在交易变得更加容易。这是因为它以图形方式显示了8种主要货币和一种符号的强弱。 该指标显示了8种主要货币(澳元加元瑞士法郎欧元英镑日元新西兰美元)的强弱线,再加上一个符号! 该指标显示了符号的真实价值。例如:对于XAUUSD(黄金):价格以美元报价。如果黄金在上涨,你怎么能知道是黄金的强势还是美元的弱势?只有当黄金走强时,我们才会进行
Quantum Trend Monitor Indicator
QUANTUM TRADING SOFTWARE LIMITED
Currency pairs never go up or down in a straight line. They rise and fall constantly, creating pullbacks and reversals. And with each rise and fall, so your emotions rise and fall. Hope, then fear, then hope. This is when the market will try to frighten you out of a strong position. It is when you are most vulnerable. But not if you have the Quantum Trend Monitor. And here, you even get two indicators for the price of one! The Quantum Trend Monitor has been designed to absorb these temporary pau
Quantum Volume Point of Control Indicator
QUANTUM TRADING SOFTWARE LIMITED
5 (1)
The Quantum VPOC indicator has been developed to expand the two dimensional study of volume and price, to a three dimensional one which embraces time. The volume/price/time relationship then provides real insight to the inner workings of the market and the heartbeat of sentiment and risk which drives the price action accordingly. The Quantum VPOC indicator displays several key pieces of information on the chart as follows: Volume Profile - this appears as a histogram of volume on the vertical pr
XQ Indicator MetaTrader 4
Marzena Maria Szmit
3.67 (3)
Step into the realm of Forex trading with confidence and precision using XQ, a cutting-edge Forex indicator designed to elevate your trading game to unprecedented heights. Whether you're a seasoned trader or just stepping into the world of currency exchange,   XQ Forex Indicator   empowers you with the insights and signals needed to make informed trading decisions. The signal conditions are a combination of three indicators, and XQ Forex Indicator only display  medium and long-term trends . The
使用我们的自定义MT4指标发现成功外汇交易的秘诀! 您是否曾经想过如何在外汇市场上取得成功,一贯赚取利润,同时降低风险? 这是您一直在寻找的答案! 允许我们介绍我们的专有MT4指标,该指标将彻底改变您的交易方法。 独特的多功能性 我们的指标专为喜欢Renko和Rangebar Candle编队的用户而设计。 我们了解到,这些图表类型受到许多经验丰富的交易者的青睐,这就是为什么我们的指标与它们无缝集成,从而提供无与伦比的市场分析。 清晰的趋势信号 忘记复杂的分析! 我们的指标利用鲜艳的色彩和清晰的点结构来明确指示市场趋势。 红色和蓝色的点毫无疑问地对价格变动的方向留下了疑问,从而可以在您的交易中快速决策。 与HH/HL HL/LL策略对齐 如果您正在寻求一个指标,该指标无缝地与基于HH/HL和HL/LL结构的策略无缝合作,则不需要更多。 我们的工具不仅确定了这些形式,而且还促进了它们在投资过程中的有效利用。 绝对的清晰度和简单性 我们的首要任务是为您提供一种不仅有效而且易于使用的工具。 我们的指标是为了清晰而设计的,使您可以专注于做出投资决策,而不是
Quantum Trend Sniper Indicator MT4
Bogdan Ion Puscasu
4.64 (36)
介绍   量子趋势狙击指标 ,突破性的 MQL5 指标,正在改变您识别和交易趋势反转的方式!由拥有超过13年交易经验的资深交易员团队开发,     量子趋势狙击指标   旨在通过其创新的方式以极高的准确度识别趋势反转,将您的交易之旅推向新的高度。 ***购买量子趋势狙击指标,即可免费获得量子突破指标!*** 当量子突破指标识别出趋势反转时,它会向您发出警报和信号箭头,并建议您三个止盈水平。 它既适合新手交易者,也适合专业交易者。 量子 EA 通道:       点击这里 MT5版本:       点击这里 建议: 时间范围:  所有时间范围。为了获得最佳结果,我们建议在 M15、M30 和 H1 时间范围内使用它。 货币对:欧元兑美元、英镑兑美元、澳元兑美元、欧元兑英镑, EURAUD, XAUUSD 账户类型:ECN、Raw 或 Razor,点差极低 经纪时间:任意 经纪商:IC Markets、Pepperstone with Raw 和 Razor 的点差最低 建议止损:50 点 建议止盈水平:20 点、50 点和 1
Black dragon indicator
Ramil Minniakhmetov
4.85 (110)
趋势检测指标将补充任何策略,也可用作独立工具。 使用该指标的建议,您可以在评论 #8 中下载 好处 易于使用,不会因不必要的信息而使图表过载; 可用作任何策略的过滤器; 具有内置的动态支撑和阻力水平,可用于获利和设置止损; 指标在烛台关闭后不会改变颜色;  适用于股票市场、指数、石油、黄金和所有时间范围; 具有吐司通知、邮件通知、推送通知和声音提醒功能。 我的其他开发可以在这里找到: https://www.mql5.com/zh/users/mechanic/seller 输入参数 Alert - 开/关。警报; Push Notification - 开/关。推送通知; Mail - 开/关电子邮件通知; Fibo 1,2,3,4,5,6,7,11,21,31,41,51,61,71 - 动态支撑和阻力位的设置。
NextCandlePredictor No Repaint
Martin Alejandro Bamonte
1 (1)
NextCandlePredictor 指标 NextCandlePredictor 是一种带有警报的信号指标,不会重绘,不会改变颜色,不会移动,不会消失且没有延迟。它将帮助您识别任何时间框架内的下一个或即将到来的蜡烛的方向。高度推荐用于纽约、伦敦或甚至两者重叠等高波动市场。 主要特征: 时间框架的多功能性: 提供在任何时间框架内快速准确的信号,从 M1 到 H1 及更长时间。 清晰的买入/卖出信号: 使用 ADX 的 DI+ 和 DI- 线生成清晰的买入和卖出信号,确保您做出最佳的交易决策。 直观的可视化: 信号直接显示在图表上,绿色(买入)和红色(卖出)箭头,允许快速和轻松的读取。 可自定义的设置: 根据您的偏好和交易策略调整分析的柱数和警报选项。请根据您希望使用的 TF 查看下面的建议表。 即时和蜡烛收盘时的可选警报: 默认情况下,警报会在满足 ADX 条件的同一蜡烛上发出,确保信号的及时性。您还可以选择在当前蜡烛收盘时接收警报以获得更多确认。 快速性能: 设计为高效运行,理想用于高频操作和快速决策。 不重绘: 一旦信号发出,它将固定在当前蜡烛上,不会移动、改变颜色或消失。 无延
Trend Navigato
Oleksii Ferbei
The Forex indicator   TrendNavigator   is a technical indicator. TrendNavigator is a tool that allows traders employing this strategy to better understand what is happening in the market and predict in which direction the price will continue to move. The indicator's values are calculated based on price movements of the currency pair or any other financial asset. Within the scope of technical analysis, the TrendNavigator indicator is used by traders to forecast future price values or the overall
Royal Scalping Indicator M4
Vahidreza Heidar Gholami
4.17 (6)
Royal Scalping Indicator is an advanced price adaptive indicator designed to generate high-quality trading signals. Built-in multi-timeframe and multi-currency capabilities make it even more powerful to have configurations based on different symbols and timeframes. This indicator is perfect for scalp trades as well as swing trades. Royal Scalping is not just an indicator, but a trading strategy itself. Features Price Adaptive Trend Detector Algorithm Multi-Timeframe and Multi-Currency Trend Low
Cycle Sniper
Elmira Memish
4.39 (36)
NEW YEAR SALE PRICE FOR LIMITED TIME!!! Please contact us after your purchase and we will send you the complimentary indicators to complete the system Cycle Sniper is not a holy grail but when you use it in a system which is explained in the videos, you will feel the difference. If you are not willing to focus on the charts designed with Cycle Sniper and other free tools we provide, we recommend not buying this indicator. We recommend watching the videos about the indiactor and system before pu
作者的更多信息
SFT Full OsMA
Artem Kuzmin
4 (1)
A classic indicator with advanced features for more accurate display of the market situation. All settings of all moving averages are available, such as the moving average type and the priced used in its calculation. It is also possible to change the appearance of the indicator - line or histogram. Additional parameters provide the ability of fine tuning. Distinctive features Does not redraw. Additional parameters for fine tuning. Displayed as a line or as a histogram. Works on all timeframes
FREE
A new interpretation of the classical indicator in the form of an oscillator for a more accurate representation of the situation on the market. Less lagging than the standard Alligator. All settings are fully accessible, such as the type and prices for which it is built. Thanks to the additional parameters, it became possible to fine tune. Distinctive features Does not redraw. Additional parameters for fine tuning. Works on all timeframes and symbols. Suitable for manual trading and developm
FREE
The support and resistance levels are among the main components of the entire technical analysis. They are used both by professional traders and by beginners. Prices usually move within the price channels. The upper boundary of such a channel is called resistance, and the lower one is support. This indicator plots fractal support and resistance lines at the highest and lowest local price values (fractals). Distinctive features Does not redraw. Clear and understandable signals. It is possible t
SFT Go Trend
Artem Kuzmin
Opening positions in the direction of the trend is one of the most common trading tactics. The main idea is that the probability of the trend continuation is higher than that of its change. This indicator determines the direction of a local movement, marking the beginning of a trend with a large dot and its continuation with a line of the corresponding color. Distinctive features No Repaint. Simple and accurate settings. Clear and understandable signals. Works on all timeframes and symbols. Su
This highly informative indicator applies overbought/oversold levels for more accurate representation of the market situation. It is also possible to change the appearance of the indicator - line or histogram. Additional parameters enable more fine-tuning, while trading can be inside the channel and along a trend. Distinctive features Oversold/overbought levels; Does not redraw. Displayed as a line or a histogram; Works on all timeframes and symbols. Suitable for manual trading and developmen
MACD indicator with overbought and oversold zones. Two display options - classic lines and a histogram. Can be used to detect a possible reversal or pullback in price, as well as for channel strategies All settings are simple and straightforward - all like a standard indicator, but with additional support and resistance levels Can be used both separately and together with other indicators
Awesome oscillator with overbought and oversold zones. A series of OBS indicators (overbought and oversold) - these are indicators enhanced with overbought and oversold zones. This makes it possible to determine when the instrument is trending, as well as when it is flat. Works on all timeframes, all currency pairs, metals and cryptocurrencies. Can be used with binary options. Settings OBS Period - period of overbought and oversold calculation
Accelerator indicator with overbought and oversold zones. A series of OBS indicators (overbought and oversold) - these are indicators enhanced with overbought and oversold zones. This is the standard indicator, but it provides additional possibilities for the analysis of any market. Thanks to a special algorithm, this indicator has overbought zones =70 and =100, as well as oversold zones -70 and -100, which allows you to use it to determine the possible reversal or pullback of the price, as well
The Bears indicator with overbought and oversold zones. Two display options - as a line and as a histogram.  A series of OBS indicators (overbought and oversold) - these are indicators enhanced with overbought and oversold zones. This is the standard indicator, but it provides additional possibilities for the analysis of any market. Thanks to a special algorithm, this indicator has overbought zones =70 and =100, as well as oversold zones -70 and -100, which allows you to use it to determine the
Bulls indicator with overbought and oversold zones. Two display options - as a line and as a histogram. OBS (overbought and oversold) indicator series - are indicators that have been provided with overbought and oversold zones. This is the standard indicator, but it provides additional possibilities for the analysis of any market. Thanks to a special algorithm, this indicator has overbought zones =70 and =100, as well as oversold zones -70 and -100, which allows you to use it to determine the p
The Force Index indicator with overbought and oversold zones. Two display options - as a line and as a histogram.  A series of OBS indicators (overbought and oversold) - these are indicators enhanced with overbought and oversold zones. Settings OBS Period - overbought/oversold calculation period Force Period - period of Force Price MA - prices for MA calculation Method MA - MA calculation method Line or Histo - display by line or histogram
Multicurrency indicator Any chart obs is a price chart with a percentage scale. Can be displayed as a line and as a histogram. There is also a reverse function available, it mirrors the chart. The name of an instrument to be displayed is specified in the input parameters, the current symbol is used on default. The indicator doesn't have lags as it is not smoothed with any formulas, but bound to a percentage scale, what allows detecting the price equilibrium, the overbought and oversold state. Th
The Accumulation indicator with overbought and oversold zones. Two display options - as a line and as a histogram.  A series of OBS indicators (overbought and oversold) - these are indicators enhanced with overbought and oversold zones.  Simple and straightforward settings that are easy to match to the right tool In the indicator, you can adjust: Display depth of the indicator Color of indicator levels
指标提供良好的信号,趋势反转 或离开该单位时,价格变动的可能方向。 功能和设置: Sensitivity       = 3         - (下图中为例)的多个信号的灵敏度为1〜 5 ,较高的值; DeepBars        = 3000 - 深度计显示; ZeroBarCalc     = FALSE;  - 用于在零杆的计算,如果是这样的信号将被使用,但目前的蜡烛结束前可能会消失; UseAlert          = FALSE;   - 包容警告; AlertSound      = TRUE;   - 声音; AlertMessage = TRUE;         - 显示; AlertMail          = FALSE;   - 发送消息到邮局; FileSound          = “ alert2.wav ” ; - 文件磬;
显著指标计算的价格水平,如果红的水平,那么价格将其分解,如果蓝到了。如果价格接近蓝色级别低于他的罢工toskoree总价,如果顶部更容易从水平反弹。同样,如果价格移动到红色顶层,它很可能是故障的水平,如果低于,则有可能反弹。 因为酒吧的水平已失去意义从计划中删除后得出水平等于CalculationBars 。 非常适合用于交易市场上挂单:停止改正的趋势和限制, SL和TP水平下一个最低/最高价格设定。与此交易建议的比例SL / TP为不小于1/2。     设置及说明: CalculationBars - 酒吧来计算的水平; LineLength -个长度的线棒; Filtr- 滤噪平滑的价格,价值较低的级别越高( 1 〜100 ) ; UpColor -色水平,该价格打破了; DnColor - 色水平,该价格打破了; LineWidth- 线宽,线的粗细;
Trend Factor
Artem Kuzmin
An indicator for entering with trend and timely exiting. It has sensitivity setting, by adjusting which it can be applied to both long-term and short-term speculation.  The highest sensitivity = 1, with this setup, you can even scalp on M1. No lag, does not withdraw after candlestick closure.  One of the use options: enter after a candlestick closes, if the vertical line consists of squares of the same color; exit if the color of two or more squares changes. Before using it, be sure to analyze t
The indicator builds fractals on extrema of the OsMA indicator Appears on the chart as a fractal or a fractal channel. It has a flexible setting and, in contrast to the standard fractals, lags only by 1 bar. Settings: DeepBars - the indicator's depth of display; Sensitivity_1_or_2 - 1 - for small periods of OsMA, 2 - for large periods; Arrow_or_channel - display on the chart fractals or channel; FastMA - period of the fast moving average;  SlowMA - period of slow moving average;  SignalSMA -
Good Filtr
Artem Kuzmin
This is an indicator for additional signal filtering. It can be used as an additional filter in a trading system. The indicator does not redraw its data and can be used both in forex trading and with binary options. It has 3 operation modes and flexible sensitivity settings. The indicator uses multiple buffers, therefore it can be easily used in various Expert Advisors.
Flat Factor
Artem Kuzmin
5 (1)
The indicator is designed for visual determining market directions. It allows to determine the distance from a price and helps in drawing correct conclusions. Perfectly defines flat zones, horizontal intraday trends and trend movements, and an additional setting allows to use the indicator on any instrument. Does not redraw its readings. You get professional trading indicator for a reasonable price. Settings: Period_FF = 7 - indicator period Sensitivity_FF = 5 - sensitivity in % Wish you all s
Extremum bars
Artem Kuzmin
The indicator colors bars displaying prices of overbought and oversold areas on the chart. It will help you to estimate moments when market climate changes and the price has its local extreme values. It can be used both independently and as a good supplement to any channel trading system. And this indicator is easy-to-use in expert advisors due to usage of indicator buffers instead of graphical objects. Settings ExtPeriod = 100 — indicator period; Sensitivity = 80 — indicator sensitivity.
This is a moving average which can move not only to the right/left, but also up/down. You can also select a mode of displaying the indicator (as a line or as dots) and all other settings of a standard moving average. If you overlay several indicators in one window, you can clearlier determine price channels setting each border individually. Settings Line_or_Dot - mode of displaying the indicator: true - as a line, false - as dots; MA_period - moving average period; MA_shift_X - number of candl
Alarm arrow indicator of increased sensitivity After closing the candle the arrows do not disappear Allows you to enter the transaction on time at the lowest price movements Can be used on any currency pairs, metals and cryptocurrency Suitable for working with binary options Distinctive features Does not redraw; Determines the price correction; Advanced settings for fine tuning; Works on all timeframes and on all symbols; Suitable for trading currencies, metals, options and cryptocurrency (Bitco
SFT Full MACD
Artem Kuzmin
A classic indicator with advanced features for more accurate display of the market situation. All settings of all moving averages are available, such as the moving average type and the priced used in its calculation. It is also possible to change the appearance of the indicator - line or histogram. Additional parameters provide the ability of fine tuning. Distinctive features Does not redraw. Additional parameters for fine tuning. Displayed as a line or as a histogram. Works on all timeframes
This highly informative indicator applies overbought/oversold levels for more accurate representation of the market situation. All moving average settings are available, including average type and price it is based on. It is also possible to change the appearance of the indicator - line or histogram. Additional parameters enable more fine-tuning, while trading can be inside the channel and along a trend. Distinctive features Oversold/overbought levels; Does not redraw. Additional parameters fo
Arrow indicator, to determine adjustments and local trends The arrow appears on the current bar and after closing the bar will not disappear. Allows you to enter the transaction at the very beginning of the movement Thanks to the flexible settings you can use on any currency pairs, metals and cryptocurrency Can be used when working with binary options Distinctive features Does not redraw. Additional parameters for fine tuning. Works on all timeframes and symbols. Suitable for trading c
Opening positions in the direction of the trend is one of the most common trading tactics. This indicator determines the direction of the local movement and colors the candles on the chart in the appropriate color. Allows you to enter the transaction at the very beginning of the movement Thanks to the flexible settings you can use on any currency pairs, metals and cryptocurrency Can be used when working with binary options Distinctive features Does not redraw. Additional parameters for
One of the main components of successful trading is the correct determination of the direction of the market. This indicator shows the general directionality of the price movement and is painted in the corresponding color. Allows you to conduct trend and counter trend trading It works on all timeframes, on any currency pairs, metals and cryptocurrency Can be used when working with binary options Distinctive features Does not redraw; Simple and clear settings; Works on all timeframes and symbo
Arrow indicator, for determining price reversals Arrow appears on the closed bar Allows you to enter the transaction at the very beginning of the turn Can be used on any currency pairs, metals and cryptocurrency Suitable for working with binary options Distinctive features Determines the price correction; Advanced settings for fine tuning; It works on all timeframes and on all symbols; Suitable for trading currencies, metals, options and cryptocurrency (Bitcoin, Litecoin, Ethereum, etc.) Suita
筛选:
无评论
回复评论
版本 1.1 2022.04.25
Compiled in a new build